

Abstract
Serotonin (5-HT) action via the 5-HT2C receptor (5-HT2CR) provides an important modulatory influence over neurons of the prefrontal cortex (PFC), which is critically involved in disorders of executive function including substance use disorders. In the present study, we investigated the distribution of the 5-HT2CR in the rat prelimbic PFC (PrL), a subregion of the medial PFC (mPFC), using a polyclonal antibody raised against the 5-HT2CR. The expression of 5-HT2CR immunoreactivity (IR) was highest in the deep layers (layerV/VI) of the mPFC. The 5-HT2CR-IR was typically most intense at the periphery of cell bodies and the initial segment of cell processes. Approximately 50% of the 5-HT2CR-IR detected was found in GAD 67-positive neurons. Of the subtypes of γ-aminobutyric acid (GABA) interneurons identified by expression of several calcium-binding proteins, a significantly higher percentage of neurons expressing IR for parvalbumin also expressed 5-HT2CR-IR than did the percentage of neurons expressing calbindin-IR or calretinin-IR that also expressed 5-HT2CR-IR. Since parvalbumin is located in basket and chandelier GABA interneurons which project to cell body and initial axon segments of pyramidal cells, respectively, these results raise the possibility that the 5-HT2CR in the mPFC acts via the parvalbumin-positive GABAergic interneurons to regulate the output of pyramidal cells in the rat mPFC.
Keywords: Immunohistochemistry, parvalbumin, calbindin, calretinin, prelimbic prefrontal cortex
Recent advances in understanding the neural circuitry and mechanisms underlying the vulnerability to drug abuse, the progression of drug use to addiction, and the triggers for relapse provide hope that new therapeutic approaches are forthcoming for this brain disorder (Kalivas and Volkow, 2005; Koob and Le, 2005; Hyman et al., 2006). A loss of the normal regulatory role for prefrontal cortex (PFC) over the mesoaccumbens dopamine (DA) circuit that is central to drug reward has been identified as a key component in addiction, and pharmacological approaches to reinstate normal PFC function may prove to be therapeutically useful (Kalivas and Volkow, 2005). The PFC is densely innervated by serotonin (5-HT) neurons of the midbrain (Van Bockstaele et al., 1993) and actions via the family of 5-HT2 receptors (5-HT2R) provides an important modulatory influence over PFC function (Pompeiano et al., 1994; Clemett et al., 2000; Lopez-Gimenez et al., 2001). Recent reports have outlined an inhibitory role for the PFC 5-HT2CR in mediating the behavioral effects of psychostimulants such as cocaine (Filip and Cunningham, 2003) and 3,4-methylenedioxymethamphetamine (MDMA; Ramos et al., 2005). While both transcript and protein for the 5-HT2CR have been localized in PFC (Pompeiano et al., 1994; Clemett et al., 2000; Lopez-Gimenez et al., 2001; Pandey et al., 2006), a better understanding of the mechanisms of action through which the PFC 5-HT2CR controls stimulant-induced behaviors is required, and a first step in this analysis is to gain a more complete understanding of the localization of the 5-HT2CR protein in PFC.
The rat PFC has been divided into medial, lateral and ventral regions (Dalley et al., 2004). The medial PFC (mPFC) in rat is suggested to share analogous function with the PFC in human and, as such, appears to be involved in working memory, attention, and reward (Tzschentke, 2000; Dalley et al., 2004). The rat mPFC consists of the anterior cingulate cortex (ACC), the prelimbic PFC (PrL), and the infralimbic PFC (IL; Dalley et al., 2004; Paxinos and Watson, 2005). The most prominent subcortical afferents to the mPFC arise in the mediodorsal nucleus of the thalamus (Fuster, 1997). The mPFC also receives input from the raphe nuclei, the ventral tegmental area (VTA), the hypothalamus as well as other neocortical regions, while efferent pathways leave the mPFC to reciprocally innervate practically every structure which sends fibers to this cortical region (Fuster, 1997). The two major cell types that exist in the mPFC are glutamate-containing pyramidal projection neurons and γ-aminobutyric acid (GABA) local circuit interneurons (Gabbott et al., 1997; Fuster, 1997). The GABA interneurons form numerous synapses on pyramidal projection neurons and play a crucial regulatory function over PFC pyramidal output (Eyles et al., 2002). Several subclasses of GABA interneurons exist in the mammalian cerebral cortex, which are distinguished by the expression of the defined calcium-binding proteins parvalbumin, calbindin, and calretinin (Andressen et al., 1993; Gabbott et al., 1997). Interneurons which express parvalbumin, calbindin, or calretinin have distinct morphological and neurochemical, electrophysiological characteristics (Andressen et al., 1993; Conde et al., 1994; Gabbott et al., 1997; Gonzalez-Burgos et al., 2005). As such, knowledge of the distribution of the 5-HT2CR among neuronal subpopulations in the mPFC may provide insight into the nature of 5-HT2CR control of cortical function at the cellular level.
The purpose of the present study was to investigate the distribution of the 5-HT2CR protein in the mPFC and the localization of 5-HT2CR to subtypes of GABA neurons in the PrL area of the mPFC. The PrL was chosen as a representative area of the mPFC as the distribution of the subtypes of GABA neurons has been shown to be similar across the three subregions of the mPFC (Gabbott et al., 1997). To this end, we have employed double-label, fluorescence immunohistochemistry to simultaneously visualize the 5-HT2CR protein (Bubar et al., 2005; Bubar and Cunningham, 2007) in GABA neurons labeled with the synthetic enzyme glutamic acid decarboxylase (GAD 67), and/or the calcium-binding proteins parvalbumin, calbindin, and calretinin. Investigation of the 5-HT2CR localization in this population of neurons in the mPFC will provide insight into the molecular mechanisms underlying the function of the 5-HT2CR localized to PFC and its role in disorders of executive function, such as addiction.
Experimental Procedures
Animals
Naïve, male Sprague-Dawley rats (Harlan, Houston, TX, USA) weighing 250–300 g were used. The rats were housed four to a cage in standard plastic rodent cages in a colony room maintained at 21±2°C and at 40–50% humidity under a 12-h light/dark cycle (06:00–18:00 h) for at least one week before experiments. Food and water were available ad libitum. All experiments were carried out in accordance with the NIH Guide for the Care and Use of Laboratory Animals (National Institute of Health, 1986) and with approval by the UTMB Institutional Animal Care and Use Committee.
Antibodies
For Western blot analyses, the affinity purified goat polyclonal anti-5-HT2CR antibody [SR-2C (N-19): sc-15081, Lot No. L0904, Santa Cruz Biotechnology, Inc., CA] was used at a concentration of 1:500 at 4°C overnight. The monoclonal mouse anti-post-synaptic density-95 (PSD-95) antibody (MAB1598; Chemicon, Temecula, CA) was used at a concentration of 1:1000 at room temperature for 1 hr. The monoclonal mouse anti-syntaxin antibody (MAB336; Chemicon) was used at a concentration of 1:5000 at room temperature for 1 hr. Secondary antibodies utilized include horseradish peroxidase (HRP) conjugated sheep anti-mouse (1:2000–1:5000; AP300P; Chemicon.) and donkey anti-goat secondary antibody (1:2000; 6420-05; Southern Biotech, Birmingham, AL).
For immunohistochemical analyses, the following primary antibodies were used: anti-5-HT2CR polyclonal antibody raised in goat (1:100 dilution, sc-15081, lot G102, Santa Cruz Biotechnology, Inc.,) (Bubar et al., 2005); anti-glutamic decarboxylase 67 (GAD 67) polyclonal antibody raised in rabbit (1:150 dilution, sc-5602; Santa Cruz Biotechnology, Inc.); anti-parvalbumin monoclonal antibody raised in mouse (1:1000 dilution, P-3088, Sigma-Aldrich Corp.); anti-calbindin monoclonal antibody raised in mouse (1:1000 dilution, C-9848, Sigma-Aldrich Corp.); anti-calretinin polyclonal antibody raised in rabbit (1:3000 dilution, AB-5054, Chemicon International, Inc.). The following secondary antibodies were used: donkey anti-goat antibody conjugated to Alexa Fluor® 488 (1:500 dilution, A-11055, Invitrogen Corporation, Carlsbad, CA, USA); donkey anti-rabbit antibody conjugated to Alexa Fluor® 555 (1:2000 dilution, A-31572, Invitrogen Corporation); donkey anti-mouse antibody conjugated to Alexa Fluor® 555 (1:2000 dilution, A-31570, Invitrogen Corporation). All antibodies were diluted to the final concentration in blocking buffer (as above).
Western Blot Analyses
Subcellular Fractionation and Post-Synaptic Density Isolation
The post-synaptic density (PSD) was isolated according to a subcellular fractionation protocol slightly modified from published protocols (Phillips et al., 2001; Moron et al., 2007). In brief, naive rats (n=4) were anesthetized using chloral hydrate (800 mg/kg, IP) and PFC tissue was microdissected, pooled and homogenized in 0.32 M sucrose solution [0.1 mM CaCl2] containing protease inhibitor cocktail (Sigma-Aldrich Corp., St. Louis, MO, Cat. No. P8340) and phosphatase inhibitor cocktails 1 and 2 (Sigma-Aldrich Corp., Cat. No. P2850 and P5726, respectively). An aliquot (total homogenate fraction) was taken. The remaining homogenate sample was brought to a final concentration of 1.25 M sucrose solution by adding 2 M sucrose and 0.1 mM CaCl2 and was transferred to a 25 mL ultracentrifuge tube, overlaid with 1 M sucrose and subsequently ultracentrifuged in a fixed angle rotor (50.2 Ti Rotor, Beckman) at 28,000 RPM for 3 hrs at 4°C. The synaptosomal fraction was collected at the interface of the 1.25 M and the 1 M sucrose phase and diluted in 15.6 mL hypotonic solution [0.1 mM CaCl2, 1 M Tris pH 6 buffer, 10% Triton X-100 and protease and phosphatase inhibitor cocktails], mixed for 20 min at 4°C and ultracentrifuged at 21,000 RPM for 20 min at 4°C. The supernatant was discarded. The pellet (containing the synaptic junction) was resuspended in 10 mL of buffer [20 mM Tris, 1% Triton X-100, pH 8], mixed for 20 min at 4°C and ultracentrifuged at 21,000 RPM for 20 min at 4°C. The supernatant (containing presynaptic active zone) was discarded and the pellet (containing the PSD) was resuspended in 10 mL pH 8 buffer, mixed for 20 min at 4°C and ultracentrifuged at 21,000 RPM for 20 min at 4°C. The resultant supernatant was discarded and the remaining pellet (PSD fraction) was resuspended in 1% SDS. Both aliquots (total homogenate and PSD) were frozen at −80°C until protein analysis was conducted. Total protein concentration was determined for each fraction using a BCA protein determination kit (Pierce, Rockford, IL). Equal amounts of protein (7 μg from each fraction; reduced with an appropriate volume of Laemmli sample buffer with DTT for 20 min at 70°C) were separated by SDS-PAGE using a 10% BisTris pre-cast gels (Novex, San Diego, CA).
Western Blot Assay
Following gel electrophoresis, proteins was transferred to a PVDF membrane (BIORAD, Hercules, CA) via semi-dry electroblotting (Alltech, Deerfield, IL) for 2 hr at 18V. The membrane was blocked with 5% milk for 2 hr, followed by incubation with the primary antibody for 1 hr-overnight. Membranes were rinsed 3 × 20 min in TBS + 1% Tween (TBS-T), and incubated with the secondary antibody for 45 min. Membranes were rinsed again 3 × 10 min in TBS-T prior to incubation with the Enhanced Chemiluminescence Plus (ECL) Western blotting detection reagents (Amersham Biosciences, Piscataway, NJ) for 5 min. The membrane were exposed to film [Midwest Scientific Bplus Ref EBA45 (8×10 in)] for 1 sec to 10 min, depending upon the antibody being detected. The membrane was probed with all three antibodies; antibodies were stripped from the membrane via incubation in Re-blot Plus Mild (Chemicon) for 7–15 min prior to re-probing with each additional antibody according to the procedures described above. For peptide neutralization studies, the anti-5-HT2CR antibody was combined with a 4–fold excess of its corresponding blocking peptide (sc-15081 P; Santa Cruz Biotechnology) in a final volume of 500 μL TBS at 4°C overnight. Following blocking, the mixture was diluted in 1% Milk TBS to proceed with the western blot assay.
Immunohistochemical Analyses
Perfusion and sectioning
Rats (n = 4) were anaesthetized with sodium pentobarbital (100 mg/kg) and transcardially perfused with 10 mmol/L phosphate buffered saline (PBS, pH 7.2) followed by 3% paraformaldehyde in 10 mmol/L PBS (pH 7.2). Brains were removed, blocked at mid-pons, and postfixed in 3% paraformaldehyde of PBS for 2 h at room temperature. Brains were then cryoprotected in 30% sucrose for 48 h at 4°C, rapidly frozen on crushed dry ice, and stored at −80°C until sectioning. Coronal sections (20 μm) containing the mPFC (−2.7 through −3.7 mm from Bregma) were taken from all brains using a cryostat at −20°C (Leica CM 1850, Leica Microsystems Nussloch GmbH, Nussloch, Germany) according to the atlas of Paxinos and Watson (Paxinos and Watson, 2005). For one rat, thicker sections (40 μm) adjacent to 20 μm sections were taken for the cresyl violet staining to determine the layers of PrL.
Immunohistochemistry
Immunohistochemistry was performed on free-floating brain sections (20 μm) according to a previously published protocol (Bubar et al., 2005; Bubar and Cunningham, 2007). Briefly, brain sections were washed (5 × 10 min) with 10 mmol/L PBS (pH 7.2) using an orbital shaker and incubated for 60 min in blocking buffer (PBS supplemented with 1.5 % normal donkey serum, Jackson ImmunoResearch Laboratories, Inc., West Grove, PA, USA) at room temperature under continuous agitation on an orbital shaker. The blocking buffer was aspirated, and the sections were incubated with the appropriate primary antibody. Incubation was carried out for 44 hours at 4°C, under continuous agitation on an orbital shaker. After six washes (6 min each wash) in 10 mmol/L PBS (pH 7.2), the sections were protected from light and further incubated for 60 min at room temperature with the appropriate secondary antibody. Sections were washed with PBS (3 × 10 min) and mounted using a 0.1% Dreft® solution onto gelatin chromium-coated slides. The slides were then coverslipped using Vectashield® fluorescent mounting medium with DAPI (4′, 6-diamidoino-2-phenylindole; Vector Laboratories, Ltd., Burlingame, CA, USA) to label nuclei, and stored protected from light at 4 C until viewing.
Nissl staining
Brain sections (40 μm) adjacent to the sections processed for the 5-HT2CR immunohistochemistry in one rat were processed for Nissl staining to identify basic neuronal structures. Slides with the 40 μm brain sections were immersed for 2 min in each of the following: 95% alcohol, 70% alcohol, and distilled water. Sections were stained in 0.5% cresyl violet for 2–3 min, differentiated in water for 0.5 min and then dehydrated for 2 min in each of the following: 70% alcohol, 95% alcohol, 100% alcohol, placed in Histoclear (National Diagnostics, Atlanta, GA, USA) for 10 min and cover-slipped with Permount (Fisher Scientific, Fair Lawn, NJ, USA). The slides were cleaned and viewed after they were dry.
Image analysis
Digital images were captured from brain sections using an Olympus BX51 fluorescent microscope (Olympus America Inc., Melville, NY, USA) equipped with a Hamamatsu camera (Model C4742-95, Hamamatsu Corp., Bridgewater, NJ, USA) interfaced to a personal computer with SimplePCI software (version 5.1, Compix Inc., Cranberry Township, PA, USA). A 4x, 10x, 20x, or 40x objective was used to capture all photographs for final magnification of 40x, 100x, 200x, or 400x, respectively. Photomicrographs (at a magnification of 40x) were taken of areas which were 2130 μm × 1700 μm and included layers I to VI of the PrL (see box in Figure 1). These photomicrographs were used to quantify the expression of 5-HT2CR-immunoreactive (IR) cells in superficial (layers I and II/III) and deep layers (layers V and VI) of the PrL and their colocalization with GAD 67-, parvalbumin-, calbindin- or calretinin-IR. Three coronal sections including the mPFC were taken from each rat at +3.2 mm anterior-posterior from bregma. Photomicrographs at a magnification of 100x were taken from layers I–VI of the PrL and used to show location of 5-HT2CR-IR. Photomicrographs with magnification of 200x were taken from layer V of the PrL and used to show the colocalization of the 5-HT2CR with either GAD 67, parvalbumin, calbindin or calretinin. Photomicrographs with magnification of 400x were taken from layer V of the PrL and used to show subcellular staining pattern of the 5-HT2CR-, GAD 67-, parvalbumin-, calbindin-, and calretinin-IR. Green fluorescence emitted by the Alexa Fluor® 488 antibodies was visualized using a yellow GFP filter set (#41017; Chroma Technology Corporation, Rockingham, VT, USA), while the red fluorescence emitted by the Alexa Fluor® 555 antibodies was visualized using a narrow band green excitation filter set (U-MNG2, Olympus). In addition, DAPI staining was visualized using a blue GFP II filter set (#31041, Chroma Technology Corporation). For each section, up to three images were captured of the same viewing area, one for each filter set detecting immunoreactivity (IR) for each antibody and DAPI, and then resultant images were overlaid.
Figure 1. Western blot analysis demonstrating detection of the 5-HT2CR in the PSD of the PFC.
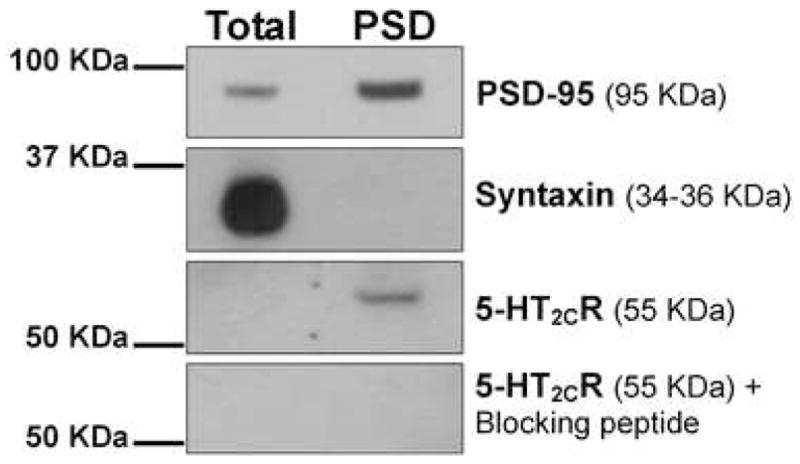
Total homogenate (Total) and PSD-associated proteins (PSD) from the PFC were analyzed by Western blot using antibodies against PSD-95 (a post-synaptic density marker), syntaxin (a pre-synaptic marker) and the 5-HT2CR. In addition, peptide neutralization of the 5-HT2CR antibody with its appropriate blocking peptide eliminated the anti-5-HT2CR antibody-associated band. Data presented are from a single blot that was stripped and re-probed. Location of the molecular weight markers are shown to the left of the blots.
To investigate distribution of the 5-HT2CR-IR and its colocalization with GAD 67-IR and parvalbumin-, calbindin- and calretinin-IR in the PrL, the images were analyzed using a program written in MATLAB (The MathWorks, Inc., Natick, MA, USA) by Dr. Gilbert R. Hillman (Hillman and Johnston, 1983; Sepulveda et al., 2006). Red and green channels of the image data were used separately for analysis. Correction for variation in background staining was accomplished by comparing the intensity of each pixel to that of a local 50×50 pixel region. Pixels with intensity higher than background by a selectable number of gray levels were counted as labeled. This intensity difference between pixels and background around pixels used to identify a cell was chosen according to the type of staining. A contiguous cluster of labeled pixels was considered to be a cell when the diameter was roughly equal to or larger than 10 μm.
Colocalization of two labels was determined by approximate coincidence of red and green labeling. This condition was determined by dilating both the red and the green images using a 3×3 structuring element, and then locating pixels that were labeled in both images after dilation. Each contiguous cluster of colocalized pixels was counted as a single cell. The number of cells exhibiting 5-HT2CR-IR and colocalization of 5-HT2CR-IR with GAD 67-IR or IR of one of the calcium-binding proteins were counted using the 40x magnification photomicrographs. Brain sections stained with cresyl violet were used to identify layers of the PrL. The cell numbers for each rat brain were calculated from the average of the numbers from three sections (around +3.2 mm prior to bregma) for a given rat.
A one-way ANOVA was used to analyze the differences in the percentage of cells labeled for 5-HT2CR-IR which also contained parvalbumin-, calbindin- or calretinin-IR. A significant F value was followed by a comparison between specific groups using the Student Newman-Keuls procedure (SNK). All statistical analyses were conducted with the experimentwise error rate (α) at 0.05. Subsequent to analysis, minor adjustments to the brightness and contrast of some images were made during preparation for publication.
Results
5-HT2CR Antibody Validation
A previously published study has demonstrated that the anti-5-HT2CR antibody employed here (sc-15081) binds specifically to the 5-HT2CR and does not cross react with the 5-HT2AR in immunohistochemical analyses (Bubar et al., 2005; Bubar and Cunningham, 2007). In brief, robust and reproducible immunostaining was observed in mouse and rat brain consistent with findings with a home-generated 5-HT2CR antibody (Clemett et al., 2000). The 5-HT2CR-IR was also eliminated in transgenic mice lacking the 5-HT2CR gene relative to wild type mice and did not stain native CHO cells (which do not express the 5-HT2CR protein) or CHO cells that expressed the closely-related 5-HT2AR (Bubar et al., 2005). Primary antibody only and secondary antibody only controls contained a complete absence of specific labeling of cells by either antibody alone in the current (data not shown) and previously published studies (Bubar et al., 2005; Bubar and Cunningham, 2007), suggesting that the observed IR was specific to the combination of 5-HT2CR specific primary and secondary antibodies. These studies suggest that expression of the 5-HT2CR protein can be readily detected using this antibody.
In the present study, we conducted additional validation of the anti-5-HT2CR antibody through Western blot analyses of PFC tissue. Since the 5-HT2CR is thought to be localized post-synaptically (Clemett et al., 2000; Lopez-Gimenez et al., 2001), we utilized a subcellular fractionation protocol (Phillips et al., 2001; Moron et al., 2007) to isolate the PSD fraction of the PFC, an electron dense structure where proteins that are involved in receiving and transducing synaptic signals are highly concentrated (e.g., membrane-bound receptors). Isolation of the PSD was confirmed via Western blot analysis showing that post-synaptic density-95 (PSD-95), a PSD marker (Banker et al., 1974; Hunt et al., 1996), was highly abundant in the PSD fraction (Figure 1). In contrast, syntaxin, a pre-synaptic marker (Bennett et al., 1992), while present in the total homogenate, was absent in the PSD fraction (Figure 1). In agreement with evidence of post-synaptic localization of the 5-HT2CR (Clemett et al., 2000; Lopez-Gimenez et al., 2001), we observed an enrichment of the 5-HT2CR in the PSD fraction (Figure 1). Specificity of the 5-HT2CR signal was confirmed via peptide neutralization of the anti-5-HT2CR. Pre-incubation of the anti-5-HT2CR antibody with a 4-fold excess of the peptide used to stimulate antibody production eliminated the 55 KDa band in the PSD fraction. (Figure 1). These results confirm that the anti-5-HT2CR antibody detects a protein localized to the post-synaptic density of the PFC with the size and immunoreactive characteristics expected for a selective 5-HT2CR antibody. Thus, these data support the use of this antibody as a tool to examine the localization of the 5-HT2CR in the PFC.
5-HT2CR-IR distribution and staining pattern in the mPFC
Immunoreactivity for the 5-HT2CR was observed in all subregions of the rat mPFC including the anterior cingulate cortex (ACC), the prelimbic PFC (PrL), and the infralimbic PFC (IL), and displayed similar laminar distribution in each of the three subregions of the rat mPFC (data not shown). The expression of the 5-HT2CR-IR was further analyzed in superficial and deep layers of the PrL (see box in Figure 2). In the area of the PrL analyzed (see box in Figure 2), 85% percent of all 5-HT2CR-IR cells detected were located in the deep layers (layers V–VI) while only 15% were found in the superficial layers (layers I–III; Figure 3). The expression of the 5-HT2CR was typically most intense along the periphery of cell bodies and processes proximal to the cell bodies (Figure 4A). The neurons expressing the 5-HT2CR-IR typically appeared round-or fusiform-shaped (Figures 4A, 5A).
Figure 2. Schematic drawing of representative section used for the quantification of IR cells in the PrL.
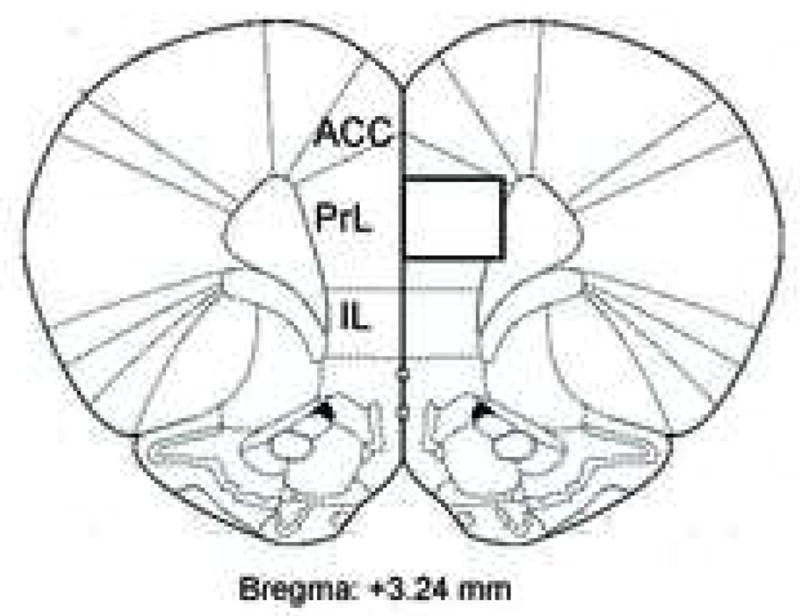
The drawing (bregma 3.24 mm) was adapted from Paxinos and Watson (2004). The box shows the area in which photomicrographs at a magnification of 40x were taken to quantify the numbers of 5-HT2CR-IR cells in superficial (layers I and II/III) and deep layers (layers V and VI) of the PrL and their colocalization with GAD 67-, parvalbumin-, calbindin- or calretinin-IR. ACC: anterior cingulate cortex; PrL: prelimbic cortex; IL: infralimbic cortex.
Figure 3. Stratification and segregation of immunoreactive profiles for the 5-HT2CR-IR in the PrL.
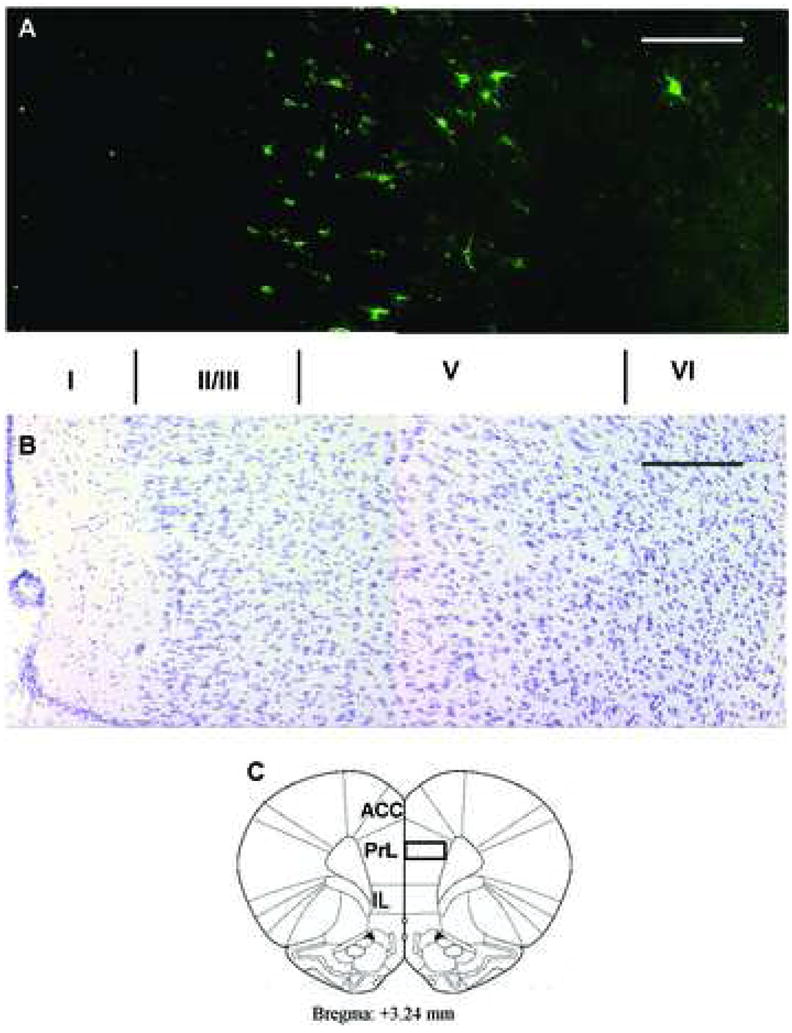
Expression of 5-HT2CR-IR (green, A) was segregated into specific cortical layers shown by comparison with neighboring sections (B) stained with cresyl violet, to aid in identifying the cortical layers (I–VI). Note that most 5-HT2CR-IR cells are located in layer V–VI. A few cells are also stained in layers I and II/III. (C) is a schematic drawing adapted from Paxinos and Watson (2004) corresponding to coronal sections (Bregma 3.24) from which images in A and B were captured. Scale bar: 200 μm. ACC: anterior cingulate cortex; PrL: prelimbic cortex; IL: infralimbic cortex.
Figure 4. Photomicrographs of immunostained neurons in the deep layers of the PrL illustrate the subcellular distribution patterns of IR associated with each of the immunoreagents used in this study.
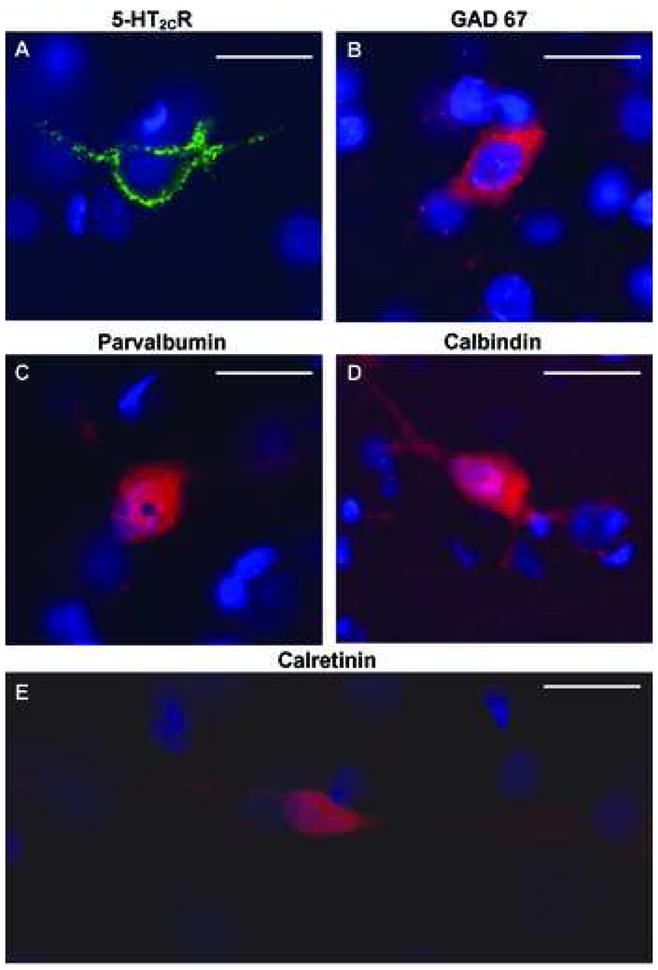
The 5-HT2CR-IR (green, A) was typically most intense at the periphery of the cell bodies, with some extension into the proximal dendrites; DAPI stained nuclei are also shown (blue). The antisera against GAD 67 (red, B) produced a relatively homogeneous staining of the cell soma and occasionally weakly labeled the proximal dendrites. The antisera against parvalbumin (red, C), calbindin (red, D) and calretinin (red, E) produced a diffuse staining that labeled the soma and proximal and distal neurites. Scale bar, 20 μm.
Figure 5. Colocalization of GAD 67 and 5-HT2CR in layer IV of the PrL.
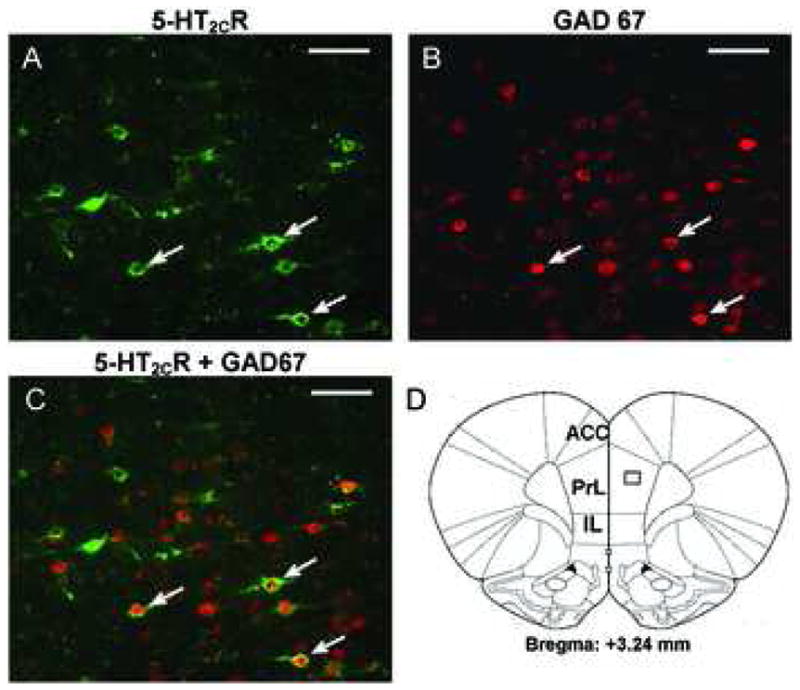
Photomicrographs of double-label immunofluorescent staining for the 5-HT2CR (green, A), and GAD 67 (red, B). Figure C displays the overlay of images in A and B to demonstrate colocalization. Approximately 50% of 5-HT2CR-positive cells in the field also contain GAD 67-IR. Examples of cells that express immunoreactivity for GAD 67 and 5-HT2CR are shown by arrows. D. Schematic drawing adapted from Paxinos and Watson (2004) corresponding to coronal sections (bregma 3.24 mm) from which images in A–C were captured. Scale bar: 50 μm. ACC: anterior cingulate cortex; PrL: prelimbic cortex; IL: infralimbic cortex.
5-HT2CR/GAD 67 immunofluorescence
The anti-GAD 67 antibody employed here (sc-5602) has been utilized in several prior studies for immunohistochemical (Majak and Pitkanen, 2003; Akema et al., 2005; Falk et al., 2006) and Western blot analyses (Akema et al., 2005; Sanchez et al., 2006). One study (Akema et al., 2005) revealed that this anti-GAD 67 antibody can detect similar numbers of cells in the medial proptic area as detected using an anti-GABA antibody. Furthermore, they demonstrate that this antibody can detect a lipopolysaccharide (LPS)-induced increase in the number of GAD 67-expressing cells using either Western blot or immunohistochemical analysis, which also paralleled the increase in GABA-positive cells induced by LPS. These results suggest that this GAD 67 antibody can be utilized to detect GABA-synthesizing cells in the brain. In addition, validation studies conducted by Santa Cruz Biotechnology revealed that the sc-5602 antibody detects the decrease in GAD 67 protein expression induced by GAD-67 siRNA transfection in HeLa cells (C. Maraviglia, Santa Cruz Biotechnology, personal communication). In the current study, primary antibody only and secondary only controls contained a complete absence of specific labeling of cells by the GAD 67 antibody alone, suggesting that the observed IR was specific to the combination of GAD 67-specific primary and secondary antibodies (data not shown).
Sections containing the mPFC were simultaneously processed with the 5-HT2CR and GAD 67 antibodies using the double-label immunofluorescence protocol. GAD 67-positive neurons were observed in cortical layers II-VI (data not shown). In general, GAD 67-IR was distributed evenly throughout the soma, with occasional extension into the proximal processes (Figure 4B, 5B). GAD 67-IR was detected in a subset of 5-HT2CR-IR cells in the mPFC; an example of a section of the PrL stained simultaneously for GAD 67- and 5-HT2CR IR is shown in Figure 5. In the area of the PrL in which expression of the 5-HT2CR-IR was quantified (see box in Figure 2), 50.4 ± 4.77% of the total detected cells that were stained for the 5-HT2CR-IR also expressed GAD 67-IR. The percentage of neurons that expressed both 5-HT2CR-IR and GAD 67-IR relative to all detected neurons expressing 5-HT2CR-IR in layers V–VI (54.38% ± 6.28%) was significantly higher than that seen in layers I-III (19.88% ± 4.38%) (p < 0.05; data not shown).
Colocalization of 5-HT2CR and calcium-binding proteins
Double-label immunofluorescence experiments using antibodies raised against the 5-HT2CR and the calcium-binding proteins (parvalbumin, calbindin, and calretinin(; Gritti et al., 2003; Liu et al., 2005) allowed us to determine whether the 5-HT2CR was preferentially expressed in particular subtypes of GABAergic interneurons. The antibodies to the calcium-binding proteins diffusely stained soma and frequently stained processes of neurons (Figures 4C–E, 6B, 6E, 6H). In both layers I–III and layers V–VI of the PrL, the number of calbindin-IR and calretinin-IR cells was significantly lower than that of parvalbumin-IR cells (Figure 7).
Figure 6. Colocalization of calcium-binding proteins and 5-HT2CR in layer IV of the PrL.
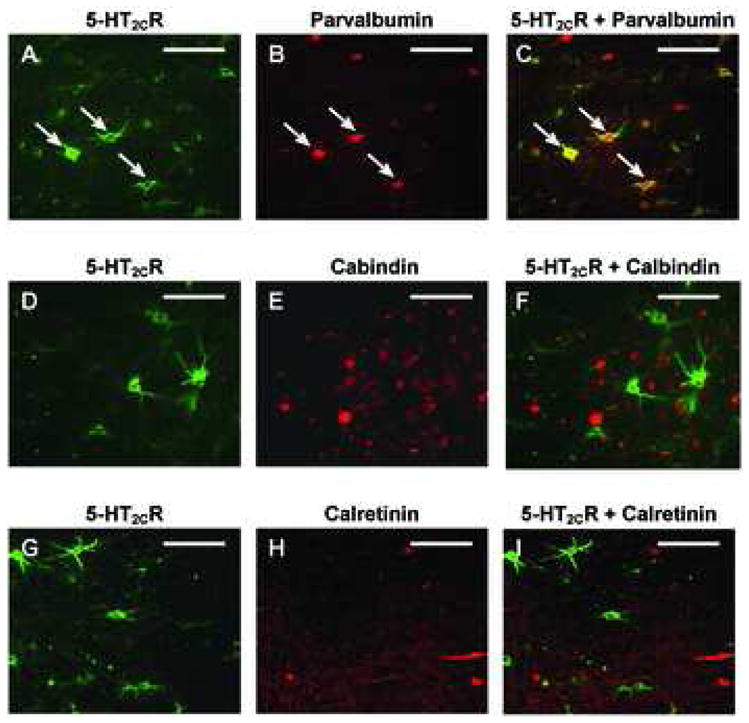
In all cases, the 5-HT2CR-IR is demonstrated by Alexa Fluor® 488 (green, A, D, G), and parvalbumin-, calbindin-, and calretinin are demonstrated by Alexa Fluor® 555 staining (red, B, E, H, respectively). Figures C, F and I display the overlay of images in A+B, D+E and G+H, respectively. Of the three classes of interneurons, double-labeled parvalbumin cells tended to express the greatest degree of 5-HT2CR-IR. Arrows show the cells with both parvalbumin-IR and 5-HT2CR-IR. All images were taken from the same area as depicted in Figure 5D. Scale bar: 100 μm.
Figure 7. Number of parvalbumin-, calbindin-, and calretinin-positive cells in the rat PrL.
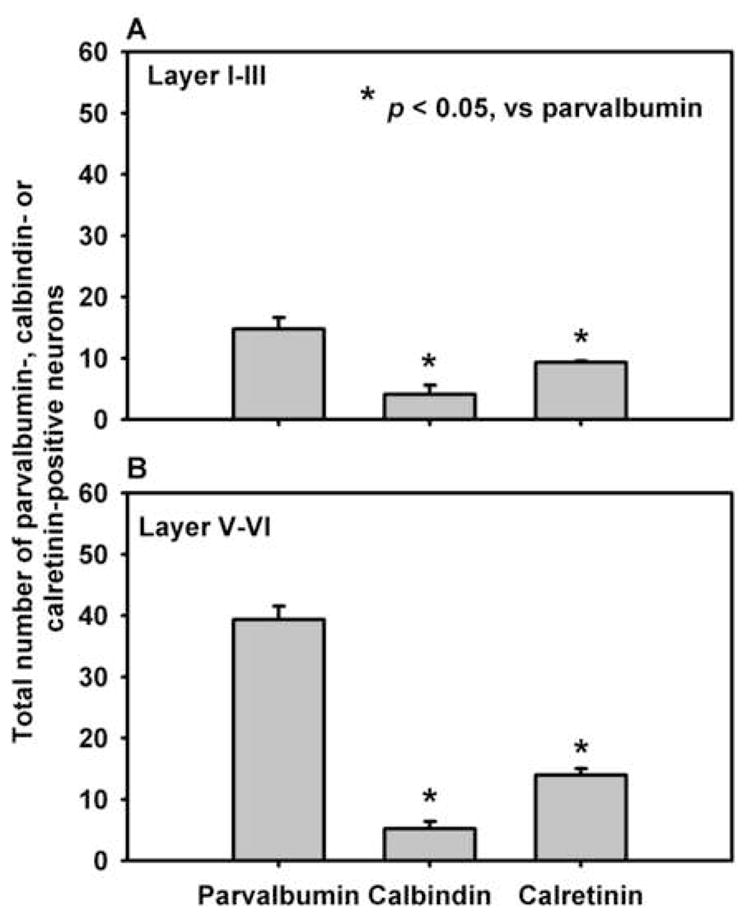
The average number of parvalbumin-, calbindin-, and calretinin-IR cells detected (± S.E.M.) in the PrL are presented (n = 3 rats). The number of calretinin- or calbindin-positive cells detected is significantly lower (p < 0.05) than the number of parvalbumin-positive cells detected in both the superficial layers (layers I–III; A) and the deep layers (layers V/VI; B) of the PrL.
Examples of sections of the PrL stained for parvalbumin-IR, calbindin-IR, or calretinin-IR in combination with the 5-HT2CR-IR are shown in Figure 6C, 6F and 6I, respectively. The frequency of 5-HT2CR-IR colocalization with the IR for each calcium-binding protein differed significantly in the deep layers (F3,8 = 13.69, p < 0.0058), but not the superficial layers (F3,8 = 0.12, p < 0.8905) of the PrL. In deep layers (V–VI), 25.4% of parvalbumin-IR neurons detected also displayed 5-HT2CR-IR, while only 8.1% of calbindin- and 2.5% of calretinin-IR neurons contained 5-HT2CR-IR (Figure 8). Thus, a significantly higher percentage of neurons with parvalbumin-IR showed colocalization with 5-HT2CR-IR in comparison to calbindin-IR or calretinin-IR (p<0.05, Figure 8).
Figure 8. Number of parvalbumin-, calbindin-, and calretinin-positive cells in the rat PrL that co-express 5-HT2CR-IR.
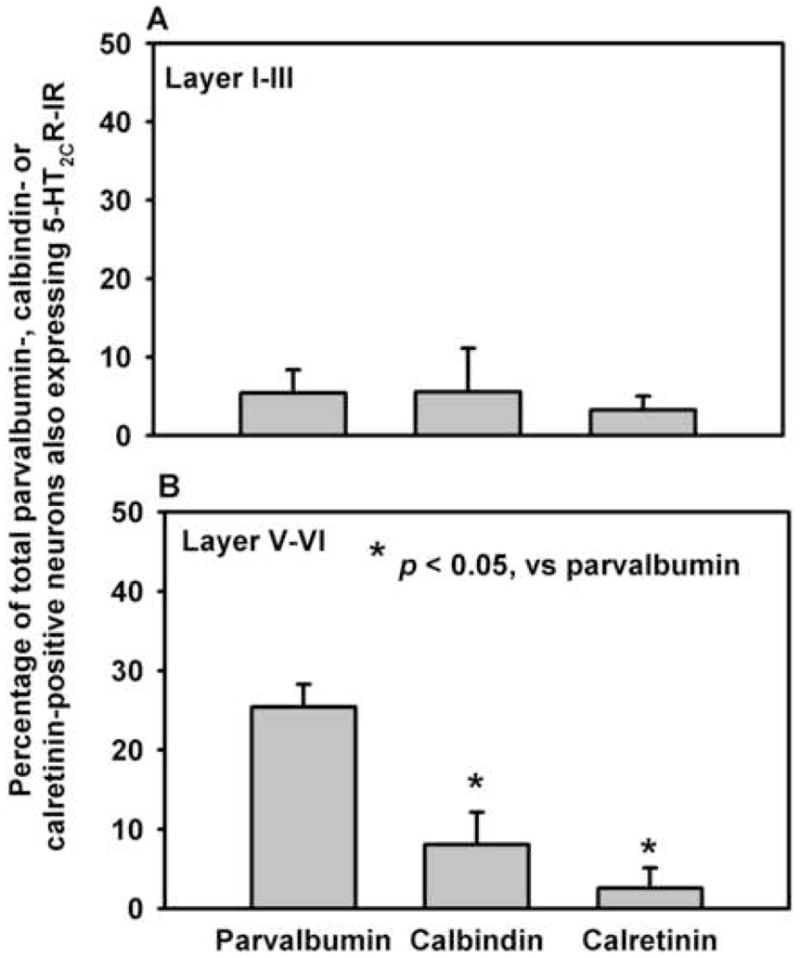
Interneuron populations were defined by IR staining for parvalbumin, calbindin, or calretinin. The average of the percentage of total cells detected for each interneuron subpopulation that also contained 5-HT2CR-IR (± S.E.M.) is presented (n = 3 rats). The percentage of calretinin or calbindin-positive cells which express 5-HT2CR-IR is significantly lower (p < 0.05) than the number of parvalbumin-positive cells in the deep layers (layers V/VI; B) but not the superficial layers (layers I–III; A) of the PrL.
Discussion
The present study reveals that the 5-HT2CR is primarily expressed in the deep layers of the rat mPFC. About 50% of neurons expressing 5-HT2CR-IR in the PrL region of the mPFC expressed GAD 67-IR. The 5-HT2CR-IR was also found to be differentially distributed in subtypes of GABA interneurons, as defined by the presence of specific calcium-binding proteins. Compared to calbindin- and calretinin-IR interneurons, a much higher percentage of parvalbumin-IR neurons were found to be co-labeled for 5-HT2CR-IR, suggesting that the 5-HT2CR may exhibit its greatest influence upon this subtype of GABA interneuron in the mPFC.
The 5-HT2CR antibody employed here preferentially labeled cells in the deep layers (layers V/VI) compared to superficial layers (layers I/II/III) of the rat mPFC. These data are in keeping with previous in situ hybridization studies which demonstrated a distribution of the 5-HT2CR mRNA restricted to layer V of PFC in rats (Pompeiano et al., 1994), monkeys (Lopez-Gimenez et al., 2001) and humans (Pasqualetti et al., 1999). The 5-HT2CR-IR was most intense in the periphery of cell bodies and processes proximal to cell bodies in primarily round- or fusiform-shaped cells in the rat mPFC. The present study also demonstrated that 50% of the 5-HT2CR-IR in the mPFC is colocalized with GAD 67-IR, a marker of GABA interneurons.
The expression of 5-HT2CR-IR in mPFC GABA interneurons coincides with previous data demonstrating that 5-HT2CR mRNA is present in a subpopulation of PFC GABA interneurons (Vysokanov et al., 1998) and that serotonergic axons in the monkey PFC predominantly synapse on interneurons (Smiley and Goldman-Rakic, 1996). Studies have also shown that the local administration of the 5-HT2A/2CR agonist 1-(2,5-dimethoxy-4-iodophenyl)-2-aminopropane (DOI) within the mPFC increased extracellular GABA levels in this area (Abi-Saab et al., 1999), while systemic DOI induced c-Fos expression in GAD 67-positive mPFC interneurons (Abi-Saab et al., 1999). These c-Fos proteins were not expressed in 5-HT2AR positive cortical neurons (Mackowiak et al., 1999), suggesting that the activation of PFC GABA interneurons by DOI is mediated by the 5-HT2CR, not the 5-HT2AR. Thus, there are a variety of data within the literature supporting the presence of 5-HT2CR within PFC GABA interneurons. In the present study, however, only about half of the neurons displaying 5-HT2CR-IR also possessed GAD 67-IR, suggesting either that the detection of GAD 67-IR was limited by the sensitivity of the assay conditions, or that the remaining 5-HT2CR-IR identified in the mPFC is localized to other cell types. Although several studies have indicated the absence of labeling for 5-HT2CR mRNA in pyramidal-shaped cells in both human and monkey PFC (Pasqualetti et al., 1999; Lopez-Gimenez et al., 2001) and few pyramidal-shaped 5-HT2CR-IR cells were observed in the present study, other studies using single cell RT-PCR have demonstrated that ~25 – 50% of pyramidal neurons in the PFC contain mRNA for the 5-HT2CR (Vysokanov et al., 1998; Carr et al., 2002). Thus, it is probable that the remaining mPFC 5-HT2CR-IR cells are pyramidal glutamate neurons (Figure 9), although additional co-labeling studies for 5-HT2CR and a glutamate neuron-specific marker are necessary to confirm this hypothesis.
Figure 9. Schematic representation of the sites of action for the PrL 5-HT2CR to modulate PFC output to the VTA and NAc.
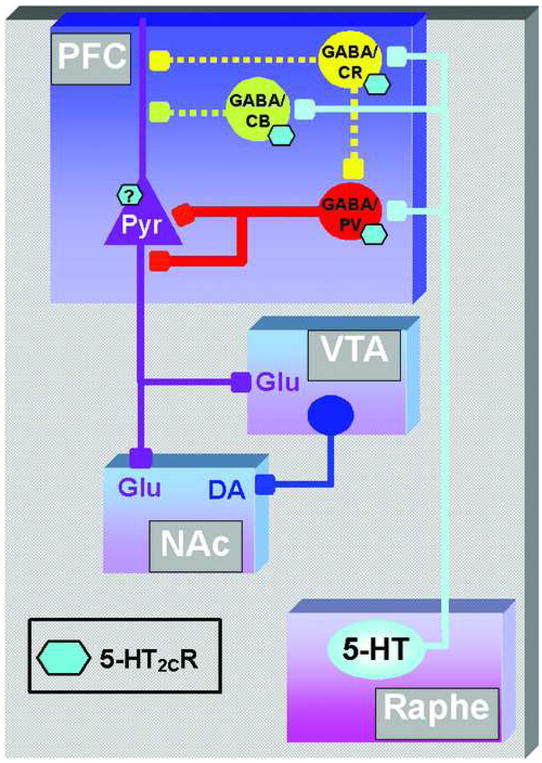
The projection from 5-HT neurons in the raphe nuclei (Raphe) to the prefrontal cortex (PFC) is represented by the solid light blue line. The 5-HT2CR located in the PFC are represented by light blue hexagons. The GABA interneurons that express parvalbumin (GABA/PV; red), calbindin (GABA/CB; green) or calretinin (GABA/CR; yellow) are also illustrated. Pyramidal glutamate (Pyr) projections from the PFC to the VTA and NAc are represented by solid purple lines. Dopamine projections from the ventral tegmental area (VTA) to the nucleus accumbens (NAc) is represented by a solid dark blue line. The 5-HT2CR is expressed in a greater proportion of parvalbumin-containing GABA interneurons and therefore the 5-HT2CR has its greatest influence (denoted by thick red lines) upon this subtype of GABA neuron compared to GABA neurons that possess calbindin or calretinin, where the 5-HT2CR A exerts minor influence upon activity of these subtypes of GABA neurons (denoted by dotted green and yellow lines, respectively). Stimulation of mPFC 5-HT2CR on parvalbumin-positive GABA interneurons would function to reduce excitatory glutamate output as well as subsequent DA neurotransmission within the mesoaccumbens pathway (VTA and NAc). Although not assessed in this study, the 5-HT2CR may also be expressed in pyramidal neurons (blue hexagon with question mark).
The subclasses of GABA interneurons, identified by the expression of the calcium-binding proteins parvalbumin, calbindin, and calretinin, have distinct morphological, neurochemical and electrophysiological characteristics (Andressen et al., 1993; Conde et al., 1994; Gabbott et al., 1997; Gonzalez-Burgos et al., 2005). The results of the present study revealed that the subtypes of PFC GABA neurons did not express 5-HT2CR-IR equivalently. Only a small proportion of calbindin-positive interneurons (8.1%) or calretinin-positive neurons (2.5%) were found to contain 5-HT2CR-IR. These findings suggest limited 5-HT2CR control of calbindin-labeled (double-bouquet, neurogliaform, and Martinotti) neurons that innervate the distal dendrites of pyramidal cells (Conde et al., 1994; Gabbott et al., 1997), or calretinin-positive interneurons (double-bouquet and Cajal-Retzius cells) whose terminals selectively innervate other GABA interneurons or the distal dendrites of pyramidal cells (Conde et al., 1994; Gabbott et al., 1997).
The 5-HT2CR-IR in the PrL was localized primarily to parvalbumin-positive interneurons, which include basket and chandelier neurons that innervate the cell body and the initial axon segment, respectively, of pyramidal neurons (Conde et al., 1994; Gabbott et al., 1997). Thus, the inhibitory synapses formed by parvalbumin-expressing basket and chandelier neurons are proximal to the initial axon segment of pyramidal cells, the site at which action potentials are generated. As such, a primary function of parvalbumin-positive GABA neurons is to modulate the efferent signaling of pyramidal neurons (Miles et al., 1996; Markram et al., 2004; Lewis et al., 2005). Since the 5-HT2CR-IR was predominantly colocalized with parvalbumin-IR, the 5-HT2CR-mediated influence on GABA interneurons would be expected to primarily target the basket and chandelier cells which provide the strongest inhibitory effects on the output of cortical pyramidal cells, compared to interneurons that innervate distal dendrites of the pyramidal cells, which likely function to regulate incoming afferent signals to the pyramidal neurons (Miles et al., 1996).
Activation of the 5-HT2CR depolarizes neuronal membranes and increases the firing rate of neurons (Stanford et al., 2005). Thus, endogenous or exogenous stimulation of the 5-HT2CR localized to parvalbumin-positive interneurons in the mPFC would likely induce GABA release, which would in turn act to inhibit output of the pyramidal cells (Figure 9; Gabbott et al., 1997; Gonzalez-Burgos et al., 2005). The localization of 5-HT2CR- to the deep layers of the rat mPFC (layers V–VI), suggests that the 5-HT2CR acts to modulate the output of neurons in these layers. The pyramidal efferent neurons in layers V–VI primarily project to subcortical regions, including the VTA and nucleus accumbens (NAc), the origin and terminal regions of the DA mesoaccumbens pathway (Gabbott et al., 2005). Here, pyramidal neurons function to regulate neurotransmission within the pathway. Thus, release of GABA via activation of the 5-HT2CR on parvalbumin-positive mPFC GABA interneurons would be expected to reduce excitatory output from the mPFC to the mesoaccumbens pathway, enabling mPFC 5-HT2CR to indirectly regulate glutamate and DA levels in the NAc (Figure 9). In support of this concept, iontophoretic application of the 5-HT2CR agonist mCPP suppressed spontaneous and/or glutamate-activated firing of PFC neurons (Bergqvist et al., 1999), while electrical stimulation of the rat mPFC enhanced glutamate levels in the VTA (Rossetti et al., 1998) and NAc (You et al., 1998) as well as DA release in the NAc (You et al., 1998); but see (Jackson et al., 2001). Taken in conjunction with the observation that activation of mPFC GABA receptors inhibited both glutamate release in the VTA and NAc and DA release in the NAc (Karreman and Moghaddam, 1996; Harte and O’Connor, 2005), these data suggest that stimulation of mPFC 5-HT2CR on parvalbumin-positive GABA interneurons would function to reduce excitatory glutamate output as well as subsequent DA neurotransmission within the mesoaccumbens pathway (Figure 9).
The mesoaccumbens pathway is thought to be integral in psychological processes including motivation, reward and mood (Salamone, 1996; Pierce and Kumaresan, 2006; Nestler and Carlezon, Jr., 2006), and is an important site for the actions of psychostimulants such as cocaine (Filip and Cunningham, 2003; Pierce and Kumaresan, 2006). Thus, alterations in accumbal DA and/or glutamate levels consequent to stimulation of mPFC 5-HT2CR may be one mechanism by which the 5-HT2CR modulates the neurochemical and behavioral effects of psychostimulants. Intra-mPFC infusion of 5-HT2CR agonists have been shown to block the hypermotive and discriminative stimulus effects of cocaine (Filip and Cunningham, 2003), and block the expression of sensitization (the progressive enhancement of the hypermotive effects of a drug following repeated drug exposure) to 3,4-methylenedioxymethamphetamine (MDMA; Ramos et al., 2005). Intra-mPFC infusion of a 5-HT2CR antagonist, on the other hand, enhanced cocaine-induced hyperactivity and increased recognition of the stimulus effects of cocaine (Filip and Cunningham, 2003) in the absence of overt effects of intra-mPFC 5-HT2CR ligands alone. Thus, these results are in keeping with the model that activation of the 5-HT2CR on mPFC GABA interneurons inhibits output of the mPFC to ultimately reduce the behavioral effects of psychostimulants (Figure 9). However, should the 5-HT2CR also be localized directly on pyramidal output neurons (Figure 9), stimulation of these 5-HT2CR would be expected to enhance pyramidal neuron activity, thereby opposing the effect of 5-HT2CR on GABA interneurons.
In summary, our results demonstrate a higher percentage of parvalbumin-positive neurons with 5-HT2CR-IR than the calbindin- and calretinin-positive neurons, suggesting that the activation of 5-HT2CR in the mPFC may reduce the output of the pyramidal neurons by increasing the excitability of the inhibitory parvalbumin-positive GABA neurons. This new knowledge of the distribution of 5-HT2CR among the subclasses of mPFC interneurons provides insight into the mechanisms by which the mPFC 5-HT2CR modulates cortical output.
Acknowledgments
This research was supported by the National Institute on Drug Abuse grants DA 00260 and DA 006511, DA 007287, DA 013595, DA 015259, DA 020087. We would like to thank Dr. Jose A. Moron-Concepcion for his assistance with synaptosomal fractionation methodology, Robert G. Fox for his technical assistance and Drs. David V. Herin, Bríd M. Nic Dhonnchadha and Patsy K. Seitz for their valuable comments and suggestions upon reviewing the manuscript. Portions of this work were presented by Shijing Liu at the 34th Annual Meeting of Society for Neuroscience in San Diego, October, 2004, and in partial fulfillment of the requirements for the Ph.D. degree to the Graduate School of Biomedical Sciences at the University of Texas Medical Branch.
Abbreviations
- 5-HT
5-hydroxytryptamine, serotonin
- 5-HT2CR
serotonin 2C receptor
- ACC
anterior cingulate cortex
- DA
dopamine
- DOI
1-(2,5-dimethoxy-4-iodophenyl)-2-aminopropane
- GABA
γ-aminobutyric acid
- GAD 67
glutamate decarboxylase, isoform 67
- IL
infralimbic prefrontal cortex
- IR
immunoreactivity
- MDMA
3,4-methylenedioxy-methamphetamine
- mPFC
medial prefrontal cortex
- NAc
nucleus accumbens
- PFC
prefrontal cortex
- PrL
prelimbic prefrontal cortex
- PSD
post-synaptic density
- PSD-95
post-synaptic density-95
- VTA
ventral tegmental area
Footnotes
Publisher's Disclaimer: This is a PDF file of an unedited manuscript that has been accepted for publication. As a service to our customers we are providing this early version of the manuscript. The manuscript will undergo copyediting, typesetting, and review of the resulting proof before it is published in its final citable form. Please note that during the production process errors may be discovered which could affect the content, and all legal disclaimers that apply to the journal pertain.
References
- Abi-Saab WM, Bubser M, Roth RH, Deutch AY. 5-HT2 receptor regulation of extracellular GABA levels in the prefrontal cortex. Neuropsychopharmacology. 1999;20:92–96. doi: 10.1016/S0893-133X(98)00046-3. [DOI] [PubMed] [Google Scholar]
- Akema T, He D, Sugiyama H. Lipopolysaccharide increases gamma-aminobutyric acid synthesis in medial preoptic neurones in association with inhibition of steroid-induced luteinising hormone surge in female rats. J Neuroendocrinol. 2005;17:672–678. doi: 10.1111/j.1365-2826.2005.01358.x. [DOI] [PubMed] [Google Scholar]
- Andressen C, Blumcke I, Celio MR. Calcium-binding proteins: selective markers of nerve cells. Cell Tissue Res. 1993;271:181–208. doi: 10.1007/BF00318606. [DOI] [PubMed] [Google Scholar]
- Banker G, Churchill L, Cotman CW. Proteins of the postsynaptic density. J Cell Biol. 1974;63:456–465. doi: 10.1083/jcb.63.2.456. [DOI] [PMC free article] [PubMed] [Google Scholar]
- Bennett MK, Calakos N, Scheller RH. Syntaxin: a synaptic protein implicated in docking of synaptic vesicles at presynaptic active zones. Science. 1992;257:255–259. doi: 10.1126/science.1321498. [DOI] [PubMed] [Google Scholar]
- Bergqvist PB, Dong J, Blier P. Effect of atypical antipsychotic drugs on 5-HT2 receptors in the rat orbito-frontal cortex: an in vivo electrophysiological study. Psychopharmacology (Berl) 1999;143:89–96. doi: 10.1007/s002130050923. [DOI] [PubMed] [Google Scholar]
- Bubar MJ, Cunningham KA. Distribution of Serotonin 5-HT2C Receptors in the Ventral Tegmental Area. Neuroscience. 2007 doi: 10.1016/j.neuroscience.2006.12.07. In Press. [DOI] [PMC free article] [PubMed] [Google Scholar]
- Bubar MJ, Seitz PK, Thomas ML, Cunningham KA. Validation of a selective serotonin 5-HT(2C) receptor antibody for utilization in fluorescence immunohistochemistry studies. Brain Res. 2005;1063:105–113. doi: 10.1016/j.brainres.2005.09.050. [DOI] [PubMed] [Google Scholar]
- Carr DB, Cooper DC, Ulrich SL, Spruston N, Surmeier DJ. Serotonin receptor activation inhibits sodium current and dendritic excitability in prefrontal cortex via a protein kinase C-dependent mechanism. J Neurosci. 2002;22:6846–6855. doi: 10.1523/JNEUROSCI.22-16-06846.2002. [DOI] [PMC free article] [PubMed] [Google Scholar]
- Clemett DA, Punhani T, Duxon MS, Blackburn TP, Fone KC. Immunohistochemical localisation of the 5-HT2C receptor protein in the rat CNS. Neuropharmacology. 2000;39:123–132. doi: 10.1016/s0028-3908(99)00086-6. [DOI] [PubMed] [Google Scholar]
- Conde F, Lund JS, Jacobowitz DM, Baimbridge KG, Lewis DA. Local circuit neurons immunoreactive for calretinin, calbindin D-28k or parvalbumin in monkey prefrontal cortex: distribution and morphology. J Comp Neurol. 1994;341:95–116. doi: 10.1002/cne.903410109. [DOI] [PubMed] [Google Scholar]
- Dalley JW, Cardinal RN, Robbins TW. Prefrontal executive and cognitive functions in rodents: neural and neurochemical substrates. Neurosci Biobehav Rev. 2004;28:771–784. doi: 10.1016/j.neubiorev.2004.09.006. [DOI] [PubMed] [Google Scholar]
- Eyles DW, McGrath JJ, Reynolds GP. Neuronal calcium-binding proteins and schizophrenia. Schizophr Res. 2002;57:27–34. doi: 10.1016/s0920-9964(01)00299-7. [DOI] [PubMed] [Google Scholar]
- Falk T, Zhang S, Erbe EL, Sherman SJ. Neurochemical and electrophysiological characteristics of rat striatal neurons in primary culture. J Comp Neurol. 2006;494:275–289. doi: 10.1002/cne.20819. [DOI] [PMC free article] [PubMed] [Google Scholar]
- Filip M, Cunningham KA. Hyperlocomotive and discriminative stimulus effects of cocaine are under the control of serotonin(2C) (5-HT(2C)) receptors in rat prefrontal cortex. J Pharmacol Exp Ther. 2003;306:734–743. doi: 10.1124/jpet.102.045716. [DOI] [PubMed] [Google Scholar]
- Fuster JM. The prefrontal cortex: anatomy, physiology, and neuropsychology of the frontal lobe. Lippnicott-Raven; Philadelphia: 1997. [Google Scholar]
- Gabbott PL, Dickie BG, Vaid RR, Headlam AJ, Bacon SJ. Local-circuit neurones in the medial prefrontal cortex (areas 25, 32 and 24b) in the rat: morphology and quantitative distribution. J Comp Neurol. 1997;377:465–499. doi: 10.1002/(sici)1096-9861(19970127)377:4<465::aid-cne1>3.0.co;2-0. [DOI] [PubMed] [Google Scholar]
- Gabbott PL, Warner TA, Jays PR, Salway P, Busby SJ. Prefrontal cortex in the rat: projections to subcortical autonomic, motor, and limbic centers. J Comp Neurol. 2005;492:145–177. doi: 10.1002/cne.20738. [DOI] [PubMed] [Google Scholar]
- Gonzalez-Burgos G, Krimer LS, Povysheva NV, Barrionuevo G, Lewis DA. Functional properties of fast spiking interneurons and their synaptic connections with pyramidal cells in primate dorsolateral prefrontal cortex. J Neurophysiol. 2005;93:942–953. doi: 10.1152/jn.00787.2004. [DOI] [PubMed] [Google Scholar]
- Gritti I, Manns ID, Mainville L, Jones BE. Parvalbumin, calbindin, or calretinin in cortically projecting and GABAergic, cholinergic, or glutamatergic basal forebrain neurons of the rat. J Comp Neurol. 2003;458:11–31. doi: 10.1002/cne.10505. [DOI] [PubMed] [Google Scholar]
- Harte M, O’Connor WT. Evidence for a selective prefrontal cortical GABA(B) receptor-mediated inhibition of glutamate release in the ventral tegmental area: a dual probe microdialysis study in the awake rat. Neuroscience. 2005;130:215–222. doi: 10.1016/j.neuroscience.2004.08.045. [DOI] [PubMed] [Google Scholar]
- Hillman GR, Johnston DA. Histochemical labeling of drug receptors in schistosomes: quantitation using computer image analysis techniques. J Pharmacol Methods. 1983;9:269–277. doi: 10.1016/0160-5402(83)90066-9. [DOI] [PubMed] [Google Scholar]
- Hunt CA, Schenker LJ, Kennedy MB. PSD-95 is associated with the postsynaptic density and not with the presynaptic membrane at forebrain synapses. J Neurosci. 1996;16:1380–1388. doi: 10.1523/JNEUROSCI.16-04-01380.1996. [DOI] [PMC free article] [PubMed] [Google Scholar]
- Hyman SE, Malenka RC, Nestler EJ. Neural mechanisms of addiction: the role of reward-related learning and memory. Annu Rev Neurosci. 2006;29:565–598. doi: 10.1146/annurev.neuro.29.051605.113009. [DOI] [PubMed] [Google Scholar]
- Jackson ME, Frost AS, Moghaddam B. Stimulation of prefrontal cortex at physiologically relevant frequencies inhibits dopamine release in the nucleus accumbens. J Neurochem. 2001;78:920–923. doi: 10.1046/j.1471-4159.2001.00499.x. [DOI] [PubMed] [Google Scholar]
- Kalivas PW, Volkow ND. The neural basis of addiction: a pathology of motivation and choice. Am J Psychiatry. 2005;162:1403–1413. doi: 10.1176/appi.ajp.162.8.1403. [DOI] [PubMed] [Google Scholar]
- Karreman M, Moghaddam B. The prefrontal cortex regulates the basal release of dopamine in the limbic striatum: an effect mediated by ventral tegmental area. J Neurochem. 1996;66:589–598. doi: 10.1046/j.1471-4159.1996.66020589.x. [DOI] [PubMed] [Google Scholar]
- Koob GF, Le MM. Plasticity of reward neurocircuitry and the ‘dark side’ of drug addiction. Nat Neurosci. 2005;8:1442–1444. doi: 10.1038/nn1105-1442. [DOI] [PubMed] [Google Scholar]
- Lewis DA, Hashimoto T, Volk DW. Cortical inhibitory neurons and schizophrenia. Nat Rev Neurosci. 2005;6:312–324. doi: 10.1038/nrn1648. [DOI] [PubMed] [Google Scholar]
- Liu JJ, Mohila CA, Gong Y, Govindarajan N, Onn SP. Chronic nicotine exposure during adolescence differentially influences calcium-binding proteins in rat anterior cingulate cortex. Eur J Neurosci. 2005;22:2462–2474. doi: 10.1111/j.1460-9568.2005.04423.x. [DOI] [PubMed] [Google Scholar]
- Lopez-Gimenez JF, Mengod G, Palacios JM, Vilaro MT. Regional distribution and cellular localization of 5-HT2C receptor mRNA in monkey brain: comparison with [3H]mesulergine binding sites and choline acetyltransferase mRNA. Synapse. 2001;42:12–26. doi: 10.1002/syn.1095. [DOI] [PubMed] [Google Scholar]
- Mackowiak M, Chocyk A, Fijal K, Czyrak A, Wedzony K. c-Fos proteins, induced by the serotonin receptor agonist DOI, are not expressed in 5-HT2A positive cortical neurons. Brain Res Mol Brain Res. 1999;71:358–363. doi: 10.1016/s0169-328x(99)00195-3. [DOI] [PubMed] [Google Scholar]
- Majak K, Pitkanen A. Activation of the amygdalo-entorhinal pathway in fear-conditioning in rat. Eur J Neurosci. 2003;18:1652–1659. doi: 10.1046/j.1460-9568.2003.02854.x. [DOI] [PubMed] [Google Scholar]
- Markram H, Toledo-Rodriguez M, Wang Y, Gupta A, Silberberg G, Wu C. Interneurons of the neocortical inhibitory system. Nat Rev Neurosci. 2004;5:793–807. doi: 10.1038/nrn1519. [DOI] [PubMed] [Google Scholar]
- Miles R, Toth K, Gulyas AI, Hajos N, Freund TF. Differences between somatic and dendritic inhibition in the hippocampus. Neuron. 1996;16:815–823. doi: 10.1016/s0896-6273(00)80101-4. [DOI] [PubMed] [Google Scholar]
- Moron JA, bul-Husn NS, Rozenfeld R, Dolios G, Wang R, Devi LA. Morphine Administration Alters the Profile of Hippocampal Postsynaptic Density-associated Proteins: A Proteomics Study Focusing on Endocytic Proteins. Mol Cell Proteomics. 2007;6:29–42. doi: 10.1074/mcp.M600184-MCP200. [DOI] [PubMed] [Google Scholar]
- Nestler EJ, Carlezon WA., Jr The mesolimbic dopamine reward circuit in depression. Biol Psychiatry. 2006;59:1151–1159. doi: 10.1016/j.biopsych.2005.09.018. [DOI] [PubMed] [Google Scholar]
- Pandey GN, Dwivedi Y, Ren X, Rizavi HS, Faludi G, Sarosi A, Palkovits M. Regional distribution and relative abundance of serotonin(2c) receptors in human brain: effect of suicide. Neurochem Res. 2006;31:167–176. doi: 10.1007/s11064-005-9006-6. [DOI] [PubMed] [Google Scholar]
- Pasqualetti M, Ori M, Castagna M, Marazziti D, Cassano GB, Nardi I. Distribution and cellular localization of the serotonin type 2C receptor messenger RNA in human brain. Neuroscience. 1999;92:601–611. doi: 10.1016/s0306-4522(99)00011-1. [DOI] [PubMed] [Google Scholar]
- Paxinos G, Watson C. The Rat Brain in Stereotaxic Coordinates. 5. Academic Press; New York: 2005. [Google Scholar]
- Phillips GR, Huang JK, Wang Y, Tanaka H, Shapiro L, Zhang W, Shan WS, Arndt K, Frank M, Gordon RE, Gawinowicz MA, Zhao Y, Colman DR. The presynaptic particle web: ultrastructure, composition, dissolution, and reconstitution. Neuron. 2001;32:63–77. doi: 10.1016/s0896-6273(01)00450-0. [DOI] [PubMed] [Google Scholar]
- Pierce RC, Kumaresan V. The mesolimbic dopamine system: the final common pathway for the reinforcing effect of drugs of abuse? Neurosci Biobehav Rev. 2006;30:215–238. doi: 10.1016/j.neubiorev.2005.04.016. [DOI] [PubMed] [Google Scholar]
- Pompeiano M, Palacios JM, Mengod G. Distribution of the serotonin 5-HT2 receptor family mRNAs: comparison between 5-HT2A and 5-HT2C receptors. Brain Res Mol Brain Res. 1994;23:163–178. doi: 10.1016/0169-328x(94)90223-2. [DOI] [PubMed] [Google Scholar]
- Ramos M, Goni-Allo B, Aguirre N. Administration of SCH 23390 into the medial prefrontal cortex blocks the expression of MDMA-induced behavioral sensitization in rats: an effect mediated by 5-HT2C receptor stimulation and not by D1 receptor blockade. Neuropsychopharmacology. 2005;30:2180–2191. doi: 10.1038/sj.npp.1300735. [DOI] [PubMed] [Google Scholar]
- Rossetti ZL, Marcangione C, Wise RA. Increase of extracellular glutamate and expression of Fos-like immunoreactivity in the ventral tegmental area in response to electrical stimulation of the prefrontal cortex. J Neurochem. 1998;70:1503–1512. doi: 10.1046/j.1471-4159.1998.70041503.x. [DOI] [PubMed] [Google Scholar]
- Salamone JD. The behavioral neurochemistry of motivation: methodological and conceptual issues in studies of the dynamic activity of nucleus accumbens dopamine. J Neurosci Methods. 1996;64:137–149. doi: 10.1016/0165-0270(95)00125-5. [DOI] [PubMed] [Google Scholar]
- Sanchez JF, Crooks DR, Lee CT, Schoen CJ, Amable R, Zeng X, Florival-Victor T, Morales N, Truckenmiller ME, Smith DR, Freed WJ. GABAergic lineage differentiation of AF5 neural progenitor cells in vitro. Cell Tissue Res. 2006;324:1–8. doi: 10.1007/s00441-005-0094-z. [DOI] [PMC free article] [PubMed] [Google Scholar]
- Sepulveda VA, Weigel NL, Falzon M. Prostate cancer cell type-specific involvement of the VDR and RXR in regulation of the human PTHrP gene via a negative VDRE. Steroids. 2006;71:102–115. doi: 10.1016/j.steroids.2005.08.009. [DOI] [PubMed] [Google Scholar]
- Smiley JF, Goldman-Rakic PS. Serotonergic axons in monkey prefrontal cerebral cortex synapse predominantly on interneurons as demonstrated by serial section electron microscopy. J Comp Neurol. 1996;367:431–443. doi: 10.1002/(SICI)1096-9861(19960408)367:3<431::AID-CNE8>3.0.CO;2-6. [DOI] [PubMed] [Google Scholar]
- Stanford IM, Kantaria MA, Chahal HS, Loucif KC, Wilson CL. 5-Hydroxytryptamine induced excitation and inhibition in the subthalamic nucleus: action at 5-HT(2C), 5-HT(4) and 5-HT(1A) receptors. Neuropharmacology. 2005;49:1228–1234. doi: 10.1016/j.neuropharm.2005.09.003. [DOI] [PubMed] [Google Scholar]
- Tzschentke TM. The medial prefrontal cortex as a part of the brain reward system. Amino Acids. 2000;19:211–219. doi: 10.1007/s007260070051. [DOI] [PubMed] [Google Scholar]
- Van Bockstaele EJ, Biswas A, Pickel VM. Topography of serotonin neurons in the dorsal raphe nucleus that send axon collaterals to the rat prefrontal cortex and nucleus accumbens. Brain Res. 1993;624:188–198. doi: 10.1016/0006-8993(93)90077-z. [DOI] [PubMed] [Google Scholar]
- Vysokanov A, Flores-Hernandez J, Surmeier DJ. mRNAs for clozapine-sensitive receptors co-localize in rat prefrontal cortex neurons. Neurosci Lett. 1998;258:179–182. doi: 10.1016/s0304-3940(98)00882-9. [DOI] [PubMed] [Google Scholar]
- You ZB, Tzschentke TM, Brodin E, Wise RA. Electrical stimulation of the prefrontal cortex increases cholecystokinin, glutamate, and dopamine release in the nucleus accumbens: an in vivo microdialysis study in freely moving rats. J Neurosci. 1998;18:6492–6500. doi: 10.1523/JNEUROSCI.18-16-06492.1998. [DOI] [PMC free article] [PubMed] [Google Scholar]