

Abstract
mTOR pathway inhibitors, specifically rapamycin and its derivatives, are promising therapeutics that targets downstream pathways including protein translation. We examined the effects of a series of inhibitors targeting various pathways on ribosomal polysome distribution, overall translation rates, and translation of specific mRNAs in the bone derived prostate cancer cell line, C4-2B. Treatment with either rapamycin, PD98059 or LY294002 failed to change the distribution of polysomes in sucrose gradients. Although no change in the accumulation of heavy polysomes was observed, there was an overall decrease in the rate of translation caused by treatment with rapamycin or LY294002. Inhibiting the MAPK pathway with PD98059 decreased overall translation by 20%, but had no effect on mRNAs containing a 5′ terminal oligopyrimidine tract (TOP) sequences or those with complex 5′ UTRs. In contrast, treatment with rapamycin for 24 h reduced overall translation by approximately 45% and affected the translation of mRNAs with complex 5′ UTRs, specifically VEGF and HIF1α. After 24 h, LY294002 treatment alone decreased overall translation by 60%, more than was observed with rapamycin. Although LY294002 and similar inhibitors are effective at blocking prostate cancer cell growth, they act upstream of AKT and PTEN and cancer cells can find a way to bypass this inhibition. Thus, we propose that inhibiting downstream targets such as mTOR or targets of mTOR will provide rational approaches to developing new combination therapies focused on reducing growth of prostate cancer after arrival in the bone environment.
Keywords: RAPAMYCIN, TRANSLATION, RIBOSOME, PROSTATE CANCER
Prostate cancer is one of the leading causes of cancer death among males. When prostate cancer is diagnosed early, treatment options include prostatectomy or brachytherapy along with androgen ablation therapy. Despite the reasonably good prognosis when detected early, there remain few biomarkers to identify the best therapies and drugs for patients in whom the cancer has progressed to a state of androgen insensitivity. At this point, often the cancer has metastasized, primarily to bone. Once prostate cancer metastasizes, the 5-year survival rate drops dramatically from nearly 100% to 32% (http://www.cancer.org/docroot/CRI/content/CRI_2_2_6x_Prostate_Cancer_Survival_Rates.asp?sitearea=).
Because many prostate cancer patients have mutations in PTEN or mutations that hyperactivate AKT, much interest has been directed towards the mTOR pathway, which functions downstream of AKT and PTEN. Many cancers including lymphoma, pancreatic, colon and breast cancer [reviewed in Petroulakis et al., 2006], as well as prostate cancer [Kremer et al., 2006] demonstrate increased mTOR signaling, which is inhibited by rapamycin. When normal cells become stressed, signaling through mTOR is reduced and protein translation occurs by a cap-independent mechanism rather than a cap-dependent mechanism. This switch permits the cell to translate only a few transcripts that are necessary for the cell to survive. By hyperactivating AKT and therefore mTOR signaling, prostate cancer cells that become resistant to therapy can avoid this switch and continue with cap-dependent translation, making the mTOR pathway an “escape route.”
A serine/threonine kinase, mTOR behaves as a nutrient sensor, linking the environment to translation. Once the mTOR-raptor complex is activated, it phosphorylates S6K1 and 4E-BP1.
S6K1 phosphorylates ribosomal protein S6 (RPS6), which can increase translation rates by stimulation of ribosome biogenesis facilitated by increased translation of mRNAs containing 5′ (TOP) sequences. These mRNAs contain a stretch of uninterrupted polypyrimidines (4–14 bases) following the 5′ cap region. Such sequences are found primarily in ribosomal protein transcripts and some elongation factor transcripts [Hamilton et al., 2006]. Hyperphosphorylation of 4E-BP1 releases the initiation factor eIF4E. Once released, eIF4E can become phosphorylated by MNK1/2 and join with other initiation factors to form the eIF4F initiation complex which scans the 5′ cap of the mRNA. An increase in mTOR signaling would create an excess of free eIF4E, which is the rate limiting factor for initiation, providing an “escape route” for cancer cells. Normally mRNAs compete for the available eIF4E but with an excess of unbound eIF4E, mRNAs with a complex 5′ UTR are readily translated. These mRNAs have 5′ UTRs that are long and contain a high degree of secondary structure and do not necessarily contain a TOP sequence. Some of these transcripts include VEGF, HIF1α, cyclin D1, FGF2, and c-myc; all of which are involved in cell growth, proliferation and transformation [reviewed in Mamane et al., 2006].
Initially, it was believed that inhibiting translation of transcripts that contained a 5′ TOP sequence was regulated by S6K1 and its phosphorylation of RPS6 [Gressner and Wool, 1974; Thomas and Thomas, 1986; Nemenoff et al., 1988; Jefferies et al., 1994a,b]. More recently, research has demonstrated that translation of mRNAs containing TOP sequences is independent of S6K1 and RPS6 [Stolovich et al., 2002; Pende et al., 2004]. In fact, mutating all of the serines on RPS6 did not alter the translational control of TOP mRNAs, but it did affect cell size [Ruvinsky et al., 2005]. Several laboratories have shown that the translation of TOP mRNAs remains sensitive to rapamycin treatment [Terada et al., 1994; Jefferies et al., 1994a, 1997; Amaldi and Pierandrei-Amaldi, 1997]. In various cell lines, the degree of TOP inhibition by rapamycin varies [Tang et al., 2001], indicating that the effects of rapamycin are most likely cell type dependent.
Originally rapamycin was used as an immunosuppressive drug and was given to patients undergoing organ transplants. Anti-cancer activity of rapamycin was identified and since then it has become important for cancer therapy and many efforts are being developed to synthesize derivatives with lower toxicities. Rapamycin exerts its effects by binding to FKBP12, a cytosolic immunophilin, and this complex then binds mTOR, inhibiting its kinase activity. However, mTOR can be incorporated into two different functional complexes, one containing rapamycin-insensitive companion of mTOR (rictor) and one containing regulatory associated protein of mTOR (raptor). Only the complex containing raptor is rapamycin sensitive. The mTOR–rictor complex is rapamycin insensitive and is not involved in protein translation, but rather in cytoskeletal rearrangements. It is the raptor containing complex that is important for translation and regulates the phosphorylation of S6K1 and 4E-BP1. This signaling complex is overactive in many cancers [reviewed in Huang and Houghton, 2001; Kurmasheva et al., 2006] with pleiotrophic effects including cell motility [Liu et al., 2006].
By inhibiting mTOR, it has been possible to re-sensitize prostate cancer cells to chemotherapeutics, indicating that increased signaling through the mTOR pathway helps prostate cancer cells survive [Grunwald et al., 2002; Wu et al., 2005]. For this reason, rapamycin and its derivatives are being explored in clinical trials with many different cancers, including, but not limited to, solid tumors, renal cancer, glioblastomas, non-small-cell lung cancer [Duran et al., 2006; Hidalgo et al., 2006; Fouladi et al., 2007; Gridelli et al., 2007; Milton et al., 2007; Motzer et al., 2007; Pandya et al., 2007; Sarkaria et al., 2007; Mita et al., 2008] and prostate cancer [reviewed in Majumder and Sellers, 2005]. They are most useful in combinational therapies because in many cases the increase in mTOR signaling results in a resistance to other therapeutic drugs [Grunwald et al., 2002; Oh et al., 2008]. By giving patients derivatives of rapamycin to reduce mTOR signaling and eIF4E availability, tumor cells are no longer able to use the “escape route” to overcome additional therapy.
This study was undertaken to evaluate the effects of rapamycin treatment on pathways involved in mTOR signaling specifically in prostate cancer cells that have become androgen insensitive and capable of homing to bone. Specifically, the study assesses mTOR signaling in prostate cancer cells with mutated PTEN that mimic cells in more than half of patients with advanced prostate cancer [McCall et al., 2008]. Understanding the mTOR signaling pathway is key to finding the best combination therapy for advanced prostate cancer treatment.
MATERIALS AND METHODS
CELL CULTURE
C4-2B cells were a generous gift from Dr. Leland Chung (Winship Cancer Center, Emory University College of Medicine, Atlanta, GA). The cells were maintained in T-medium (Gibco BRL/Life Technologies, Carlsbad, CA) supplemented with 5% (v/v) heat-inactivated fetal bovine serum (FBS). The media were changed every 48 h and the cells were kept at 37°C and 5% CO2.
POLYSOME ISOLATION
The protocol was performed as described [Müllner and Garcia-Sanz, 1997] with the following modifications: the gradient used was a 15–45% (w/v) sucrose gradient and the fractions were collected by hand. An 18½ gauge needle was used to puncture the bottom of the gradient and 22 half milliliters fractions were collected into RNase free Eppendorf tubes. After the proteinase K digestion, RNA was isolated with a phenol–chloroform extraction and precipitated overnight with isopropanol. The RNA pellet was resuspended in RNase free water (20 μl) and the RNA (3 μl) was diluted with RNase free water (7 μl) and glyoxal load dye (10 μl) (Ambion, Austin, TX). The samples were heated for 30 min at 55°C and electrophoresed on a 1.5% (w/v) agarose gel to examine the distribution of 18S and 28S rRNA. Densitometry of images captured using an AlphaImager (Alpha Inotech) allowed us to express the amount of 18S and 28S rRNA as a percentage of the total rRNA in all fractions. The data were graphed in Prism (Graphpad, San Diego, CA) and the curves were reconstructed using a 9 point smoothing procedure.
RT-PCR
The RNA from the polysome fractions was reverse transcribed using the Omniscript RT kit (Qiagen, Valencia, CA). For consistency, the cDNA from several fractions was pooled based on the percent sucrose (as determined using a refractometer) in each fraction to yield six pooled fractions which could be analyzed. Typically, the pools consisted of (in wt% sucrose): 32.5–37 (fully assembled polysomes), 28–32, 24.5–27.5, 20.5–24, 17–20, and 5–16.5 (free transcripts) and each contained 3–4 fractions. Equal volumes from the pooled fractions provided the template for PCR using Promega's GoTaq® Green mastermix (Madison, WI) (see Table I for primers and annealing temperatures). In some cases, results were confirmed by real time PCR, but because there were no inconsistencies in the data this cost and time intensive analysis was not performed for all samples.
TABLE I.
List of Primers and Gene Products Used for RT-PCR
| Gene product | Primer sequence | Annealing temperature (°C) | Product size (bp) |
|---|---|---|---|
| Cyclin D for [Cozar-Castellano et al., 2004] | ATGGAACACCAGCTCCTGTGCTGC | 65 | 888 |
| Cyclin D rev [Cozar-Castellano et al., 2004] | TCAGATGTCCACGTCCCGCACGT | ||
| EF1α2 fora | CAGTTCACCTCCCAGGTCAT | 55 | 156 |
| EF1α2 rev | GTTGTCCTCCACTTCTTGC | ||
| L32 for | AGGCATTGACAACAGGGTTC | 55 | 130 |
| L32 rev | GACGTTGTGGACCAGGAACT | ||
| β-actin for | GATGAGATTGGCATGGCTT | 55 | 100 |
| β-actin rev | CACCTTCACCGTTCCAGTTT | ||
| VEGF for [Muir et al., 2006] | CCTCCGAAACCATGAACTTT | 55 | 637 |
| VEGF rev [Muir et al., 2006] | AGAGATCTGGTTCCCGAAAC | ||
| L29 for | TCTTCCGGTTCTAGGCGCTT | 55 | 556 |
| L29 rev | GTCCTCATGTTGGCAGAGAT | ||
| HIF1α for | CTCAAAGTCGGACAGCCTCA | 55 | 460 |
| HIF1α rev | CCCTGCAGTAGGTTTCTGCT |
The primer sequence for each primer as well as the annealing temperature and product size are given for each primer pair used.
Primers were made specifically for this project unless otherwise noted.
INHIBITOR TREATMENTS
C4-2B cells were plated at high density (5×10⁶ cells/100 mm dish) and were allowed to attach overnight, after which they were switched to serum-free, phenol red-free RPMI 1640 medium (Gibco/BRL Life Sciences) for 24 h. Inhibitors were diluted in fresh serum-free, phenol red-free RPMI 1640 medium and added to the cells for 24 h following serum starvation unless stated otherwise. All cells received IGF-1 (100 ng/ml) alone (control) or in addition to LY294002 (40 μM; Cayman Chemical, Ann Arbor, MI), rapamycin (20 nM; Biosource International, Camarillo, CA) or PD98059 (50 μM; Biosource International). Doses were chosen based on commonly used concentrations in the literature for LY294002 [Lin et al., 1999; Barb et al., 2007] and PD98059 [Moro et al., 2007; Mukhopadhyay et al., 2007], however for rapamycin we conducted our own dose–response based on inhibition of phosphorylation of S6 at 30-min intervals over a 2-h period (not shown). Twenty nanomolars was the lowest effective dose and hence was chosen for use in all experiments. We expected that at this low dose, which was lower than many reported doses in the literature [Lin et al., 1999; Ghosh et al., 2005; Recchia et al., 2009], off target effects would be minimized as well.
RADIOACTIVE INCORPORATION OF 3H-LABELED AMINO ACIDS
C4-2B cells were plated at high density (1.25×10⁶ cells) into 6-well plates and treated as described above. After 21 h of drug treatment, 3H-labeled amino acid mixture (40 μCi; MP Biomedicals, Inc., Irvine, CA) was added to the medium. At 24 h (3 h after addition of radioactivity) cells were washed carefully three times with PBS and total cell lysate was harvested using 100 μl RIPA buffer supplemented with 1% (v/v) protease (Sigma, St. Louis, MO) and phosphatase (Calbiochem) inhibitors. Lysate was scraped off the plate and 50 μl was placed on a glass filter disk similar to that previously described [Carson et al., 1985]. The disks were added to boiling 10% (w/v) trichloroacetic acid (TCA) for 5 min and then washed twice in 10% (w/v) TCA. The disks were washed with 70% (v/v) ice cold ethanol and then 100% ice cold acetone. Once the disks were dried, they were placed into scintillation vials. Scintillation fluid was added and radioactivity was counted in a liquid scintillation counter (Packard BioScience Company, Meriden, CT). Protein concentration of the lysate was determined using a BCA kit (Pierce, Rockford, IL) and data are presented as a ratio of radioactivity to amount of protein.
WESTERN BLOT
C4-2B cells were plated as described above. Protein was harvested from wells of a 6-well plate unless otherwise specified using Sample Extraction Buffer (SEB: 0.05 M Tris, pH 7.0, 8 M urea, 1% [w/v] SDS, 1% [v/v] β-mercaptoethanol, and 1% [v/v] protein inhibitor cocktail [Sigma] and 1% [v/v] phosphatase inhibitor cocktail [Calbiochem]). The protein concentration was determined using a Lowry Assay [Lowry et al., 1951] and was subjected to sodium dodecyl sulfate–polyacrylamide gel electrophoresis (SDS–PAGE). Briefly, gels were electrophoresed using the NUPAGE system (Gibco BRL/Life Technologies) for 1.5 h at 160 V. Following electrophoresis, proteins were transferred to a nitrocellulose membrane at 4°C for 5 h at 40 V. The membrane then was blocked overnight in tris-buffered saline with 0.5% (v/v) Tween-20 (TBST) with 3% (w/v) bovine serum albumin (BSA) at 4°C while shaking. Either the total S6 antibody (Cell Signaling Technology, Inc., Danvers, MA) at a 1:2,000 dilution (v/v), or p-S6 antibody (Cell Signaling Technology, Inc.) at a 1:2,000 dilution (v/v) was added to the blot and incubated overnight at 4°C with continued agitation. The following day, the blot was washed three times with TBST and incubated for 1 h at room temperature (RT) with an anti-rabbit horseradish peroxidase (HRP)-conjugated secondary antibody (Sigma). The blot was washed an additional three times and exposed using ECL (Pierce). The blots containing total or p-S6 antibody were stripped prior to being reprobed by using Restore Plus Western Blot Stripping Buffer (Pierce). For the p-4E-BP1 and tubulin blot, protein was harvested using boiling Laemmli buffer (Biorad) and equal volumes loaded on a 12% (w/v) acrylamide Bis–Tris gel. Protein was transferred to a polyvinylidene fluoride membrane (Biorad) and transferred for 1 h at 100 V at 4°C. The membrane was blocked in 5% (w/v) BSA in TBST and anti-tubulin (1:1,000) or anti-p-4EBP-1 (1:1,000) was added. The membrane was washed with distilled H2O before the addition of the HRP-conjugated secondary antibody for 2 h at RT. The membranes were washed and incubated with ECL Plus® chemiluminescent detection reagent (Amersham) and exposed to film.
SECRETED VASCULAR ENDOTHELIAL GROWTH FACTOR (VEGF) PRODUCTION
Cells were plated as described above in 6-well tissue culture plates. After 24 h of treatment with the inhibitors, conditioned medium was removed and stored at −80°C. After thawing, the conditioned medium was centrifuged to remove cell debris and subjected to a VEGF Enzyme-Linked ImmunoSorbent Assay (ELISA; R&D Systems, Inc., Minneapolis, MN). Concentration of VEGF in the conditioned medium was determined based on a standard curve.
STATISTICS
All statistics were performed using InStat3 (Graphpad). Data were analyzed using a one-way analysis of variance (ANOVA) and Dunnetts' post-test.
RESULTS
To elucidate the mTOR pathway in the C4-2B prostate cancer cell line and to determine how inhibiting different pathways affected the downstream regulators we used a variety of inhibitors and examined downstream target activation. To determine the effect of these inhibitors on the mTOR pathway, we examined the phosphorylation of S6 and 4E-BP1. Treatment of C4-2B cells with either rapamycin, an inhibitor of mTOR, or LY294002, an inhibitor of PI3K, greatly reduced the level of phosphorylation of S6 seen in the control (Fig. 1A). Doses used in this study were chosen based on values in the literature which are known to be effective for LY294002 and PD98059 and a dose and time curve was performed for rapamycin (see Materials and Methods Section). PD98059, an inhibitor of MEK1/2, had only a small effect, if any, on the phosphorylation of S6. The results are the same for the phosphorylation of 4E-BP1. Treatment with either LY294002 or rapamycin decreased the phosphorylation of 4E-BP1, but PD98059 only had a modest effect (Fig. 1B).
Fig. 1.

Inhibiting PI3K and mTOR decreases protein phosphorylation of downstream targets. C4-2B cells were plated at high density and cultured in serum free medium for 24 h. They were given IGF-1 with or without PD98059, LY294002, or rapamycin for 24 h. Cells were lysed and total protein extracted. Western blots were performed looking at (A) total and p-S6 and (B) p-4E-BP1 after each treatment.
Because these drugs were affecting the phosphorylation of key proteins involved in translation, we determined if these inhibitors also were affecting the rate of general protein translation (Fig. 2A,B). We included IGF-1 in all treatments to ensure maximal stimulation of the PI3K pathway and to maintain cell viability (Fig. 2A) but there was no effect on the rate of radioactive amino acid incorporation compared with the serum free control (data not shown). After 24 h of drug treatment, there was an effect on translation by all inhibitors. PD98059 reduced translation by ~25%, LY294002 by ~65%, and rapamycin by ~45%, similar to the inhibition seen on the phosphorylation of downstream targets of mTOR. However, from the time course of radioactive incorporation it is clear that LY294002 acts more quickly than rapamycin or PD98059. In fact, no statistically significant decrease in accumulation of 3H-amino acids with PD98059 treatment was seen compared to the control until after 24 h of treatment. In contrast, with rapamycin treatment a significant decrease was observed by 12 h and with LY294002 treatment a significant decrease in accumulation occurred by 6 h. By 24 h, all three inhibitors had significantly reduced translation, though LY294002 was the most potent inhibitor of translation, followed by rapamycin.
Fig. 2.

Inhibitors reduce rates of translation to different extents. C4-2B cells were plated at high density and serum starved for 24 h before being given IGF-1 with or without PD98059, LY294002, or rapamycin for the specified time. Radioactive amino acids were added 3 h before the time point ended. Radioactive counts are expressed as a measure of protein for (A) IGF-1 or (B) normalized to the IGF-1 treatment for each time point.
With such large effects on translation, we expected to see large changes in polysome profiles after treatment with each of these inhibitors. Using a continuous sucrose gradient, we isolated fractions of different densities and examined the 18S and 28S rRNA distribution to assess the distribution of assembled and unassembled ribosomes (Fig. 3A). The fully loaded polysomes are found in the fractions with the highest percentage of sucrose at the bottom of the tubes (see Materials and Methods Section). Differences in polysome profiles after inhibitor treatments were seen primarily in the lighter fractions instead of the heavier fractions containing loaded ribosomes. By determining the percentage of 18S and 28S rRNA in each fraction and aligning it with the measured percentage of sucrose in each fraction, we determined that there was a minor decrease in heavy polysomes (fractions on the far right with equal amounts of 18S and 28S rRNA) in samples treated with LY294002 and a corresponding increase in pre-initiation complexes (fractions towards the left with only 18S or an unequal amount of 18S and 28S rRNA; Fig. 3A,B). Interestingly, only very minor shifts in polysome distribution, if any, were seen with both rapamycin and PD98059 treatments when compared to the control.
Fig. 3.

Polysome formation is disrupted by pathway inhibitors. C4-2B cells were treated with the indicated drug for 24 h with IGF-1 and cell lysates were layered over a 15–45% sucrose gradient and centrifuged. A: Half milliliters fractions were collected and the RNA isolated from each fraction was analyzed on an agarose gel to identify 18S and 28S rRNA. The triangle below the gels indicate the where the light and heavy fractions are found. B: Densitometry of each fraction was determined and the amount of 18S and 28S rRNA was expressed as a percentage of the total in all fractions. This was graphed as a function of percentage sucrose in each fraction and the curves were subjected to a 9 point smoothening. The arrows correspond to the increase in the pre-initiation complexes after LY294002 treatment and the corresponding decrease in heavy polysomes.
Our failure to find a large change in the polysome profiles in drug-treated cells compared to control cells prompted us to examine the association of specific transcripts with polysomes. We first examined selected transcripts that had a known 5′ TOP sequence including rpl29, rpl32, and EF1a2–encoding two ribosomal proteins and an elongation factor (Fig. 4A). We used β-actin, which does not contain a 5′ TOP sequence, as a control. Only LY294002 affected the association of these transcripts with polysomes and the effect was most evident in the heaviest fractions (fraction 6). Interestingly, rapamycin caused an increase in the rpl29 and rpl32 transcript in the lightest fraction (fraction 1). Because we did not see the magnitude of changes that we would have anticipated from the effects of rapamycin on protein synthesis rates, we examined another subset of transcripts, those that had a complex 5′ UTR, such as VEGF, HIF1α, and Cyclin D (Fig. 4B). A decrease in the association of these transcripts with the ribosome was seen in samples treated with either LY294002 or rapamycin. Although the changes were more striking in the samples treated with LY294002, the decrease also was significant in the rapamycin treated samples. Treatment with PD98059 did not significantly alter the ribosomal association of any of the transcripts that we studied. There were also significant decreases in the total association of the ribosome with cyclin D1, HIF1α, and VEGF with LY294002 treatment and rapamycin treatment (Fig. 5). There were no significant differences seen with PD98059 treatment for any of these transcripts. In addition, none of the treatments affected the association of β-actin with the ribosome assessed by densitometry of the fractions. To verify that these changes in the association of transcripts with the ribosome produced corresponding changes in the protein expression, we performed a VEGF ELISA using conditioned medium from cells given each treatment, and found that the level of secreted VEGF protein was significantly decreased in samples treated with LY294002 or rapamycin (Fig. 6). Once again, treatment with PD98059 did not produce a significant decrease compared to the control. Thus, the affects we see on the translation of specific transcripts by RT-PCR corresponds to decreases in the resulting protein.
Fig. 4.

Treatment with rapamycin reduces the association of ribosomes with transcripts having complex 5′ UTRs. Samples from the polysome isolations (shown in Fig. 3) were pooled into 6 fractions based on sucrose concentrations. The RNA from the pooled fractions was used to make cDNA and then used for RT-PCR. A: Primers for transcripts that contain TOP sequences and β-actin as a control and (B) transcripts that have a complex 5′ UTRs were used to analyze the association of these groups with the ribosome.
Fig. 5.
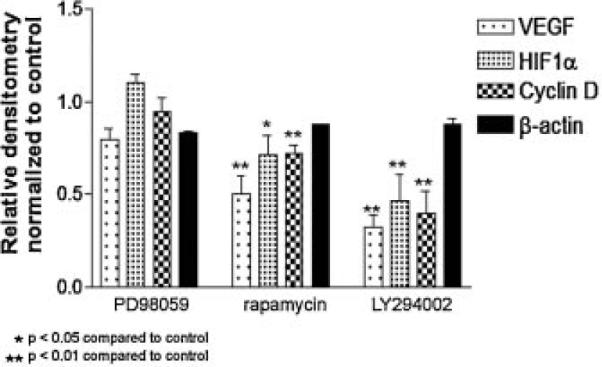
Relative amounts of transcripts in polysome fractions. Densitometric values for the labeled transcripts from the RT-PCR were calculated for each of the six fractions and added together. The total densitometric values were normalized to the IGF-1 treated samples for each transcript. There are significant differences in the total amount of VEGF, HIF1α, and Cyclin D in samples treated with rapamycin and LY294002 compared to IGF-1 or PD98059 treatment. There was no significant change in β-actin between any of the treatments.
Fig. 6.

Blocking the mTOR pathway with LY294002 or rapamycin decreases secreted VEGF levels in the conditioned medium. Cells were plated as described in Materials and Methods Section and after 24 h of treatment with the indicated inhibitors, conditioned medium was collected and subjected to a VEGF ELISA.
DISCUSSION
The initiation factor eIF4E binds to the 5′ cap structure of mRNAs and joins other initiation factors to form the eIF4F complex which scans the RNA and unwinds the 5′ UTR to begin translation. Because eIF4E is the rate limiting factor for translation initiation, its overexpression results in not only increased cap-dependent translation, but translation of transcripts that contain a complex 5′ UTR. Many cancers overexpress eIF4E [De Benedetti and Harris, 1999; Graff et al., 2008], and this results in an increase in translation of mRNAs coding cell cycle regulators (such as cyclin D1) and promoters of cell growth and angiogenesis (such as VEGF). Inducible overexpression of eIF4E results in enhanced translation of ribosomal proteins, factors related to cell growth and anti-apoptotic factors [reviewed in Mamane et al., 2004]. In C4-2B cells, we did not see a change in the association of ribosomal protein transcripts with the ribosome. However, we examined specifically alterations in the mRNA association with the ribosome and not expression of these ribosomal proteins. It is possible that changes in expression of ribosomal proteins occur through a mechanism that causes changes in protein stability and degradation.
Cells treated with inhibitors for MAPK, PI3K or mTOR decreased global translation. Although the decrease in translation that was observed with treatment of PD98059, a MEK1/2 inhibitor, is modest, it remains significantly decreased compared to the IGF-1 stimulated translation. This indicates that in our model, the MAPK pathway plays only a small role in general translation. This may be due to the ability of MNK1/2 to phosphorylate eIF4E. While the phosphorylation of eIF4E increases its affinity for the 5′ UTR, availability of eIF4E for phosphorylation is not affected and is more important. However, the decreases in overall translation that we observed with LY294002, an inhibitor of PI3K, and rapamycin, an mTOR inhibitor, are more striking, indicating that the PI3K pathway plays an important role in translational activation, most likely through mTOR in our model of prostate cancer that is androgen independent and has metastasized to the bone. In addition, we saw decreases in the association of ribosomal protein transcripts with heavy polysomes when cells were treated with LY294002, but not when they were treated with rapamycin. This suggests that rapamycin does not affect the translation of these transcripts to a large degree. However, the most striking observation was that treatment with rapamycin decreased the association of transcripts with complex 5′ UTRs with polysomes. The translation of these transcripts is regulated through the availability and abundance of eIF4E. This suggests that while mTOR can signal both through S6K1 and 4E-BP1, in the C4-2B model of prostate cancer the signaling through 4E-BP1 is predominant (Fig. 7). It also suggests that these pathways should be potential targets for therapy in bone metastatic prostate cancer because of the large effect that these inhibitors had on translation, specifically on transcripts necessary for tumor survival.
Fig. 7.

Control of 5′ UTR transcript translation depends on mTOR signaling. In prostate cancer cells, PD98059 seems to have little effect on translation and most likely is not acting through the phosphorylation of MNK1/2 via ERK1/2 otherwise an effect on translation of transcripts with complex 5′ UTRs would be observed. On the other hand, treatment with LY294002 blocks far upstream and causes the largest decrease on translation because all different arms of the pathway are inhibited. However, rapamycin targets further downstream at mTOR and while it decreases the phosphorylation of S6 and 4E-BP1, it has only an effect on the translation of transcripts with complex 5′ UTRs, indicating that it acts primarily through 4E-BP1 in our cell system.
While rapamycin effectively reduces the translation of specific transcripts necessary for cancer cell growth and progression, rapamycin treatment alone may not be the best therapeutic strategy. Patients that have alterations in PTEN that render it inactive or activating mutations in AKT will be more sensitive to rapamycin therapy [Huang and Houghton, 2001]. Rapamycin can reverse multidrug resistance [Arceci et al., 1992] and can specifically reverse resistance to chemotherapeutic agents such as doxorubicin and EGFR inhibitors [Grunwald et al., 2002; Bianco et al., 2008; Oh et al., 2008] by thwarting the ability of the cancer cells to signal through mTOR and translate proteins necessary for survival and resistance. However, there are still complications surrounding the use of rapamycin in the clinic. For example, studies have found that rapamycin, through inhibition of S6K1, is involved in a negative feedback mechanism that when disrupted increases AKT activity [Wan et al., 2007]. In addition, long-term treatment with rapamycin affects both the mTOR–raptor complex as well as the mTOR–rictor complex. The links between these feedback loops and drug resistance as occurs in the clinic however are currently not known. Finally, there are certain cancers that have mutations in PTEN that do not respond to rapamycin therapy in the clinic when administered alone [reviewed in Abraham and Gibbons, 2007]. Therefore, giving rapamycin in combinational therapy to those patients who have demonstrated resistance to an individual chemotherapeutic drug may be beneficial.
Rapamycin was previously demonstrated to selectively inhibit the translation of mRNAs that have a 5′ TOP sequence [Jefferies et al., 1994a, 1997]. Rapamycin and LY294002 further were shown to inhibit the expression of VEGF [Dichtl et al., 2006; Bianco et al., 2008] and HIF1α [Zhong et al., 2000] both of which have complex 5′ UTRs without TOP sequences. In this work, we have shown that these two drugs directly affect translation of VEGF and HIF1α by reducing the amount of transcript associated with the ribosome. The reduction in transcript association with assembled polysomes is likely responsible for the reduction in secreted VEGF protein that we found in C4-2B cells. One group found that rapamycin has no effect on HIF1α expression during hypoxia in a number of cell lines when serum is present, but under low serum and hypoxic conditions rapamycin can affect HIF1α expression, indicating that HIF1α expression can be modulated by different pathways [Pore et al., 2006]. Both VEGF and HIF1α have IRES sequences that are predicted to be activated under conditions of stress [Lang et al., 2002]. For some cell lines, serum starvation is enough to induce stress, although we did not observe a decrease in translation and these cells demonstrate activated AKT after several days of serum starvation (unpublished data). While the debate about the existence of a mammalian IRES is highly controversial [Kozak, 2001; Schneider et al., 2001; Merrick, 2004], IRES-mediated translation most likely does not play a role in our system, although if it did, rapamycin would have no effect on this translation. It has been reported that IRES-mediated translation does not involve eIF4E [Pestova et al., 2001]. Therefore, rapamycin should not inhibit this translation and there would be no decrease in the expression of secreted VEGF protein. Because we observed a decrease in secreted VEGF protein (Fig. 6), IRES-mediated translation does not contribute significantly to the protein translation of C4-2B cells after 24 h of serum starvation.
We have shown that treatment of prostate cancer cells with rapamycin under IGF-1 stimulated conditions causes a selective repression of translation of transcripts that contain a complex 5′ UTR, specifically VEGF, cyclin D1, and HIF1α, all of which are involved in cancer cell survival in hostile microenvironments. Each of these proteins can be upregulated in cancers and is associated with poor prognosis, especially VEGF. Secreted VEGF stimulates the formation of blood vessels to feed the tumor following development of local hypoxia. HIF1α expression can be upregulated by IGF-1 in breast cancer cells [Sutton et al., 2007] even in the absence of hypoxia. Such mTOR-dependent adaptations allow cancer cells to proliferate and survive an otherwise hostile environment.
By determining the transcripts that have a reduced association with the ribosome in prostate cancer cells treated with rapamycin, we can determine whether rapamycin is targeting specific transcripts associated with cell survival or generally decreases translation. There are limited numbers of clinical trials currently underway that explore the use of rapamycin in prostate cancer. Because of the loss of PTEN function in a large number of prostate cancer patients, rapamycin and its analogs remain viable candidates for care. However, while the research on rapamycin and its derivatives has grown tremendously, the pathway remains complicated and incompletely understood. As we have demonstrated here, in androgen-independent disease, rapamycin can be a potent inhibitor of translation of proteins necessary for cancer cells to survive, specifically those involved in cell cycle, angiogenesis, and hypoxic response. A more comprehensive understanding of the mechanism of action of rapamycin will create new avenues for use of combinational therapies for patients with advanced prostate cancer in the hopes that targeting multiple pathways will yield a larger anti-tumor effect and negate development of resistance.
ACKNOWLEDGMENTS
We would like to thank Lisa Davies and Dr. B.J. Williams for their protocols and helpful discussions regarding the content of this article. We also would like to thank Dr. Catherine Kirn-Safran, Dr. Daniel Carson, and Mr. Benjamin Rohe for their many discussions and Ms. Sharron Kingston for her secretarial assistance. We would like to thank Dr. Robert Sikes for his generous gift of IGF-1. We also would like to thank Dr. Leland Chung for the generous gift of C4-2B cells.
Grant sponsor: National Institutes of Health; Grant number: P01CA098912.
REFERENCES
- Abraham RT, Gibbons JJ. The mammalian target of rapamycin signaling pathway: Twists and turns in the road to cancer therapy. Clin Cancer Res. 2007;13:3109–3114. doi: 10.1158/1078-0432.CCR-06-2798. [DOI] [PubMed] [Google Scholar]
- Amaldi F, Pierandrei-Amaldi P. TOP genes: A translationally controlled class of genes including those coding for ribosomal proteins. Prog Mol Subcell Biol. 1997;18:1–17. doi: 10.1007/978-3-642-60471-3_1. [DOI] [PubMed] [Google Scholar]
- Arceci RJ, Stieglitz K, Bierer BE. Immunosuppressants FK506 and rapamycin function as reversal agents of the multidrug resistance phenotype. Blood. 1992;80:1528–1536. [PubMed] [Google Scholar]
- Barb D, Neuwirth A, Mantzoros CS, Balk SP. Adiponectin signals in prostate cancer cells through Akt to activate the mammalian target of rapamycin pathway. Endocr Relat Cancer. 2007;14:995–1005. doi: 10.1677/ERC-06-0091. [DOI] [PubMed] [Google Scholar]
- Bianco R, Garofalo S, Rosa R, Damiano V, Gelardi T, Daniele G, Marciano R, Ciardiello F, Tortora G. Inhibition of mTOR pathway by everolimus cooperates with EGFR inhibitors in human tumours sensitive and resistant to anti-EGFR drugs. Br J Cancer. 2008;98:923–930. doi: 10.1038/sj.bjc.6604269. [DOI] [PMC free article] [PubMed] [Google Scholar]
- Carson DD, Farach MC, Earles DS, Decker GL, Lennarz WJ. A monoclonal antibody inhibits calcium accumulation and skeleton formation in cultured embryonic cells of the sea urchin. Cell. 1985;41:639–648. doi: 10.1016/s0092-8674(85)80036-2. [DOI] [PubMed] [Google Scholar]
- Cozar-Castellano I, Takane KK, Bottino R, Balamurugan AN, Stewart AF. Induction of beta-cell proliferation and retinoblastoma protein phosphorylation in rat and human islets using adenovirus-mediated transfer of cyclin-dependent kinase-4 and cyclin D1. Diabetes. 2004;53:149–159. doi: 10.2337/diabetes.53.1.149. [DOI] [PubMed] [Google Scholar]
- De Benedetti A, Harris AL. eIF4E expression in tumors: Its possible role in progression of malignancies. Int J Biochem Cell Biol. 1999;31:59–72. doi: 10.1016/s1357-2725(98)00132-0. [DOI] [PubMed] [Google Scholar]
- Dichtl W, Stocker EM, Mistlberger K, Debbage P, Yan ZQ, Alber HF, Frick M, Dulak J, Pachinger O, Weidinger F. Countervailing effects of rapamycin (sirolimus) on nuclear factor-kappa B activities in neointimal and medial smooth muscle cells. Atherosclerosis. 2006;186:321–330. doi: 10.1016/j.atherosclerosis.2005.08.016. [DOI] [PubMed] [Google Scholar]
- Duran I, Kortmansky J, Singh D, Hirte H, Kocha W, Goss G, Le L, Oza A, Nicklee T, Ho J, Birle D, Pond GR, Arboine D, Dancey J, Aviel-Ronen S, Tsao MS, Hedley D, Siu LL. A phase II clinical and pharmacodynamic study of temsirolimus in advanced neuroendocrine carcinomas. Br J Cancer. 2006;95:1148–1154. doi: 10.1038/sj.bjc.6603419. [DOI] [PMC free article] [PubMed] [Google Scholar]
- Fouladi M, Laningham F, Wu J, O'Shaughnessy MA, Molina K, Broniscer A, Spunt SL, Luckett I, Stewart CF, Houghton PJ, Gilbertson RJ, Furman WL. Phase I study of everolimus in pediatric patients with refractory solid tumors. J Clin Oncol. 2007;25:4806–4812. doi: 10.1200/JCO.2007.11.4017. [DOI] [PubMed] [Google Scholar]
- Ghosh PM, Malik SN, Bedolla RG, Wang Y, Mikhailova M, Prihoda TJ, Troyer DA, Kreisberg JI. Signal transduction pathways in androgen-dependent and -independent prostate cancer cell proliferation. Endocr Relat Cancer. 2005;12:119–134. doi: 10.1677/erc.1.00835. [DOI] [PubMed] [Google Scholar]
- Graff JR, Konicek BW, Carter JH, Marcusson EG. Targeting the eukaryotic translation initiation factor 4E for cancer therapy. Cancer Res. 2008;68:631–634. doi: 10.1158/0008-5472.CAN-07-5635. [DOI] [PubMed] [Google Scholar]
- Gressner AM, Wool IG. The phosphorylation of liver ribosomal proteins in vivo. Evidence that only a single small subunit protein (S6) is phosphorylated. J Biol Chem. 1974;249:6917–6925. [PubMed] [Google Scholar]
- Gridelli C, Rossi A, Morgillo F, Bareschino MA, Maione P, Di Maio M, Ciardiello F. A randomized phase II study of pemetrexed or RAD001 as second-line treatment of advanced non-small-cell lung cancer in elderly patients: Treatment rationale and protocol dynamics. Clin Lung Cancer. 2007;8:568–571. doi: 10.3816/CLC.2007.n.045. [DOI] [PubMed] [Google Scholar]
- Grunwald V, DeGraffenried L, Russel D, Friedrichs WE, Ray RB, Hidalgo M. Inhibitors of mTOR reverse doxorubicin resistance conferred by PTEN status in prostate cancer cells. Cancer Res. 2002;62:6141–6145. [PubMed] [Google Scholar]
- Hamilton TL, Stoneley M, Spriggs KA, Bushell M. TOPs and their regulation. Biochem Soc Trans. 2006;34:12–16. doi: 10.1042/BST20060012. [DOI] [PubMed] [Google Scholar]
- Hidalgo M, Buckner JC, Erlichman C, Pollack MS, Boni JP, Dukart G, Marshall B, Speicher L, Moore L, Rowinsky EK. A phase I and pharmacokinetic study of temsirolimus (CCI-779) administered intravenously daily for 5 days every 2 weeks to patients with advanced cancer. Clin Cancer Res. 2006;12:5755–5763. doi: 10.1158/1078-0432.CCR-06-0118. [DOI] [PubMed] [Google Scholar]
- Huang S, Houghton PJ. Resistance to rapamycin: A novel anticancer drug. Cancer Metastasis Rev. 2001;20:69–78. doi: 10.1023/a:1013167315885. [DOI] [PubMed] [Google Scholar]
- Jefferies HB, Reinhard C, Kozma SC, Thomas G. Rapamycin selectively represses translation of the “polypyrimidine tract” mRNA family. Proc Natl Acad Sci USA. 1994a;91:4441–4445. doi: 10.1073/pnas.91.10.4441. [DOI] [PMC free article] [PubMed] [Google Scholar]
- Jefferies HB, Thomas G, Thomas G. Elongation factor-1 alpha mRNA is selectively translated following mitogenic stimulation. J Biol Chem. 1994b;269:4367–4372. [PubMed] [Google Scholar]
- Jefferies HB, Fumagalli S, Dennis PB, Reinhard C, Pearson RB, Thomas G. Rapamycin suppresses 5′ TOP mRNA translation through inhibition of p70s6k. EMBO J. 1997;16:3693–3704. doi: 10.1093/emboj/16.12.3693. [DOI] [PMC free article] [PubMed] [Google Scholar]
- Kozak M. New ways of initiating translation in eukaryotes? Mol Cell Biol. 2001;21:1899–1907. doi: 10.1128/MCB.21.6.1899-1907.2001. [DOI] [PMC free article] [PubMed] [Google Scholar]
- Kremer CL, Klein RR, Mendelson J, Browne W, Samadzedeh LK, Vanpatten K, Highstrom L, Pestano GA, Nagle RB. Expression of mTOR signaling pathway markers in prostate cancer progression. Prostate. 2006;66:1203–1212. doi: 10.1002/pros.20410. [DOI] [PubMed] [Google Scholar]
- Kurmasheva RT, Huang S, Houghton PJ. Predicted mechanisms of resistance to mTOR inhibitors. Br J Cancer. 2006;95:955–960. doi: 10.1038/sj.bjc.6603353. [DOI] [PMC free article] [PubMed] [Google Scholar]
- Lang KJ, Kappel A, Goodall GJ. Hypoxia-inducible factor-1alpha mRNA contains an internal ribosome entry site that allows efficient translation during normoxia and hypoxia. Mol Biol Cell. 2002;13:1792–1801. doi: 10.1091/mbc.02-02-0017. [DOI] [PMC free article] [PubMed] [Google Scholar]
- Lin J, Adam RM, Santiestevan E, Freeman MR. The phosphatidylinositol 3′-kinase pathway is a dominant growth factor-activated cell survival pathway in LNCaP human prostate carcinoma cells. Cancer Res. 1999;59:2891–2897. [PubMed] [Google Scholar]
- Liu L, Li F, Cardelli JA, Martin KA, Blenis J, Huang S. Rapamycin inhibits cell motility by suppression of mTOR-mediated S6K1 and 4E-BP1 pathways. Oncogene. 2006;25:7029–7040. doi: 10.1038/sj.onc.1209691. [DOI] [PubMed] [Google Scholar]
- Lowry OH, Rosebrough NJ, Farr AL, Randall RJ. Protein measurement with the Folin phenol reagent. J Biol Chem. 1951;193:265–275. [PubMed] [Google Scholar]
- Majumder PK, Sellers WR. Akt-regulated pathways in prostate cancer. Oncogene. 2005;24:7465–7474. doi: 10.1038/sj.onc.1209096. [DOI] [PubMed] [Google Scholar]
- Mamane Y, Petroulakis E, Rong L, Yoshida K, Ler LW, Sonenberg N. eIF4E–From translation to transformation. Oncogene. 2004;23:3172–3179. doi: 10.1038/sj.onc.1207549. [DOI] [PubMed] [Google Scholar]
- Mamane Y, Petroulakis E, LeBacquer O, Sonenberg N. mTOR, translation initiation and cancer. Oncogene. 2006;25:6416–6422. doi: 10.1038/sj.onc.1209888. [DOI] [PubMed] [Google Scholar]
- McCall P, Witton CJ, Grimsley S, Nielsen KV, Edwards J. Is PTEN loss associated with clinical outcome measures in human prostate cancer? Br J Cancer. 2008;99:1296–1301. doi: 10.1038/sj.bjc.6604680. [DOI] [PMC free article] [PubMed] [Google Scholar]
- Merrick WC. Cap-dependent and cap-independent translation in eukaryotic systems. Gene. 2004;332:1–11. doi: 10.1016/j.gene.2004.02.051. [DOI] [PubMed] [Google Scholar]
- Milton DT, Riely GJ, Azzoli CG, Gomez JE, Heelan RT, Kris MG, Krug LM, Pao W, Pizzo B, Rizvi NA, Miller VA. Phase 1 trial of everolimus and gefitinib in patients with advanced nonsmall-cell lung cancer. Cancer. 2007;110:599–605. doi: 10.1002/cncr.22816. [DOI] [PubMed] [Google Scholar]
- Mita MM, Mita AC, Chu QS, Rowinsky EK, Fetterly GJ, Goldston M, Patnaik A, Mathews L, Ricart AD, Mays T, Knowles H, Rivera VM, Kreisberg J, Bedrosian CL, Tolcher AW. Phase I trial of the novel mammalian target of rapamycin inhibitor deforolimus (AP23573; MK-8669) administered intravenously daily for 5 days every 2 weeks to patients with advanced malignancies. J Clin Oncol. 2008;26:361–367. doi: 10.1200/JCO.2007.12.0345. [DOI] [PubMed] [Google Scholar]
- Moro L, Arbini AA, Marra E, Greco M. Constitutive activation of MAPK/ERK inhibits prostate cancer cell proliferation through upregulation of BRCA2. Int J Oncol. 2007;30:217–224. doi: 10.3892/ijo.30.1.217. [DOI] [PubMed] [Google Scholar]
- Motzer RJ, Hudes GR, Curti BD, McDermott DF, Escudier BJ, Negrier S, Duclos B, Moore L, O'Toole T, Boni JP, Dutcher JP. Phase I/II trial of temsirolimus combined with interferon alfa for advanced renal cell carcinoma. J Clin Oncol. 2007;25:3958–3964. doi: 10.1200/JCO.2006.10.5916. [DOI] [PubMed] [Google Scholar]
- Muir C, Chung LW, Carson DD, Farach-Carson MC. Hypoxia increases VEGF-A production by prostate cancer and bone marrow stromal cells and initiates paracrine activation of bone marrow endothelial cells. Clin Exp Metastasis. 2006;23:75–86. doi: 10.1007/s10585-006-9021-2. [DOI] [PubMed] [Google Scholar]
- Mukhopadhyay NK, Cinar B, Mukhopadhyay L, Lutchman M, Ferdinand AS, Kim J, Chung LW, Adam RM, Ray SK, Leiter AB, Richie JP, Liu BC, Freeman MR. The zinc finger protein ras-responsive element binding protein-1 is a coregulator of the androgen receptor: Implications for the role of the Ras pathway in enhancing androgenic signaling in prostate cancer. Mol Endocrinol. 2007;21:2056–2070. doi: 10.1210/me.2006-0503. [DOI] [PubMed] [Google Scholar]
- Müllner EW, Garcia-Sanz JA. Chapter 77 Polysome gradients. Academic Press; London: 1997. [Google Scholar]
- Nemenoff RA, Price DJ, Mendelsohn MJ, Carter EA, Avruch J. An S6 kinase activated during liver regeneration is related to the insulin-stimulated S6 kinase in H4 hepatoma cells. J Biol Chem. 1988;263:19455–19460. [PubMed] [Google Scholar]
- Oh SH, Jin Q, Kim ES, Khuri FR, Lee HY. Insulin-like growth factor-I receptor signaling pathway induces resistance to the apoptotic activities of SCH66336 (Lonafarnib) through Akt/mammalian target of rapamycin-mediated increases in survivin expression. Clin Cancer Res. 2008;14:1581–1589. doi: 10.1158/1078-0432.CCR-07-0952. [DOI] [PubMed] [Google Scholar]
- Pandya KJ, Dahlberg S, Hidalgo M, Cohen RB, Lee MW, Schiller JH, Johnson DH. A randomized, phase II trial of two dose levels of temsirolimus (CCI-779) in patients with extensive-stage small-cell lung cancer who have responding or stable disease after induction chemotherapy: A trial of the Eastern Cooperative Oncology Group (E1500) J Thorac Oncol. 2007;2:1036–1041. doi: 10.1097/JTO.0b013e318155a439. [DOI] [PubMed] [Google Scholar]
- Pende M, Um SH, Mieulet V, Sticker M, Goss VL, Mestan J, Mueller M, Fumagalli S, Kozma SC, Thomas G. S6K1(−/−)/S6K2(−/−) mice exhibit perinatal lethality and rapamycin-sensitive 5'-terminal oligopyrimidine mRNA translation and reveal a mitogen-activated protein kinase-dependent S6 kinase pathway. Mol Cell Biol. 2004;24:3112–3124. doi: 10.1128/MCB.24.8.3112-3124.2004. [DOI] [PMC free article] [PubMed] [Google Scholar]
- Pestova TV, Kolupaeva VG, Lomakin IB, Pilipenko EV, Shatsky IN, Agol VI, Hellen CU. Molecular mechanisms of translation initiation in eukaryotes. Proc Natl Acad Sci USA. 2001;98:7029–7036. doi: 10.1073/pnas.111145798. [DOI] [PMC free article] [PubMed] [Google Scholar]
- Petroulakis E, Mamane Y, Le Bacquer O, Shahbazian D, Sonenberg N. mTOR signaling: Implications for cancer and anticancer therapy. Br J Cancer. 2006;94:195–199. doi: 10.1038/sj.bjc.6602902. [DOI] [PMC free article] [PubMed] [Google Scholar]
- Pore N, Jiang Z, Shu HK, Bernhard E, Kao GD, Maity A. Akt1 activation can augment hypoxia-inducible factor-1alpha expression by increasing protein translation through a mammalian target of rapamycin-independent pathway. Mol Cancer Res. 2006;4:471–479. doi: 10.1158/1541-7786.MCR-05-0234. [DOI] [PubMed] [Google Scholar]
- Recchia AG, Musti AM, Lanzino M, Panno ML, Turano E, Zumpano R, Belfiore A, Ando S, Maggiolini M. A cross-talk between the androgen receptor and the epidermal growth factor receptor leads to p38MAPK-dependent activation of mTOR and cyclinD1 expression in prostate and lung cancer cells. Int J Biochem Cell Biol. 2009;41:603–614. doi: 10.1016/j.biocel.2008.07.004. [DOI] [PubMed] [Google Scholar]
- Ruvinsky I, Sharon N, Lerer T, Cohen H, Stolovich-Rain M, Nir T, Dor Y, Zisman P, Meyuhas O. Ribosomal protein S6 phosphorylation is a determinant of cell size and glucose homeostasis. Genes Dev. 2005;19:2199–2211. doi: 10.1101/gad.351605. [DOI] [PMC free article] [PubMed] [Google Scholar]
- Sarkaria JN, Schwingler P, Schild SE, Grogan PT, Mladek AC, Mandrekar SJ, Tan AD, Kobayashi T, Marks RS, Kita H, Miller RC, Limper AH, Leof EB. Phase I trial of sirolimus combined with radiation and cisplatin in non-small cell lung cancer. J Thorac Oncol. 2007;2:751–757. doi: 10.1097/JTO.0b013e3180cc2587. [DOI] [PubMed] [Google Scholar]
- Schneider R, Agol VI, Andino R, Bayard F, Cavener DR, Chappell SA, Chen JJ, Darlix JL, Dasgupta A, Donze O, Duncan R, Elroy-Stein O, Farabaugh PJ, Filipowicz W, Gale M, Jr., Gehrke L, Goldman E, Groner Y, Harford JB, Hatzglou M, He B, Hellen CU, Hentze MW, Hershey J, Hershey P, Hohn T, Holcik M, Hunter CP, Igarashi K, Jackson R, Jagus R, Jefferson LS, Joshi B, Kaempfer R, Katze M, Kaufman RJ, Kiledjian M, Kimball SR, Kimchi A, Kirkegaard K, Koromilas AE, Krug RM, Kruys V, Lamphear BJ, Lemon S, Lloyd RE, Maquat LE, Martinez-Salas E, Mathews MB, Mauro VP, Miyamoto S, Mohr I, Morris DR, Moss EG, Nakashima N, Palmenberg A, Parkin NT, Pe'ery T, Pelletier J, Peltz S, Pestova TV, Pilipenko EV, Prats AC, Racaniello V, Read GS, Rhoads RE, Richter JD, Rivera-Pomar R, Rouault T, Sachs A, Sarnow P, Scheper GC, Schiff L, Schoenberg DR, Semler BL, Siddiqui A, Skern T, Sonenberg N, Tahara SM, Thomas AA, Toulme JJ, Wilusz J, Wimmer E, Witherell G, Wormington M. New ways of initiating translation in eukaryotes. Mol Cell Biol. 2001;21:8238–8246. doi: 10.1128/MCB.21.23.8238-8246.2001. [DOI] [PMC free article] [PubMed] [Google Scholar]
- Stolovich M, Tang H, Hornstein E, Levy G, Cohen R, Bae SS, Birnbaum MJ, Meyuhas O. Transduction of growth or mitogenic signals into translational activation of TOP mRNAs is fully reliant on the phosphatidylinositol 3-kinase-mediated pathway but requires neither S6K1 nor rpS6 phosphorylation. Mol Cell Biol. 2002;22:8101–8113. doi: 10.1128/MCB.22.23.8101-8113.2002. [DOI] [PMC free article] [PubMed] [Google Scholar]
- Sutton KM, Hayat S, Chau NM, Cook S, Pouyssegur J, Ahmed A, Perusinghe N, Le Floch R, Yang J, Ashcroft M. Selective inhibition of MEK1/2 reveals a differential requirement for ERK1/2 signalling in the regulation of HIF-1 in response to hypoxia and IGF-1. Oncogene. 2007;26:3920–3929. doi: 10.1038/sj.onc.1210168. [DOI] [PubMed] [Google Scholar]
- Tang H, Hornstein E, Stolovich M, Levy G, Livingstone M, Templeton D, Avruch J, Meyuhas O. Amino acid-induced translation of TOP mRNAs is fully dependent on phosphatidylinositol 3-kinase-mediated signaling, is partially inhibited by rapamycin, and is independent of S6K1 and rpS6 phosphorylation. Mol Cell Biol. 2001;21:8671–8683. doi: 10.1128/MCB.21.24.8671-8683.2001. [DOI] [PMC free article] [PubMed] [Google Scholar]
- Terada N, Patel HR, Takase K, Kohno K, Nairn AC, Gelfand EW. Rapamycin selectively inhibits translation of mRNAs encoding elongation factors and ribosomal proteins. Proc Natl Acad Sci USA. 1994;91:11477–11481. doi: 10.1073/pnas.91.24.11477. [DOI] [PMC free article] [PubMed] [Google Scholar]
- Thomas G, Thomas G. Translational control of mRNA expression during the early mitogenic response in Swiss mouse 3T3 cells: Identification of specific proteins. J Cell Biol. 1986;103:2137–2144. doi: 10.1083/jcb.103.6.2137. [DOI] [PMC free article] [PubMed] [Google Scholar]
- Wan X, Harkavy B, Shen N, Grohar P, Helman LJ. Rapamycin induces feedback activation of Akt signaling through an IGF-1R-dependent mechanism. Oncogene. 2007;26:1932–1940. doi: 10.1038/sj.onc.1209990. [DOI] [PubMed] [Google Scholar]
- Wu L, Birle DC, Tannock IF. Effects of the mammalian target of rapamycin inhibitor CCI-779 used alone or with chemotherapy on human prostate cancer cells and xenografts. Cancer Res. 2005;65:2825–2831. doi: 10.1158/0008-5472.CAN-04-3137. [DOI] [PubMed] [Google Scholar]
- Zhong H, Chiles K, Feldser D, Laughner E, Hanrahan C, Georgescu MM, Simons JW, Semenza GL. Modulation of hypoxia-inducible factor 1alpha expression by the epidermal growth factor/phosphatidylinositol 3-kinase/PTEN/AKT/FRAP pathway in human prostate cancer cells: Implications for tumor angiogenesis and therapeutics. Cancer Res. 2000;60:1541–1545. [PubMed] [Google Scholar]