

Abstract
An important question in plant biology is how genes influence the crosstalk between hormones to regulate growth. In this study, we model POLARIS (PLS) gene function and crosstalk between auxin, ethylene and cytokinin in Arabidopsis. Experimental evidence suggests that PLS acts on or close to the ethylene receptor ETR1, and a mathematical model describing possible PLS–ethylene pathway interactions is developed, and used to make quantitative predictions about PLS–hormone interactions. Modelling correctly predicts experimental results for the effect of the pls gene mutation on endogenous cytokinin concentration. Modelling also reveals a role for PLS in auxin biosynthesis in addition to a role in auxin transport. The model reproduces available mutants, and with new experimental data provides new insights into how PLS regulates auxin concentration, by controlling the relative contribution of auxin transport and biosynthesis and by integrating auxin, ethylene and cytokinin signalling. Modelling further reveals that a bell-shaped dose–response relationship between endogenous auxin and root length is established via PLS. This combined modelling and experimental analysis provides new insights into the integration of hormonal signals in plants.
Keywords: hormonal crosstalk, mathematical model, POLARIS gene, root development
Introduction
Hormone signalling systems coordinate plant growth and development through a range of complex interactions. The activities of plant hormones, such as auxin, ethylene and cytokinin, depend on cellular context and exhibit interactions that can be either synergistic or antagonistic. An important question about understanding these interactions is how genes act on the crosstalk between hormones to regulate plant growth. It is known, for example, that auxin and cytokinin can each induce ethylene biosynthesis (Vogel et al, 1998), and ethylene can induce PIN protein expression, auxin transport and auxin biosynthesis in the root (Ruzicka et al, 2007; Stepanova et al, 2007; Swarup et al, 2007), as well as inhibit auxin transport in the stem (Suttle, 1988; Chilley et al, 2006). Furthermore, auxin can inhibit cytokinin synthesis (Nordstrom et al, 2004).
Previously, we identified the PLS gene of Arabidopsis, which transcribes a short mRNA encoding a 36-amino acid peptide that is required for correct root growth and vascular development (Casson et al, 2002). Experimental evidence shows that there is a link between PLS, ethylene signalling, auxin homeostasis and microtubule cytoskeleton dynamics (Chilley et al, 2006). Specifically, mutation of PLS results in an enhanced ethylene-response phenotype, defective auxin transport and homeostasis and altered sensitivity to microtubule inhibitors. These defects, along with the short-root phenotype, are suppressed by genetic and pharmacological inhibition of ethylene action. The expression of PLS is itself repressed by ethylene and induced by auxin. It was also shown that pls mutant roots are hyper-responsive to exogenous cytokinins and show increased expression of the cytokinin inducible gene, ARR5/IBC6, compared with the wild type (Casson et al, 2002). Therefore, PLS may also be required for correct auxin–cytokinin homeostasis to modulate root growth.
Thus to make appropriate decisions for growth and development, plant cells must process and integrate the signalling of multiple inputs. Complexity in signalling systems presents serious challenges to understand how cells respond to multiple hormones. In general, one of the requirements to meet these challenges is the development and application of mathematical models (Komarova et al, 2005; Diaz and Alvarez-Buylla, 2006; Schaber et al, 2006; Bardwell et al, 2007; Zou et al, 2008). To quantitatively understand and predict the roles of the crosstalk between auxin, ethylene and cytokinin signalling in plant growth, this study develops a mathematical model for the action of the PLS gene on the crosstalk between auxin, ethylene and cytokinin signalling in Arabidopsis.
A combined modelling and experimental analysis is applied in this study. First, existing literature relating to the action of PLS on the crosstalk between auxin, ethylene and cytokinin is mapped to a mathematical model. The interaction point between the PLS peptide and ethylene signalling has not been identified biochemically, although there is strong genetic evidence to suggest that PLS acts at the ethylene receptor (Chilley et al, 2006). We analyse the possibilities for the interactions between the PLS peptide and ethylene receptor and identify the one leading to correct response phenotypes. In addition, analysis of experimental data describing the regulation of PLS transcription by auxin and ethylene reveals that PLS regulation by ethylene is independent of auxin, although ethylene also regulates auxin biosynthesis.
On the basis of these analyses, a model is subsequently developed and used to make predictions that are tested experimentally. The results describe the possibilities for a role for the PLS peptide at the ethylene receptor and CTR1 kinase, and they provide new evidence for a link with cytokinin signalling; and for a role for PLS in auxin transport and biosynthesis, to regulate auxin accumulation in the root tip. Model analysis reveals that a bell-shaped dose–response relationship between endogenous auxin and root length is established via PLS to regulate root growth rate.
Results
Model development
A model for crosstalk between auxin, ethylene and cytokinin via the PLS gene was constructed on the basis of known molecular interactions and experimental evidence. The model is shown in Figure 1 and in Supplementary information. Model equations and parameter values are included in the Supplementary information. The model is a single-cell model applied to root development in Arabidopsis. The model construction process is as follows:
Figure 1.

Model for the action of POLARIS gene on the crosstalk of auxin, ethylene and cytokinin in Arabidopsis. Solid arrows indicate conversions, whereas dotted lines indicate regulations. Black dotted lines indicate regulation through auxin, ethylene or CTR1 receptors, whereas red dotted lines indicate these interactions, for which the molecular basis is unknown, but biological evidence shows their existence. There are a number of different possible ways to represent these interactions. For simplicity, we have included them without further expanding their interactions with the relevant receptors. The wide dotted line indicates regulations that are revealed by the discrepancy in auxin concentration in pls between modelling and experimental results (see Model predictions and experimental measurements section for details).
Auxin signalling crosstalk
In the model, two sources of auxin can be considered: auxin biosynthesis within the cell and auxin transport from other cells. Auxin enters the cell both due to passive permeability (diffusion) and by the action of influx carriers (AUX/LAX family; Bennett et al, 1996; Ljung et al, 2001). Experimental evidence (Suttle, 1988; Chilley et al, 2006) indicates that a relatively high ethylene signalling response inhibits the transport of auxin from the shoot to the root tip. However, the molecular basis of this inhibition is unclear. We assume that a molecule or molecules, X, located downstream of ethylene signalling, inhibit the transport of auxin from shoot to root (see ‘Ethylene signalling crosstalk’ below for more details). It is also evident that ethylene activates the biosynthesis of auxin locally in the root tip (Stepanova et al, 2007; Swarup et al, 2007), and it is known that cytokinin inhibits subsets of auxin responses (including hypocotyl elongation and lateral root growth; Casson and Lindsey, 2003; Coenen et al, 2003) and the biosynthesis of auxin (Eklof et al, 1997).
By taking these factors into account, we use two rate equations (ν1 and ν2) to describe the sources of auxin. In ν2, a background synthetic rate, k2, is included, and it represents the auxin biosynthetic rate that is independent of ethylene and cytokinin. ν2 stands for the case in which ethylene and cytokinin simultaneously act on a single pathway for auxin biosynthesis. In the Supplementary information, different types of kinetics for auxin biosynthesis and their relation to different reaction schemes are examined in detail. Auxin leaves the cell via efflux carriers (PINs and PGPs; Geislera and Murphy, 2006; Petrasek et al, 2006). In addition, the removal of biologically active free auxin also occurs by transport out of the cell and by conjugation or degradation (LeClere et al, 2002; Qin et al, 2005). It is assumed that the loss of active auxin follows ν3=(k3+k3a[X])[auxin], where k3[auxin] describes degradation/conjugation; and k3a[X][auxin] describes the ethylene-mediated upregulation of PINs (e.g. PIN2) via its downstream response, X, to remove auxin from the more distal region of the root tip (Ruzicka et al, 2007).
The auxin signalling response and its relationship with the PLS gene is described as follows: auxin binds with the inactivated form of its receptor, Ra, and changes it into the activated form, Ra*, with mass–action kinetics, ν4; the conversion of the activated form into the inactivated form follows first-order kinetics, ν5. The total auxin receptor concentration is [RaT]=[Ra]+[Ra*]. The effects of varying total auxin receptor concentration are analysed in the Supplementary information. Ra* subsequently activates downstream gene expression that includes PLS gene transcription. The rate for PLS transcription depends on [Ra*], reflecting the auxin-mediated activation of PLS (Casson et al, 2002). The details of PLS translational control are not clear, and therefore its rate is simply described by first-order kinetics. The degradation of PLS mRNA (PLSm) and protein (PLSp) is also included in the model.
Ethylene signalling crosstalk
It is known that both auxin and cytokinin can synergistically activate the biosynthesis of ethylene (Vogel et al, 1998; Stepanova et al, 2007). However, ethylene can also be synthesized without exogenous auxin and cytokinin application, such as in its role in root hair production (Tanimoto et al, 1995); and several studies place auxin signalling downstream of ethylene signalling (e.g. Roman et al, 1995; Stepanova et al, 2005; Chilley et al, 2006; Ruzicka et al, 2007; Swarup et al, 2007). Therefore, we can consider ethylene synthesis as comprising two components, as shown in ν12. The first is a background synthetic rate, k12, which will be considered a constant. The second includes the activation of ethylene biosynthesis by both auxin and cytokinin. In the Supplementary information, different types of kinetics for ethylene biosynthesis and their relation to different reaction schemes are examined. Removal of ethylene follows simple first-order kinetics.
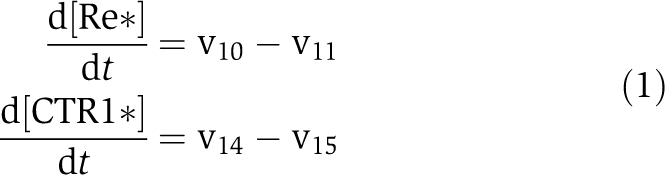
Following Diaz and Alvarez-Buylla (2006), ethylene signalling can be described as follows: ethylene acts on the activated form of its receptor, Re*, and changes it into the inactivated form, Re, with mass–action kinetics depending on both [ET] and [Re*], ν11. This ethylene–receptor interaction then leads to a loss of interaction between the receptor complex and the negative regulator MAP kinase, CTR1, and ethylene responses then occur. Receptor deactivation follows first-order kinetics. The total concentration of the receptor, ReT, is assumed to be conserved, [ReT]=[Re]+[Re*]. The activated ethylene receptor Re* activates CTR1, with mass-action kinetics, ν14. The activated form of CTR1, CTR1*, is deactivated with first-order kinetics. The total CTR1 concentration, CTR1T, is assumed to be conserved, and represented as [CTR1T]=[CTR1]+[CTR1*]. The effects of varying ReT and CTR1T are analysed in the Supplementary information. The active CTR1* subsequently activates a MAPK cascade, and activation of ethylene response requires inactivation of this MAPK cascade (Diaz and Alvarez-Buylla, 2006). Once the MAPK cascade is blocked by the presence of ethylene, EIN2 is activated, and expression of ERF1 and its downstream targets are activated (not shown in Figure 1). Activation of EIN2 depends on the concentration CTR1*. If CTR1* is small, the EIN2-activated form is large, and as [CTR1*] increases, the EIN2-activated form decreases. Therefore, CTR1* has an inhibitory role in the activation of the downstream ethylene signalling response.
As the molecule(s) in the downstream ethylene signalling response, which interact with the auxin signalling module, are largely unknown, the model does not, for the sake of simplicity, explicitly include the MAPK cascade and the pathway downstream from EIN2. Instead, we use a ‘component X’ to represent the ethylene-regulated molecule(s) that interact with auxin signalling. The production of X is inhibited by the activated CTR1*, as explained above. The rate for X production is ν16=k16−k16a[CTR1*] and the values of k16 and k16a are selected to reflect the following two facts: (a) if [CTR1*]=[CTRT], that is, all CTR1 molecules are in the activated state, ethylene signalling response is not activated; and (b) as CTR1* concentration decreases, the ethylene signalling response increases.
Analysis of interactions between PLS and ethylene signalling
Experimental evidence supports the view that the interaction between the PLS peptide and ethylene signalling module is at or close to the ethylene receptor ETR1 (Chilley et al, 2006), although how PLS protein may interact at the molecular level with ETR1 or with other components of the ethylene signalling pathway is not clear. Here, in the following text and in Supplementary information, we examine all possibilities of the PLS peptide interacting with ETR1 and CTR1 proteins to determine which interactions qualitatively lead to experimentally observed results.
If the PLS protein interacts with the ethylene receptor, with a function of activating the changes from the inactive form of ethylene receptor, Re, to its activated form, Re*, the kinetics of the ethylene receptor and CTR1 protein are described as follows:
 |
At a steady state,
 |
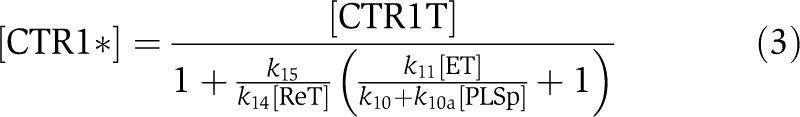 |
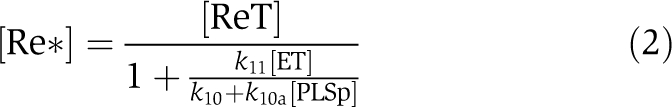
The relationship between [PLSp], [Re*] and [CTR1*] reveals the following scenario. If [PLSp] decreases, both [Re*] and [CTR1*] decrease. As CTR1* negatively regulates the downstream ethylene response, X, there is an increase in X. This, in turn, leads to a lower transport rate of auxin from shoot to root and, therefore, to a lower auxin concentration in the root. The trend qualitatively agrees well with experimental observations: the pls mutant has a lower transport rate of auxin from shoot to root, a lower root auxin concentration and a shorter root length (Chilley et al, 2006). Moreover, Chilley et al (2006) observed that for [PLSp]=0 μM (i.e., the pls mutant), reducing the functional interaction between ethylene and the ethylene receptor by genetic or pharmacological methods restores wild-type auxin concentration in the root. In Equation (3), this corresponds to the decrease in k11. Equation (3) predicts that if k10 is not zero, decreasing k11 increases [CTR1*]. Consequently, transport rate of auxin from shoot to root is higher, leading to the increase in auxin concentration. Therefore, the lower auxin concentration of the pls mutant can be rescued in the model by reducing ethylene responses, as observed experimentally (Chilley et al, 2006). However, if k10=0 s−1, Equation (3) shows that k11 no longer affects [CTR1*] for the pls mutant, and therefore it no longer affects auxin concentration. As this result contradicts experimental observations, k10 should therefore not be zero. The result implies that inter-conversion between the inactivated and activated forms of the ethylene receptor occurs, regardless of whether the PLS peptide acts on the ethylene receptor. Importantly, however, PLS more effectively changes the inactivated form to the activated form, regulating the ethylene signalling response. This analysis shows that the above-proposed interaction is a candidate for explaining experimental observations.
This kind of analysis has been applied to all possible interactions between PLSp and the ethylene receptor. It was found that if PLS protein inhibits the conversion of Re* to Re, this interaction is equivalent to the interaction analysed above, and it is also a candidate for explaining experimental observations (see Supplementary information for details). Therefore, there are two qualitatively equivalent candidates for explaining experimental observations when PLSp interacts with the ethylene receptor. However, all other interactions with the receptor cannot lead to the results that agree with experimental observations. For example, these interactions include PLSp activating the conversion from Re* to Re; PLSp binding with Re* and forming another inactive state; or PLSp binding with Re and forming another inactive state. Therefore, these possibilities are discarded (see Supplementary information for further analysis).
Given that the PLS peptide has a predicted endoplasmic reticulum (ER) retention signal (Casson et al, 2002), consistent with the location of the ethylene-binding face of the ethylene receptor protein ETR1 (Chen et al, 2002), we favour a model in which PLSp interacts with the ethylene receptor, Figure 1.
Therefore, we have two candidates for the interaction between the PLS peptide and ethylene signalling module at or close to ETR1/the ethylene receptor: (a) PLSp activates the conversion of Re into Re* and (b) PLSp inhibits the conversion of Re* into Re. The two candidates qualitatively lead to the same experimental observations. To distinguish between the two candidates, further quantitative experiments are required to determine kinetic parameters for the two interactions. As the kinetic parameters for those interactions are unknown, it is not possible to distinguish the two candidates at this stage. However, two candidates for the interaction between PLSp and ethylene receptor lead to the same results: namely PLSp increases Re* (see Supplementary information for details). We study the network shown in Figure 1 in detail.
Dependence of PLS transcription on auxin and ethylene
Experimental observations show that auxin positively regulates PLS transcription (Casson et al, 2002) and ethylene negatively regulates PLS transcription (Chilley et al, 2006). It is also evident that ethylene can activate the biosynthesis of auxin locally (Stepanova et al, 2007; Swarup et al, 2007). In wild type, increase in ethylene level increases auxin synthesis and transport to the root elongation zone, which thereby inhibits root-length elongation. As ethylene activates the biosynthesis of auxin locally and auxin positively regulates PLS transcription, the negative regulation of ethylene on PLS transcription suggests that, in addition to the role of ethylene in the biosynthesis of auxin, ethylene must also regulate PLS transcription independently of auxin.
The auxin-mediated mechanism regulating PLS transcription is not well understood, though the PLS gene promoter contains auxin-response elements, suggesting ARF-mediated activation (Casson et al, 2002). From a modelling point of view, there are a number of ways to include the negative regulation of ethylene on PLS transcription. For example, ethylene may potentially lead to the conversion of the active auxin receptor to an inactive form, or may positively affect Aux/IAA interactions with ARF transcription factors (including those that may lead to transcriptional activation of the PLS gene), among other possibilities. Alternatively, other, currently unidentified, ethylene-regulated proteins may act as transcriptional repressors of PLS transcription. From a modelling point of view, these possibilities have the same effects. We assume for the purpose of simplicity that ethylene directly affects PLS transcription, ν6, independently of auxin regulation.
Rate equations and parameters
We have tested the applications of both mass–action kinetics and other types of kinetics (e.g. Michaelis–Menten kinetics), finding that different types of kinetics lead to similar results after parameter values are adjusted. Therefore, to reduce the number of parameters, we use mass–action kinetics wherever it is possible.
Some parameters relating to ethylene receptors and CTR1 (i.e. k10, k11, k14 and k15) were studied by Diaz and Alvarez-Buylla (2006), and we use the same parameter values for those rates as they did. Other parameters are unknown. Initially, all unknown parameters are set to be unity. Subsequently, a small number of parameters are adjusted as follows:
First, a relatively high ethylene signalling response inhibits the transport of auxin from the shoot to the root tip (Suttle, 1988; Chilley et al, 2006) and increases auxin removal from the root tip (Ruzicka et al, 2007; Swarup et al, 2007), and ethylene activates the biosynthesis of auxin locally (Stepanova et al, 2007; Swarup et al, 2007). Therefore, ethylene has a dual role in regulating endogenous auxin levels (i.e. through effects on auxin transport into and out of the root, and biosynthesis in the root). If ethylene effects on auxin transport dominate, the increase in endogenous ethylene decreases endogenous auxin in the root tip, through decreased import and increased export. However, if the effects on the biosynthesis of auxin are more dominant, increase in endogenous ethylene level increases endogenous auxin. Figure 2 shows the dependence of auxin concentration on exogenous 1-aminocyclopropane-1-carboxylic acid (ACC) concentration, which increases endogenous ethylene, for two different values of the rate constant for biosynthesis of auxin, k2a.
Figure 2.

Dependence of auxin concentration on exogenous ACC concentration for two different values of rate constant for auxin biosynthesis, k2a, shows that different values of rate constant, k2a, can result in opposite trends.
When k2a is small (0.02 s−1), increase in ACC concentration decreases auxin concentration. When k2a is large (2 s−1), increase in ACC concentration increases auxin. As different k2a values can lead to opposite trends, the choice of k2a values is important for modelling results. It is evident that in wild type (Stepanova et al, 2007; Swarup et al, 2007), increase in ACC concentration increases auxin concentration. Therefore, we choose k2a=2.8 s−1so that modelling results are in agreement with experimental observations.
Second, parameter values are further adjusted so that the auxin concentration in pls and in wild type is 0.14 and 0.23 μM, respectively, corresponding to experimental observations (Chilley et al, 2006). The set of parameters corresponding to wild type are listed in Supplementary information, and they are used to analyse the system throughout this study without further adjustment. In pls, k6=0 s−1. Numerical tests reveal that the model developed in this study (Figure 1 and parameters in Supplementary information) is able to establish a steady state within 50 s in general, when different initial conditions are applied (see Supplementary information for details). In the following text, all computational results are obtained at steady states.
Model predictions and experimental measurements
We used the model to examine mutants known to link the action of PLS to the crosstalk between auxin and ethylene. The model is able to reproduce quantitatively all relevant mutants available, as described in the following sections. Therefore, we consider that the model has properly included known molecular interactions and experimental evidence relating to the action of PLS. We describe here how we used the model to make predictions and design new experiments to investigate PLS function.
Model prediction and experimental measurements of endogenous cytokinin concentration are in agreement
It is known that auxin can negatively regulate cytokinin biosynthesis (Nordstrom et al, 2004). The accumulated level of cytokinin is simply described by the balance between its biosynthesis and its removal. To predict the action of PLS in cytokinin signalling, this pathway has been incorporated into the auxin–ethylene model discussed above.
Figure 3 predicts that increase in PLS transcription decreases the endogenous cytokinin concentration. It is predicted that in the pls mutant, endogenous cytokinin concentration is increased to 1.48-fold of that in wild type. To experimentally test this prediction, the concentrations of endogenous cytokinins were measured using GC-MS in both pls and wild-type seedlings.
Figure 3.

Model prediction for endogenous cytokinin concentration in wild type and PLS mutant is in agreement with experimental observations.
The analysis of whole seedlings at 10 days post-germination shows that the concentrations of ZMP, iPMP, ZR, Z7G and Z9G were significantly increased in pls compared with wild type (Table I). It can be seen that different cytokinins have significantly different fold changes. However, the general trend is that endogenous cytokinin levels in the pls mutant are significantly increased, with a median of the fold change being 1.42. This trend is qualitatively predicted by the model, reflecting that the model is able to analyse crosstalk between auxin, ethylene and cytokinins.
Table 1. Cytokinin content (ng/gFW) in wild-type and pls mutant seedlings.
| iPA | ZOG | ZROG | DHZR | iP | Z | iPMP | ZR | Z7G | Z9G | ZMP | DHZ | |
|---|---|---|---|---|---|---|---|---|---|---|---|---|
| DHZ, dihydrozeatin; DHZR, dihydrozeatin riboside; iP, isopentenyladenine; iPMP, isopentenyladenine-5′-monophosphate; Z, zeatin; Z7G, zeatin-7-glucoside; Z9G, zeatin-9-glucoside; ZMP, zeatin riboside-5-monophosphate; ZOG, zeatin-O-glucoside; ZR, zeatin riboside; ZROG, zeatin riboside-O-glucoside. | ||||||||||||
| s.d. represents the standard deviation of the means of five independent biological replicate assays. pls/wt represents the ratio of cytokinin content in the pls vs wild-type seedling. | ||||||||||||
| wt | 0.80 | 6.80 | 1.65 | 0.18 | 0.14 | 0.24 | 9.93 | 4.33 | 21.79 | 8.06 | 13.68 | ND |
| s.d. | 0.18 | 0.43 | 0.11 | 0.02 | 0.02 | 0.05 | 1.47 | 0.31 | 2.02 | 0.83 | 1.83 | |
| pls | 0.72 | 7.14 | 1.92 | 0.21 | 0.18 | 0.34 | 14.94 | 7.50 | 38.16 | 14.86 | 47.30 | ND |
| s.d. | 0.11 | 1.57 | 0.40 | 0.02 | 0.02 | 0.06 | 2.73 | 0.85 | 4.75 | 2.94 | 5.04 | |
| pls/wt | 0.90 | 1.05 | 1.16 | 1.17 | 1.29 | 1.42 | 1.50 | 1.74 | 1.75 | 1.84 | 3.46 | |
In addition, on the basis of our model (Figure 1), one prediction on the interplay between cytokinin, auxin, ethylene and PLS is that the role of cytokinin in regulating PLS transcription is mediated through the ethylene and auxin pathways. Specifically, as cytokinin negatively regulates the biosynthesis of auxin and positively regulates ethylene biosynthesis, increase in endogenous cytokinin concentration decreases endogenous auxin concentration and increases endogenous ethylene concentration simultaneously. Moreover, on the basis of experimental observations that auxin positively regulates PLS transcription (Casson et al, 2002) and ethylene negatively regulates PLS transcription (Chilley et al, 2006) and as summarised in our model (Figure 1), cytokinin should negatively regulate PLS transcription. Our experiments (Figure 5A in Casson et al, 2002) have previously shown that cytokinin indeed negatively regulates PLS transcription in the presence of 10 μM kinetin, a cytokinin. Therefore, our model (Figure 1) is consistent with all available experimental evidence for the control of PLS transcription by cytokinin, auxin and ethylene.
Discrepancy in auxin concentration in pls between modelling and experimental results reveals a role of PLS in auxin biosynthesis
Figure 4A predicts that the exogenous application of ACC to wt, pls and PLSox seedlings would lead to an increased concentration of endogenous auxin. It has been experimentally shown that for wild type, endogenous auxin concentration increases with exogenously applying ACC (Stepanova et al, 2007; Swarup et al, 2007). Therefore, the model has correctly predicted this trend for wild-type plants.
Figure 4.

Discrepancy of auxin concentration in pls between modelling and experimental results reveals a role of PLS in auxin biosynthesis (see text for details). (A) Model prediction of auxin concentration in pls, wt and PLSox in response to the application of the ethylene precursor ACC; (B) Experimental demonstration that ACC induces auxin response in wild-type root tips (revealed as DR5∷GFP expression; upper two panels), but the pls mutant shows no DR5∷GFP induction by ACC (lower two panels). The pls mutant (lower left panel) also shows a reduced DR5∷GFP signal compared with wild type (upper left panel) in the absence of ACC treatment, consistent with an experimentally lower auxin concentration in the root tip (Chilley et al, 2006).
To experimentally test the prediction in Figure 4A, the auxin response of the pls mutant to exogenous ACC application was investigated. A DR5∷GFP reporter, which monitors auxin concentration/response (Sabatini et al, 1999), was introduced into the pls mutant and, for comparison, wild-type plants and seedlings were grown in the presence of 10 μM ACC for 5 days before analysis.
The results show that, as expected (Ruzicka et al, 2007; Swarup et al, 2007), ACC treatment led to an increased DR5 signal in the wild-type root tip (Figure 4B). However, for pls, the DR5∷GFP signal did not increase after ACC treatment. This result is in conflict to the model prediction. This discrepancy indicates that PLS must be required for correct DR5∷GFP activation by ACC/ethylene, suggesting an additional role for PLS in regulating either ethylene-induced auxin biosynthesis, auxin accumulation or auxin responsiveness (perception or signal transduction), which was not included in the model.
The model was therefore modified, taking into account the following considerations: when ACC is exogenously applied, the trend for the change in endogenous auxin concentration/response for pls (Figure 4B) and wild-type is opposite. Equation (4) shows the dependence of endogenous auxin concentration/response on endogenous ethylene concentration, which increases when ACC is exogenously applied.
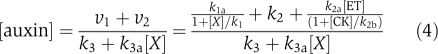 |
In wild type, increase in exogenous ACC availability increases the downstream response component, X, and decreases the transport rate of auxin to the root, ν1. To increase the endogenous auxin concentration in wild type relative to that for [ACC]=0 in wild type, ν2 must increase in such a way that the effect of both increases in X and decreases in ν1 is more than compensated by the increased ν2. This requires the rate constant for biosynthesis of auxin to be large, as analysed in section A (Figure 2).
In pls, [PLSp]=0. X is approximately a constant when exogenous ACC increases. Following ν1=k1a/(1+[X]/k1), ν1 is approximately a constant as well. In the pls mutant, therefore, neither X nor ν1 has a significant role in reducing auxin concentration or response. We can eliminate the latter possibility because we have previously demonstrated that the pls mutant is able to respond to auxin, even at very low (pM) concentrations (Casson et al, 2002). Therefore, as ACC concentration increases, the accumulated auxin concentration in pls relative to that for [ACC]=0 in pls will increase due to increase in ν2; increase in ν2 is to such an extent that auxin concentration in wild type also increases. Numerical calculations have also confirmed that the trend between endogenous auxin concentration and ACC for both wild type and pls cannot be opposite for a wide range parameter values tested. Therefore, the biosynthesis rate of auxin has to be modified to accommodate experimental results for wild type and pls, respectively.
To accommodate the experimental results for wild type and pls, ν2 should have the following property: for a fixed ethylene concentration, decreasing PLS expression should decrease ν2. Therefore, PLS needs to have a role in both auxin biosynthesis and transport (contributing to accumulated auxin levels). Accordingly, we modify ν2 into
Equation (5) describes the case in which ethylene, cytokinin and PLSp simultaneously act on a single pathway for auxin biosynthesis. In the Supplementary information, different types of kinetics and their relation to different reaction schemes for auxin biosynthesis are examined in detail. After incorporating Equation (5) into the model, parameters for the accumulation of auxin are adjusted so that for pls, the endogenous auxin concentration is 0.14 μM. Due to the regulation of auxin biosynthesis by PLS, the modified model predicts that auxin concentration increases more quickly with increased PLS transcription, k6. Therefore, wild type and PLSox correspond to k6=0.3 s−1and k6=0.45 s−1, respectively. The new parameters are: k2c=0.01 μM; k2=0.2 μM s−1. The k2 value reflects that, for pls ([PLSp]=0 μM), there is a background biosynthesis rate for auxin. All other parameters are the same as described in the Supplementary information. The modified model predicts the trend of endogenous cytokinin concentration exactly as shown in Figure 3.
Relationship between PLS and auxin and ethylene signalling
Role of PLS in regulating auxin concentration and response in the root
Auxin accumulation in the root derives from two sources: auxin transport from shoot to root and auxin biosynthesis locally at root tip. The rate of removal of active auxin, by transport out of the root or by degradation/conjugation, potentially also affects the concentration in the root tip.
In Figure 5A, we model the effects of both PLS transcription, k6, and the ethylene response through its receptor-signalling pathway, k11. k11 can be reduced experimentally by genetic or pharmacological inhibition of ethylene signalling (Chilley et al, 2006). Model analysis predicts that interaction of the PLS peptide with the ethylene signalling pathway can flexibly regulate auxin concentration and response. If PLS is not expressed (pls), the regulation of auxin concentration and its response by the interaction between ethylene and its receptors is less flexible. When k11 changes in the range of 0.1–10 μM−1 s−1 (for wt, k11=5 μM−1 s−1), the change in auxin concentration is less than 0.1% (Figure 5A). To change the auxin concentration markedly, k11 needs to be reduced to 0.01 μM−1 s−1. However, the prediction described in Figure 5A is that if PLS is expressed (in wild type or PLSox seedlings), changing k11 provides more flexibility in the regulation of auxin concentration/response. In addition, the interaction between PLS and ethylene signalling provides the system with an enhanced capability to regulate auxin concentration, by changing either PLS expression, ethylene signalling or both.
Figure 5.

PLS-mediated control of auxin concentration. (A) Effects of both PLS transcription and interaction of ethylene with its receptor on auxin concentration; (B) effects of both exogenous ACC and PLS transcription on auxin concentration. In pls mutant, auxin concentration decreases from 0.14 to 0.12 μM as exogenous ACC concentration increases from 0 to 10 μM. (C) Effects of both exogenous ACC and PLS transcription on auxin transport and biosynthesis; (D) effects of both PLS transcription and interaction of ethylene with its receptor on auxin transport and biosynthesis; (E) effects of PLS transcription on endogenous ethylene concentration; (F) filled bar: modelling results; unfilled bar: experimental measurements (Chilley et al, 2006). wt: k6=0.3 s−1; k11=5 μM−1 s−1; pls: k6=0.0 s−1; k11=5 μM−1 s−1. pls etr1-1: k6=0.0 s−1; k11=0.03 μM−1 s−1. PLSox: k6=1.0 s−1; k11=5 μM−1 s−1. PLSox ETR1-1ox: k6=0.45 s−1; k11=10 μM−1 s−1. PLSox etr1-1: k6=0.45 s−1; k11=0.03 μM−1 s−1. (G) Analysis of the effects of both CTR1 and PLS transcription. Auxin concentration for total CTR1 concentration to be 0.3 μM (wt) is also included for comparison.
Figure 5B predicts that increase in exogenous ACC concentration leads to an increase in endogenous auxin concentration and response in wild type, and that in pls, increase in ACC decreases auxin concentration. The prediction of Figure 5B is in agreement with experimental observations (Figure 4B), as experimental analysis in Figure 4B shows that wild-type seedlings expressing PLS show a strong induction of DR5∷GFP, whereas pls mutant shows no induction of DR5∷GFP signal by ACC. Therefore, the combined modelling and experimental analysis demonstrates PLS is required for the accumulation of auxin in the root tip in response to ACC/ethylene. In addition, Figure 5C predicts that, in the pls mutant, exogenous ACC fails to promote both auxin transport into, and auxin accumulation in, the root (auxin biosynthesis contributes 44% of accumulated auxin levels).
Our model therefore predicts that, in wild type, as ACC increases, the auxin biosynthetic rate increases and the rate of auxin transport into the root decreases; though PIN2 and auxin removal will increase. At a steady state, the effects of ACC in wild type are to increase auxin concentration, as observed experimentally (Stepanova et al, 2007; Swarup et al, 2007). For [ACC]=0.5 μM, the rate of auxin biosynthesis contributes 75% to the rate of auxin accumulation in wild type. In PLSox, ACC is predicted to have a similar effect. As the rates of both auxin transport and auxin biosynthesis are also affected by k6, Figure 5C clearly shows the dual roles of both k6 and ACC in auxin transport and auxin biosynthesis.
Figure 5D shows that when k11=0 μM−1 s−1 (i.e. when the ethylene response through its receptor is zero), auxin transport to the tip is more important than auxin biosynthesis in determining auxin concentration (auxin biosynthesis contributes 35% for k6=0.3 s−1, wild type). Moreover, when k6, the transcription rate constant of PLS, increases, the rate of auxin transport remains unchanged, although the rate of auxin biosynthesis increases (auxin biosynthesis contributes 20% for k6=0 s−1 (pls) and 37% for k6=0.45 s−1 (PLSox), respectively). Therefore, the increase in auxin concentration after an increase in PLS transcription (k6) is predicted to be due to an increase in auxin biosynthesis. As k11 increases (in which case the ethylene response through its receptor is more active), auxin transport becomes less important (auxin biosynthesis contributes 55% in wt, k6=0.3 s−1 and k11=5 μM−1 s−1). As a result, the rate of auxin biosynthesis provides a more important contribution to auxin concentration. Moreover, increase in k6 increases auxin biosynthesis that is also controlled by ethylene and cytokinin. Experimentally, it has been shown that PLS transcription does not affect ethylene biosynthesis (Chilley et al, 2006), and this result is confirmed by simulation (Figure 5E). Therefore, increase in the rate of auxin biosynthesis is predicted to be associated with PLS-induced decrease in cytokinin concentration. In addition, increase in k6 also increases the auxin transport rate to the root, reflecting the negative effect of PLS on ethylene signalling (Chilley et al, 2006). Thus, for k11≠0 μM−1 s−1 (in which case the ethylene response through its receptor is active), increase in auxin concentration by increase in k6 is modelled to be due to the increase in both auxin biosynthesis and auxin transport.
The above analysis reveals that PLS exerts a control on how ethylene regulates auxin concentration at the root tip, by separately affecting auxin transport (in and out of the root) and auxin biosynthesis. It is clear that, although PLS interacts with ethylene signalling to regulate auxin concentration, it does not affect ethylene concentration (Figure 5E), as also evidenced by experiments (Chilley et al, 2006).
Known mutants relating to the interactions between k6 and k11 can be analysed on the basis of Figure 5A, and Figure 5F shows some examples. The model is able to successfully reproduce three genotypes analysed by us previously (Chilley et al, 2006), namely pls, the pls etr1-1 double mutant and the PLS overexpressing transgenic, PLSox. The model also predicts that for a PLSox ETR1-1ox genotype, auxin concentration should be similar to that in wild type. However, a PLSox etr1-1 seedling would exhibit an increase in auxin concentration of 138% compared with the wild type. Chilley et al (2006) showed that auxin transport to, and accumulation in, the root are defective in pls. Similarly, the defective transport of auxin in pls is predicted using the model and agrees well with experimental observations (Figure 5D, the results for k11=5 μM−1 s−1).
The relationship between CTR1 and PLS is analysed in Figure 5G. It is shown that, in a ctr1 mutant background, increase in the level of PLS transcription (k6) does not change the rate of auxin transport, but still increases the rate of auxin biosynthesis. As a result, auxin concentration in the root is predicted to increase as k6 increases. The predicted auxin concentration for PLSox/ctr1 is higher than that for pls, but lower than PLSox. For auxin concentrations of less than 0.256 μM (corresponding to the auxin concentration for PLSox), increase in auxin concentration increases root length (see Supplementary Figure S6 for details). Therefore, although PLSox increases root length compared with the pls mutant, or to a lesser extent, wild type, the PLSox/ctr1 combination results in a much shorter root length than that in PLSox, but which is longer than that in the ctr1 mutant. This demonstrates that the model, which assumes that the PLS peptide acts on the ethylene receptor, is able to experimentally explain observed results for the light-grown seedlings of ctr1 and PLSox/ctr1 mutants (Chilley et al, 2006). The modelling and experimental analysis for the relationship between CTR1 and PLS further confirms that component(s) downstream of ethylene signalling regulate auxin transport, and that PLS also regulates auxin biosynthesis.
Moreover, Figure 5G predicts that the change in auxin concentration (and therefore root length, see Supplementary information for details) for ctr1, when in a PLSOx background, is solely due to the change in the rate of auxin biosynthesis. To investigate this possibility experimentally, we grew ctr1 seedlings for 5 days in the presence or absence of exogenous auxin (5 μM NAA), and observed that the root length of ctr1 increased in the presence of auxin (Figure 6). This is consistent with the model prediction that the longer root in the ctr1 PLSOx seedlings is due to increased auxin accumulation compared with the ctr1 root.
Figure 6.

Primary root length of the ctr1 mutant is increased by exogenous auxin (NAA). Roots of ctr1 mutant seedlings (5 d.a.g.) grown on 0.05 μM NAA are longer than when grown on 1/2 MS10. Bars represent s.e.m. values, n=15.
The above analysis shows that the mathematical model develops new insights into how PLS regulates auxin concentration by controlling the relative contribution of auxin transport and biosynthesis. Mutants can be reproduced and predicted. Experimental results describing the relationship between auxin concentration, exogenously applied ACC and the inhibition of ethylene responses can be understood in terms of their effects on the relative contribution of auxin transport and biosynthesis.
PLS expression and predictions on the response of the unknown molecule(s) X
The transcription of the PLS gene itself is regulated by both auxin and ethylene. Model analysis reveals that increase in exogenous auxin, which increases endogenous auxin concentration, increases PLS transcription (data not shown). This reflects the recognition that increase in auxin concentration increases the response of auxin signalling, and subsequently increases PLS expression (Casson et al, 2002). When ACC is exogenously applied, it also increases auxin concentration in wild type (Figure 5B), but it decreases PLS transcription (Figure 7). Model analysis shows that increase in ACC concentration increases both endogenous ethylene and the concentration of the activated form of auxin receptor, Ra*. Ethylene and Ra* contribute antagonistically to PLS expression, with the overall effect of increase in exogenous ACC is predicted to be the decrease of PLS expression (Figure 7). These trends qualitatively agree well with experimental observations (Casson et al, 2002; Chilley et al, 2006).
Figure 7.

Increase in ACC increases both endogenous ethylene and the concentration of the activated form of auxin receptor, Ra*. Ethylene and Ra* contribute antagonistically to PLS expression, with the overall effect of increase in exogenous ACC is predicted to be the decrease in PLS expression.
Although some components have been identified recently (Stepanova et al, 2008), the molecular basis for the interaction between the ethylene signalling response and the auxin response is not fully elucidated. A molecule or molecules, X, can be designated in the model as a module mediating the interaction. The model provides the opportunity to examine how the unknown molecule(s) X behave when exogenous auxin and ethylene concentrations change. Figure 8 shows that, when the exogenous ethylene concentration increases, the concentration of X initially increases rapidly, then approaches a constant value. However, when the exogenous auxin concentration increases, X initially decreases rapidly and then approaches a constant value. The trend analysis for X may be of use for searching for the candidate molecules that interact downstream of ethylene signalling to positively regulate the auxin response.
Figure 8.

Prediction of response of unknown molecule, X, to exogenous ACC (A) and auxin (B) shows response of X to exogenous ACC and auxin follows opposite trends.
In addition, changes in root growth rate in response to exogenously applied hormones can be understood and predicted by combining modelling and experimental analysis (see Supplementary information for details).
Modelling and experimental analysis reveals a hormonal crosstalk circuit in Arabidopsis
The modelling and experimental analysis as described above reveals a hormonal crosstalk circuit in Arabidopsis, as summarised in Figure 9.
Figure 9.

The hormonal crosstalk circuit revealed by modelling and experimental analysis in Arabidopsis.
Figure 9 shows that auxin, ethylene and cytokinin forms a tangled network that regulates their endogenous level; and PLS and unknown molecule(s), X, downstream of ethylene signalling, have roles in hormonal crosstalk. All known mutants can be understood using this crosstalk and can be quantified using the detailed interactions shown in Figure 1. Both Figures 1 and 9 provide a platform to further develop hormonal crosstalk circuit in Arabidopsis.
The current model concentrates on the study of the regulatory network for hormonal crosstalk. It is a single-cell model applied to root development. Therefore, the spatial distribution of hormones in the root cannot be addressed by the current model. However, on the basis of this model, by further including the spatial location of genes and by linking the fluxes described in this model with spatial location of those genes, a dynamic hormonal crosstalk model in spatial settings can be developed. Such a model should be able to develop insight into how hormonal interplay depends on the spatial expression of genes. It has been shown that model development in a spatial setting is able to understand auxin distribution in root development (Grieneisen et al, 2007).
Discussion
Plant growth and development rely on appropriate signalling systems mediated by multiple hormones. We have, to the best of our knowledge, presented the first quantitative model to analyse the crosstalk between auxin, ethylene and cytokinin through the action of the PLS gene in Arabidopsis. We have then combined a modelling analysis with new experimental measurements based on predictions from the model. This combined approach has provided new insight into how PLS regulates auxin concentration in the root, by controlling the relative contribution of auxin transport into and out of the root and auxin biosynthesis in the root, and by integrating auxin, ethylene and cytokinin signalling.
Modelling and experimental analysis have revealed a hormonal crosstalk circuit in Arabidopsis (Figure 9). Moreover, model analysis reveals an interesting strategy for PLS in regulating hormonal crosstalk. The PLS protein confers flexibility on the regulation of endogenous auxin concentration by ethylene signalling (Figure 5A). According to the model, auxin concentration can be regulated by either the interaction of ethylene with its receptor, by PLS expression or both. As PLS expression itself is regulated by auxin, a regulatory loop between auxin, ethylene and PLS is formed through PLS. This loop flexibly regulates the endogenous auxin concentration/response that is to a significant extent responsible for root growth and development (Grieneisen et al, 2007).
Thus model analysis reveals that PLS exerts a control on how ethylene controls auxin concentration at the root tip by independently affecting auxin transport and auxin biosynthesis. On the one hand, increase in ethylene responses promotes auxin biosynthesis and inhibits PLS expression that also enhances auxin biosynthesis. However, increase in ethylene inhibits auxin transport into the root, and enhances auxin transport out, mediated by the action of PLS. If PLS is not expressed, ethylene no longer affects auxin transport and biosynthesis. Interestingly, due to the action of PLS, the dependence of auxin concentration on ethylene signalling can be flexible: auxin concentration may increase or decrease as ethylene responses increase, depending on parameters related to auxin biosynthesis and transport. Figure 2 shows that if the parameter for controlling auxin biosynthesis (the rate constant) is large, increase in ethylene signalling increases the auxin concentration as experimentally observed (Ruzicka et al, 2007; Swarup et al, 2007; Stepanova et al, 2007, 2008). However, if the parameter for controlling auxin biosynthesis is small, increase in ethylene signalling decreases auxin concentration. Figure 5C clearly shows that, when the parameter for controlling auxin biosynthesis is large and PLS is expressed, increase in auxin concentration occurs because increase in the auxin biosynthetic rate overtakes the decrease in auxin transport rate. Similarly, model analysis reveals that, when the parameter for controlling auxin biosynthesis is small, the decrease in auxin concentration is because increase in auxin biosynthesis rate cannot compensate for the decrease in auxin transport rate (data not shown). It is clear that the model is able to develop new insights into how PLS exerts controls on how ethylene affects auxin transport and auxin biosynthesis, and therefore controls auxin concentration at root tip.
The PLS protein is also predicted by the model to not to affect the endogenous concentration of ethylene (Figure 5E), although it affects ethylene signalling. This is in agreement with experimental evidence (Chilley et al, 2006). Therefore, modelling and experimental data suggest that PLS has a direct role in the transduction of ethylene signalling, rather than directly regulating the biosynthesis of ethylene. Our study also supports the view that auxin concentration is directly linked with the control of root length (Grieneisen et al, 2007).
On the basis of the model structure of Figure 1, the possible relationships between auxin biosynthesis pathway(s) and PLS-regulated hormonal crosstalk can be analysed. As shown in the Supplementary information, although the molecular basis for auxin biosynthesis is largely unknown, the regulation by PLSp of auxin biosynthesis must be realised through its compounded effects with ethylene and cytokinin: PLSp cannot regulate auxin biosynthesis independently of the regulation of ethylene and cytokinin. This demonstrates that different structures of this model may have different auxin concentration responses, revealing that the current combined modelling and experimental analysis is a powerful tool for dissecting the causal relationship for the interactions between genes and hormonal crosstalk.
Integration of biological knowledge into a mathematical model opens many channels to study the dynamics of a system with multiple hormonal signals. The current model concentrates on the action of the PLS gene product on crosstalk between auxin, ethylene and cytokinin. It clearly demonstrates that model analysis is able to explore how a cell perceives and transduces hormonal signals. Future model developments will include additional genes and analyse the role of gene–gene interactions in hormonal signalling. Moreover, development of a spatio-temporal model is able to assess how spatial-temporal dynamics of hormones and genes control plant development. Furthermore, in a changing environment, concentrations of hormones can be time dependent. How environment-dependent hormone concentrations affect plant growth and development can be assessed using a combination of mathematical modelling and experimentation.
Materials and methods
Modelling
The model is implemented in two simulators (COPASI (Hoops et al, 2006) and Berkeley Madonna (www.berkeleymadonna.com)). All computational results are exactly the same for both repositories. In COPASI repository, Deterministic (LSODA) method is used with an absolute tolerance of 1.0E12. In Berkeley Madonna, Rosenbrock (Stiff) method is used with a tolerance of 1.0E−10. Codes on both repositories can be made available on request (Junli.liu@durham.ac.uk). The system is able to establish a steady state within 50 s in general (See Supplementary information for details). When different mutants are analysed, we compare the steady-state results.
Growth and hormonal treatment of seedlings
The pls and pls etr1 mutants of Arabidopsis thaliana have been described previously (Topping and Lindsey, 1997; Casson et al, 2002; Chilley et al, 2006). The pls aux1 double mutant was generated by genetic crossing the pls promoter trap line with aux1-7, a kind gift of Professor Malcolm Bennett (University of Nottingham). pls DR5∷GFP seedlings were also generated by crossing. In each case, F2 seedlings were analysed. For in vitro growth studies, seeds were stratified, surface-sterilized and plated on growth medium (half-strength Murashige and Skoog medium (Sigma, Poole, UK), 1% sucrose and 2.5% phytagel (Sigma) at 22±2°C as described (Casson et al, 2009). For hormone application experiments, seeds were germinated aseptically on growth medium or growth medium containing hormones, as specified for each experiment. Cytokinin concentrations were determined by mass spectrometry according to Nordstrom et al (2004).
Microscopy
Confocal images were taken with a Bio-Rad Radiance 2000 microscope (Bio-Rad, Hemel Hempstead, UK) after counterstaining tissues with 10 mg/ml propidium iodide as described previously (Casson et al, 2009).
Supplementary Material
Acknowledgments
JL and KL gratefully acknowledge Research Councils UK and the Biotechnology and Biological Sciences Research Council for funding in support of this study. We also thank Professor Göran Sandberg (Umea) for support with cytokinin assays.
Footnotes
The authors declare that they have no conflict of interest.
References
- Bardwell L, Zou XF, Nie Q, Komarova NL (2007) Mathematical models of specificity in cell signaling. Biophys J 92: 3425–3441 [DOI] [PMC free article] [PubMed] [Google Scholar]
- Bennett MJ, Marchant A, Green HG, May ST, Ward SP, Millner PA, Walker AR, Schulz B, Feldmann KA (1996) Arabidopsis AUX1 gene: a permease-like regulator of root gravitropism. Science 273: 948–950 [DOI] [PubMed] [Google Scholar]
- Casson SA, Chilley PM, Topping JF, Evans IM, Souter MA, Lindsey K (2002) The POLARIS gene of Arabidopsis encodes a predicted peptide required for correct root growth and leaf vascular patterning. Plant Cell 14: 1705–1721 [DOI] [PMC free article] [PubMed] [Google Scholar]
- Casson SA, Lindsey K (2003) Genes and signalling in root development. New Phyt 158: 11–38 [Google Scholar]
- Casson SA, Topping JF, Lindsey K (2009) MERISTEM-DEFECTIVE, an RS domain protein, is required for meristem patterning and function in Arabidopsis. Plant J 57: 857–869 [DOI] [PubMed] [Google Scholar]
- Chen YF, Randlett MD, Findell JL, Schaller GE (2002) Localization of the ethylene receptor ETR1 to the endoplasmic reticulum of Arabidopsis. J Biol Chem 277: 19861–19866 [DOI] [PubMed] [Google Scholar]
- Chilley PM, Casson SA, Tarkowski P, Wang KLC, Hawkins N, Hussey PJ, Beale M, Ecker JR, Sandberg GK, Lindsey K (2006) The POLARIS peptide of Arabidopsis regulates auxin transport and root growth via effects on ethylene signaling. Plant Cell 18: 3058–3072 [DOI] [PMC free article] [PubMed] [Google Scholar]
- Coenen C, Christian M, Luthen H, Lomax TL (2003) Cytokinin inhibits a subset of Diageotropica-dependent primary auxin responses in tomato. Plant Physiol 131: 1692–1704 [DOI] [PMC free article] [PubMed] [Google Scholar]
- Diaz J, Alvarez-Buylla E (2006) A model of the ethylene signalling pathway and its gene response in Arabidopsis thaliana: pathway cross-talk and noise-filtering properties. Chaos 16: 02311201–02311216 [DOI] [PubMed] [Google Scholar]
- Eklof S, Astot C, Blackwell J, Moritz T, Olsson O, Sandberg G (1997) Auxin–cytokinin interactions in transgenic tobacco. Plant Cell Physiol 38: 225–235 [Google Scholar]
- Geislera M, Murphy AS (2006) The ABC of auxin transport: the role of p-glycoproteins in plant development. FEBS Lett 580: 1094–1102 [DOI] [PubMed] [Google Scholar]
- Grieneisen VA, Xu J, Marée AFM, Hogeweg P, Scheres B (2007) Auxin transport is sufficient to generate a maximum and gradient guiding root growth. Nature 449: 1008–1013 [DOI] [PubMed] [Google Scholar]
- Hoops S, Sahle S, Gauges R, Lee C, Pahle J, Simus N, Singhal M, Xu L, Mendes P, Kummer U (2006) COPASI—a COmplex PAthway Simulator. Bioinformatics 22: 3067–3074 [DOI] [PubMed] [Google Scholar]
- Komarova NL, Zou XF, Nie Q, Bardwell L (2005) A theoretical framework for specificity in cell signaling. Mol Syst Biol 1: 2005.0023 ; DOI: 10.1038/msb4100031 [DOI] [PMC free article] [PubMed] [Google Scholar]
- LeClere S, Tellez R, Rampey RA, Matsuda SPT, Bartel B (2002) Characterization of a family of IAA-amino acid conjugate hydrolases from Arabidopsis. J Biol Chem 277: 20446–20452 [DOI] [PubMed] [Google Scholar]
- Ljung K, Bhalerao RP, Sandberg G (2001) Sites and homeostatic control of auxin biosynthesis in Arabidopsis during vegetative growth. Plant J 28: 465–474 [DOI] [PubMed] [Google Scholar]
- Nordstrom A, Tarkowski P, Tarkowska D, Norbaek R, Astot C, Dolezal K, Sandberg G (2004) Auxin regulation of cytokinin biosynthesis in Arabidopsis thaliana: a factor of potential importance for auxin–cytokinin-regulated development. Proc Natl Acad Sci USA 101: 8039–8044 [DOI] [PMC free article] [PubMed] [Google Scholar]
- Petrasek J, Mravec J, Bouchard R, Blakeslee JJ, Abas M, Seifertova D, Wisniewska J, Tadele Z, Kubes M, Covanova M, Dhonukshe P, Skupa P, Benkova E, Perry L, Krecek P, Lee OR, Fink GR, Geisler M, Murphy AS, Luschnig C et al. (2006) PIN proteins perform a rate-limiting function in cellular auxin efflux. Science 312: 914–918 [DOI] [PubMed] [Google Scholar]
- Qin GJ, Gu HY, Zhao YD, Ma ZQ, Shi GL, Yang Y, Pichersky E, Chen HD, Liu MH, Chen ZL, Qu LJ (2005) An indole-3-acetic acid carboxyl methyltransferase regulates Arabidopsis leaf development. Plant Cell 17: 2693–2704 [DOI] [PMC free article] [PubMed] [Google Scholar]
- Roman G, Lubarsky B, Kieber JJ, Rothenberg M, Ecker JR (1995) Genetic analysis of ethylene signal transduction in Arabidopsis thaliana: five novel mutant loci integrated into a stress response pathway. Genetics 139: 1393–1409 [DOI] [PMC free article] [PubMed] [Google Scholar]
- Ruzicka K, Ljung K, Vanneste S, Podhorska R, Beeckman T, Friml J, Benkova E (2007) Ethylene regulates root growth through effects on auxin biosynthesis and transport-dependent auxin distribution. Plant Cell 19: 2197–2212 [DOI] [PMC free article] [PubMed] [Google Scholar]
- Sabatini S, Beis D, Wolkenfelt H, Murfett J, Guilfoyle T, Malamy J, Benfey P, Leyser O, Bechtold N, Weisbeek P, Scheres B (1999) An auxin-dependent distal organizer of pattern and polarity in the Arabidopsis root. Cell 99: 463–472 [DOI] [PubMed] [Google Scholar]
- Schaber J, Kofahl B, Kowald A, Klipp E (2006) A modelling approach to quantify dynamic cross-talk between the pheromone and the starvation pathway in baker's yeast. FEBS J 273: 3520–3533 [DOI] [PubMed] [Google Scholar]
- Stepanova AN, Hoyt JM, Hamilton AA, Alonso JM (2005) A link between ethylene and auxin uncovered by the characterization of two root specific ethylene-insensitive mutants in Arabidopsis. Plant Cell 17: 2230–2242 [DOI] [PMC free article] [PubMed] [Google Scholar]
- Stepanova AN, Jun J, Likhacheva AV, Alonso JM (2007) Multilevel interactions between ethylene and auxin in Arabidopsis roots. Plant Cell 19: 2169–2185 [DOI] [PMC free article] [PubMed] [Google Scholar]
- Stepanova AN, Robertson-Hoyt J, Yun J, Benavente LM, Xie DY, Dolezal K, Schlereth A, Jurgens G, Alonso JM (2008) TAA1-mediated auxin biosynthesis is essential for hormone crosstalk and plant development. Cell 133: 177–191 [DOI] [PubMed] [Google Scholar]
- Suttle JC (1988) Effect of ethylene treatment on polar IAA transport, net IAA uptake and specific binding of N-1-naphthylphthalamicacid in tissues and microsomes isolated from etiolated pea epicotyls. Plant Physiol 88: 795–799 [DOI] [PMC free article] [PubMed] [Google Scholar]
- Swarup R, Perry P, Hagenbeek D, Van Der Straeten D, Beemster GTS, Sandberg G, Bhalerao R, Ljung K, Bennett MJ (2007) Ethylene upregulates auxin biosynthesis in Arabidopsis seedlings to enhance inhibition of root cell elongation. Plant Cell 19: 2186–2196 [DOI] [PMC free article] [PubMed] [Google Scholar]
- Tanimoto M, Roberts K, Dolan L (1995) Ethylene is a positive regulator of root-hair development in Arabidopsis thaliana. Plant J 8: 943–948 [DOI] [PubMed] [Google Scholar]
- Topping JF, Lindsey K (1997) Promoter trap markers differentiate structural and positional components of polar development in Arabidopsis. Plant Cell 9: 1713–1725 [DOI] [PMC free article] [PubMed] [Google Scholar]
- Vogel JP, Woeste KE, Theologis A, Kieber JJ (1998) Recessive and dominant mutations in the ethylene biosynthetic gene ACS5 of Arabidopsis confer cytokinin insensitivity and ethylene overproduction, respectively. Proc Natl Acad Sci USA 95: 4766–4771 [DOI] [PMC free article] [PubMed] [Google Scholar]
- Zou X, Peng T, Pan Z (2008) Modeling specificity in the yeast MAPK signalling networks. J Theo Biol 250: 139–155 [DOI] [PubMed] [Google Scholar]
Associated Data
This section collects any data citations, data availability statements, or supplementary materials included in this article.