

Abstract
Several novel genes that are up regulated in the kidney in diabetes have been identified including GREM1, which encodes gremlin 1. GREM1 maps to human chromosome 15q12, a region previously found to be linked to albumin to creatinine ratio (ACR) in Mexican Americans. The objective of this study is to investigate whether genetic variants in GREM1, a positional candidate gene, contribute to variation in ACR. By sequencing 32 individuals for both exons and 2 kb putative promoter region of GREM1, we identified 19 genetic variants including 5 in the promoter region and 13 in the 3′UTR. Of 19 polymorphisms identified, 13 polymorphisms were genotyped in the entire cohort (N=670; 39 large families) either by restriction fragment length polymorphism or by TaqMan Assays. Association analyses between the genotypes and ACR, type 2 diabetes and related phenotypes were carried out using a measured genotype approach as implemented in the variance component analytical tools (SOLAR). Of the variants examined for association, none exhibited statistically significant association with ACR after accounting for the effects of covariates such as age, sex, diabetes, duration of diabetes, systolic blood pressure and anti-hypertensive medications. However, two novel variants at the 3′ UTR showed significant association with estimated glomerular filtration rate (P = 0.010 and P = 0.049) and body mass index (P = 0.013 and P = 0.019) after accounting for trait-specific covariate influences. Also, a novel variant located in the promoter exhibited a significant association with systolic (P = 0.038) and diastolic blood pressure (P = 0.005) after adjusting for the effects of age, sex, diabetes, and antihypertensive medications. In conclusion, the variants examined at GREM1 are not significant contributors to variation in ACR in Mexican Americans, although they appear to minimally influence risk factors related to ACR.
1. Introduction
Albuminuria is predictive of all-cause and cardiovascular morbidity and mortality in patients with diabetes or hypertension independent of traditional risk factors and in the general population [1]. The pathophysiologic mechanisms underlying the development of albuminuria are multifactorial. While, epidemiological data indicate that poor glycemic and blood pressure control are undoubtedly involved in the development of albuminuria, there is compelling evidence from twin and family studies that genetic factors make a major contribution to the development and progression of albuminuria [2]. However, the specific genes involved in susceptibility to albuminuria have yet to be identified. During the last decade, a significant amount of research has been devoted to identifying genes potentially involved in the etiology of this common complex trait.
A previous genome-wide linkage study in a subset of Mexican American participants in the San Antonio Family Diabetes/Gallbladder Study (SAFDGS) revealed suggestive evidence for linkage of albumin to creatinine ratio (ACR) to a genetic region on human chromosome 15q12 at the GABRB3 marker [3]. To elucidate the basis for the linkage of ACR in the Mexican Americans, we have previously investigated a positional candidate gene in the 15q12 chromosomal region [4]. This study extends such an effort to investigate another plausible positional candidate gene GREM1 for their association with ACR and its related phenotypes.
Gremlin 1, a member of cysteine knot protein family, regulates diverse processes including growth, differentiation and development, by antagonizing the activity of bone morphogenetic proteins (BMPs)-2, -4 and -7 [5]. The binding of gremlin to selective BMPs prevents ligand–receptor interaction and subsequent downstream signaling. A primary role for gremlin in kidney organogenesis recently demonstrated that Grem1-deficient mice die shortly after birth because of complete renal agenesis [6]. GREM1-mediated reduction of BMP4 activity in the mesenchyme around the nascent ureteric bud was shown to be essential to initiate ureteric bud outgrowth and invasion of the metanephric mesenchyme [7]. Gremlin 1 promotes vascular smooth muscle cell proliferation and migration (Maciel et al., 2008). Further, the recent finding that Gremlin expression is up regulated in experimental models of DN invitro and in-vivo coupled with its enhanced expression in response to TGF-β and its potential to interact with other important signaling pathways suggest that gremlin may play an important role in mediating some of the pathological effects of TGF-beta on mesangial cell proliferation and matrix production in the diabetic milieu [8].
GREM1 therefore represents a potential candidate gene for further analysis coupled with its localization on chromosome 15q12, a region previously linked with ACR. The aim of this study was to examine whether DNA polymorphisms in GREM1 contribute to variation in susceptibility to ACR and its correlated traits in Mexican Americans, a population at high risk for type 2 diabetes (T2DM) and its complications including diabetic nephropathy (DN).
2. Subjects and Methods
2.1 Subjects and Phenotypic data
The San Antonio Family Diabetes/Gallbladder Study (SAFDGS) family member’s recruitment and data collection procedures of about 700 participants from 39 large families were reported previously [9]. Briefly, probands were low income Mexican-Americans with T2DM, and all 1st, 2nd, and 3rd degree relatives of probands were invited to participate in the study. A variety of metabolic, hemodynamic, anthropometric, and demographic variables were collected at the General Clinical Research Center (GCRC) Laboratory at the South Texas Veterans Health Care System, Audie L. Murphy Memorial Hospital Division, San Antonio, Texas, using standard procedures. Blood samples were obtained after a 12-hour fast for assessment of various phenotypes including glucose, total cholesterol, triglycerides (TGL), and HDL cholesterol (HDL-C), and they were collected again 2 h after a standardized oral glucose load to measure plasma glucose. Measurement of all these phenotypes including body mass index (BMI) has been described elsewhere [9,10]. Diabetes status was defined by the 1999 criteria of the World Health Organization (i.e., fasting glucose levels ≥ 126 mg/dl and/or 2-hr glucose levels ≥ 200 mg/dl). Participants who did not meet these criteria but reported to be under treatment with either oral antidiabetic agents or insulin and who gave a history of diabetes were also considered to have T2DM.
Albumin to creatinine ratio (ACR), an index of urine albumin excretion rate, was estimated as described previously [4]. Study participant’s urine samples were randomly collected at one time. Urinary albumin excretion was estimated with an immunoturbidimetric method using the COBAS INTEGRA diagnostic reagent system that uses anti-albumin antibody specific to human albumin. Urine creatinine was measured using a kinetic alkaline picrate assay. The ratio of concentration of albumin (mg/dL) to creatinine (mg/dL) in random urine specimen (ACR) was used as an index of urinary albumin excretion (UAE). The ACR values approximate the numeric values of the corresponding albumin excretion rate measured in twenty-four hour urine collection and expressed in g/day. Albuminuria (micro or macro) was defined as an albumin (mg/dl) to creatinine (mg/dl) ratio (ACR) of ≥ 0.03, which is approximately equivalent to an UAE > 30 mg/day. Estimation of glomerular filtration rate (eGFR) using 4 variable Modification of Diet in Renal Disease (MDRD) formula has been previously described [11]. The quantitative traits values were log transformed for ACR (ln ACR) and triglycerides (ln TGL) and used in the association analyses since their raw data were non-normally distributed. The Institutional Review Board of the University of Texas Health Science Center at San Antonio approved all procedures, and all subjects gave informed consent.
2.2. Molecular variants identification and genotyping
The exons and 2 kb putative promoter region of GREM1 gene were PCR amplified and directly sequenced in 32 individulas for DNA sequence variants. DNA Sequencing was performed using ABI Prism Big Dye Terminator Cycle Sequencing kit (Applied Biosystems, Foster City, CA) and a capillary sequencer (Model 3730xl; Applied Biosystems). Human chromosome 15-specific somatic cell hybrid DNA (#NA11418; Coriell Cell Repositories, Camden, NJ) was used as a “hemizygous” non-polymorphic control representing a single allelic version of all variants on this chromosome. Genotyping of all the SNPs was performed either by Restriction Fragment Length Polymorphism (RFLP) assay or by TaqMan assay (Applied Biosystems), which was carried out on a GeneAmp PCR system 9700 (Applied Biosystems), and fluorescent signals were detected on an ABI PRISM 7700 sequence detector (Applied Biosystems). To assure accuracy of the genotyping, coded blind replicate samples from 50 subjects were included in each genotyping assay.
2.3. Statistical genetic analysis
The genotypic data were checked for Mendelian pedigree inconsistencies using the program INFER and GENTEST as implemented in PEDSYS. Allele frequencies were estimated using maximum likelihood techniques, which account for the pedigree structure. All polymorphisms were tested for Hardy–Weinberg Equilibrium. Linkage disequilibrium (LD) between SNPs was estimated using the r2 values. Association analysis in our family data was carried out using the measured genotype approach (MGA) within the variance components (VC) analytical framework. The VC-based approach accounts for the non-independence among family members. In this approach, VCs are modeled as random effects (e.g. additive genetic effects and random environmental effects), whereas the effects of measured covariates such as age and sex are modeled as fixed effects on the trait mean. The marker genotypes were incorporated in the mean effects model as a measured covariate, assuming additivity of allelic effects [12,13]. The effect of this measured genotype (i.e., association parameter) together with other covariate effects (e.g., age and sex) and VCs were estimated by maximum likelihood techniques. The hypothesis of no association is tested by comparing the likelihood of a model in which the effect of the measured genotype is estimated with a model where the effect of the measured genotype was fixed at zero. Twice the difference in the log-likelihoods of these models yields a test statistic that is asymptotically distributed, approximating a χ2 distribution with one degree of freedom. A p value ≤ 0.05 is considered significant. Prior to performing MGA, the quantitative transmission disequilibrium test (QTDT) was used to examine hidden population stratification [14]. All statistical techniques described above were implemented in the program SOLAR [13].
3. Results
The clinical characteristics of the genotyped individuals are shown in Table 1. Of the individuals genotyped, the phenotypic data varied from 610 subjects for total cholesterol to 670 subjects for age. Of the examined individuals from 39 families, 29%, 28%, and 14% of them had hypertension, T2DM, and albuminuria respectively. The eGFR data were available for only 453 subjects.
Table 1. Clinical characteristics of the genotyped SAFDGS participants used for the present study a.
| Phenotypes b | Mean ± SD or % |
|---|---|
| Sex (Females) | 61 |
| Type 2 diabetes | 28 |
| Hypertension | 29 |
| Albuminuria | 14 |
| Age (years) | 44.8 ± 16.2 |
| Systolic blood pressure (mm Hg) | 128.6 ± 18.2 |
| Diastolic blood pressure (mm Hg) | 71.3 ± 9.6 |
| Body mass index (kg/m2) | 30.9 ± 7.0 |
| Waist circumference (mm) | 1001.0 ± 170.6 |
| Total Cholesterol (mg/dl) | 194.0 ± 37.9 |
| High density lipoprotein-Cholesterol (mg/dl) | 46.0 ± 12.0 |
| ln Triglycerides | 4.9 ± 0.6 |
| GFR-MDRD (ml/min/1.73 m2) | 88.4 ± 17.9 |
| ln Albumin to creatinine ratio | 2.4 ± 0.8 |
Sample size varies from 610 (cholesterol) to 670 (Age) except for glomerular filtration rate (GFR). The sample size for GFR is = 453
GFR-MDRD - GFR estimated by four variable modification of diet in renal disease formula. ln = log transformed.
GREM1 (NM_013372) is composed of two exons and exon 2 encodes for the full length protein (Fig. 1). Both exons including their splice sites, and 2 kb upstream from exon 1 were amplified by PCR and sequenced in 32 individuals who positively contributed to the linkage of ACR. This analysis identified 19 diallelic variants including 5 in the putative promoter region and 14 in the 3′ untranslated region (Fig. 1). Our sequence analysis performed in 32 subjects identified from a minimum of 2 heretozygotes (SNP-17) to maximum of 15 heterozygotes (SNP-9). Of the 19 variants identified, 18 are single nucleotide polymorphisms (SNPs) and one is an insertion/deletion polymorphism (IDP). Also, our analysis failed to identify any sequence variation in the coding region. Of the polymorphisms identified, 7 SNPs are novel in this population and 12 of them have already been deposited in the SNP database (Fig. 1).
Fig. 1.

Schematic diagram of human GREM1 (NM_013372) gene structure on 15q12 and the location of the polymorphisms identified and genotyped in SAFDGS. The exons of the GREM1 are represented by solid box and the intron by a thin line. Polymorphisms with the base change or deletion and their reference sequence (rs) numbers are indicated by the vertical arrow. Clusters of markers in linkage disequilibrium (I, II, III) are indicated below the gene structure.
IDP-Insertion/Deletion polymorphism; SNP-Single Nucleotide Polymorphism
Based on an initial genotyping in the 32 subjects, half of the variants could be divided into three groups, indicative of distinct linkage disequilibria (LD). These include SNPs 1, 4, 10, 11, and 17 (SNP cluster I), and SNPs 6, and 7 (SNP cluster II), and SNPs 8, and 9 (SNP cluster III). Therefore, SNPs 17 (cluster I), 7 (cluster II), and 9 (cluster III) were selected as representative markers for each unique cluster of variants for further analysis. The remaining 10 polymorphisms (IDP-1, SNP-2, 3, 5, 12-16, and 18) could not be assigned to any group and were analyzed individually (Fig. 1). In total, we genotyped 13 variants (IDP-1, SNPs-2, 3, 5, 7, 9, 12-16, 17, and 18) in the entire data set (N=670; 39 large families) either by RFLP or TaqMan assays. Genotypic data of all the genotyped polymorphisms were consistent with the Hardy-Weinberg Equilibrium expectations, and there was no evidence for hidden population stratification in the data as tested by QTDT. Based on the genotypic data of the 13 SNPs, SNP-17 (representative of cluster I) was excluded from further analysis because the minor allele frequencies of SNP-17 were less than 0.5% (Fig. 1). Before performing statistical association analysis, we estimated the pairwise LD (r2) between all the 12 variants. Figure 2 shows the overall pattern of LD as measured by the r2 values. As can be seen from Fig. 2, the pairwise LD between variants ranged from 0 to 0.99 and the highest pairwise LD (r2 > 0.8) found among the GREM1 SNPs were: rs12915554 - rs17816260 (r2=0.99), rs17816260 - rs3743103 (r2=0.91), rs12915554 - rs3743103 (r2=0.89), rs17816260 - rs3743104 (r2=0.87), rs12915554 - rs3743104 (r2=0.86), and rs3743104 - rs3743103 (r2=0.81).
Fig. 2.
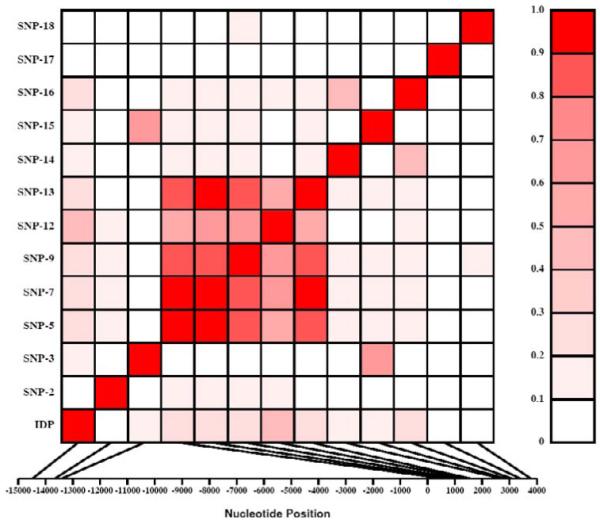
Linkage disequilibrium (LD) between polymorphisms within the GREM1 gene. Polymorphisms are labeled on the y-axis, and the locations (bp) within the gene are shown on the x-axis. Pairwise LD is estimated using r2 values and depicted in the figure by the color intensity of the shaded box, as shown in the legend. The diagonal represents a comparison of each polymorphism against itself (i.e., r2 =1.0).
In addition to association analysis between GREM1 genotypic and ACR data in our pedigree, association analyses were also extended to available albuminuria-reated phenotypic data including systolic blood pressure (SBP), diastolic blood pressure (DBP), BMI, TGL, CHOL, HDL-C, eGFR, and T2DM. The location, allele frequencies, and association analyses of 12 variants examined are summarized in Table 2. The minor allele frequencies of the polymorphisms ranged from 10.0% (SNP-2) to 48.1% (SNP-7). Of the 12 variants examined for association, none of the variants exhibited statistically significant association with ACR after accounting for the potential covariate effects of age, sex, diabetes, duration of diabetes, SBP and antihypertensive treatment (ACE inhibitors or AT1R antagonists). Association analyses, however, indicated that the two novel SNPs located in the 3′ UTR (SNP-14 and SNP-16) were significantly associated with eGFR (P = 0.01 and P = 0.049 respectively) and BMI (P = 0.013 and P = 0.019 respectively) after accounting for the trait specific covariate effects (Table 2). In addition, a novel promoter variant (SNP-2) with minor allele frequency of 10% was found to be associated with SBP (P = 0.038) and DBP (P = 0.005) after adjusting for the covariate; age, sex, diabetes, and antihypertensive treatment (Table 2).
Table 2. Association analysis between the GREM1 polymorphisms and ACR-related traits.
| Variants# | SNP_ID | Gene Location |
Position (bp)# |
Major/Minor Allele (%) |
Traits a | ||||||||
|---|---|---|---|---|---|---|---|---|---|---|---|---|---|
| BMIb | CHOLc | HDL-Cc | TGLc | GFRd | SBPf | DBPf | ACRg | T2DMh | |||||
| P-values | |||||||||||||
| IDP | rs36079334 | Promoter | −14479 | T (57.2)/A (42.8) | 0.198 | 0.913 | 0.298 | 0.338 | 0.434 | 0.518 | 0.973 | 0.532 | 0.186 |
| SNP-2 | - | Promoter | −13661 | A (90.0)/C (10.0) | 0.730 | 0.648 | 0.153 | 0.218 | 0.281 | 0.038 | 0.005 | 0.971 | 0.745 |
| SNP-3 | rs1406389 | Promoter | −13414 | A (78.4)/T (21.6) | 0.688 | 0.915 | 0.541 | 0.176 | 0.589 | 0.535 | 0.862 | 0.559 | 0.723 |
| SNP-5 | rs12915554 | 3′ UTR | 595 | C (52.0)/A (48.0) | 0.203 | 0.526 | 0.903 | 0.397 | 0.150 | 0.296 | 0.598 | 0.869 | 0.454 |
| SNP-7 | rs17816260 | 3′ UTR | 794 | C (51.9)/A (48.1) | 0.214 | 0.501 | 0.658 | 0.498 | 0.164 | 0.329 | 0.529 | 0.855 | 0.489 |
| SNP-9 | rs3743104 | 3′ UTR | 1094 | G (53.4)/A (46.6) | 0.138 | 0.806 | 0.580 | 0.433 | 0.238 | 0.559 | 0.915 | 0.823 | 0.900 |
| SNP-12 | rs7162202 | 3′ UTR | 1454 | A (63.3)/C (36.7) | 0.412 | 0.541 | 0.904 | 0.209 | 0.637 | 0.993 | 0.877 | 0.520 | 0.305 |
| SNP-13 | rs3743103 | 3′ UTR | 1564 | C (52.2)/T (47.8) | 0.277 | 0.563 | 0.473 | 0.989 | 0.256 | 0.297 | 0.454 | 0.936 | 0.762 |
| SNP-14 | - | 3′ UTR | 2736 | G (89.5)/T (10.5) | 0.013 | 0.344 | 0.570 | 0.374 | 0.010 | 0.379 | 0.767 | 0.389 | 0.761 |
| SNP-15 | rs10318 | 3′ UTR | 2852 | C (83.3)/T (16.7) | 0.939 | 0.264 | 0.533 | 0.857 | 0.369 | 0.457 | 0.541 | 0.291 | 0.689 |
| SNP-16 | - | 3′ UTR | 3088 | G (81.4)/A (18.6) | 0.019 | 0.438 | 0.674 | 0.833 | 0.049 | 0.240 | 0.484 | 0.681 | 0.962 |
| SNP-18 | rs1129456 | 3′ UTR | 3776 | A (90.1)/T (9.9) | 0.657 | 0.084 | 0.477 | 0.426 | 0.904 | 0.260 | 0.858 | 0.869 | 0.802 |
Position relative to the A of the start codon (ATG) which is +1; IDP- insertion/deletion polymorphism; SNP-Single Nucleotide Polymorphism.
BMI=Body mass index, CHOL=Total Cholesterol, HDL-C=High-density liporprotein cholesterol, TGL= Triglycerides, SBP=Systolic blood pressure, DBP=diastolic blood pressure, GFR-Glomerular filtration rate, ACR=Albumin to creatinine ratio, T2DM=Type 2 diabetes
adjusted for age and sex terms, and diabetes
adjusted for age and sex terms, diabetes, and lipid medication,
adjusted for age and sex terms, diabetes, duration of diabetes, systolic blood pressure and anti hypertensive treatment
adjusted for age and sex terms, diabetes and anti hypertensive treatment
adjusted for age and sex terms, diabetes, duration of diabetes, systolic blood pressure and anti hypertensive treatment
adjusted for age and sex terms
4. Discussion
Identification and characterization of susceptibility genes for albuminuria and related traits in diabetic patients have been a major focus of current biomedical research efforts. Many genes that play a role in embryonic development are recapitulated in adult disease including DN. Prominent among these is gremlin1, a member of the BMP antagonists family [5]. Several observations suggest a role for gremlin 1 as a modulator of cell turnover and extracellular matrix production in DN. Gremlin 1 expression can be induced in mesangial cells in response to high glucose, TGF-ß, and cyclic mechanical strain [15]. In addition, its expression is modulated by the MAP-Kinase, and reactive oxygen species, all of which are reported to have a role in the pathogenesis of diabetic retinopathy. Gremlin 1 coexpression with BMPs is thought to antagonize their actions in the diabetic milieu. Gremlin 1 modulates the effects of platelet-derived growth factor and cytokines on mesangial cell proliferation and matrix production [15]. The concomitant increased expression of multiple profibrotic genes and gremlin in retinal pericytes exposed to high glucose, and regulation of gremlin expression by profibrotic cytokine, suggest a role for gremlin in fibrogenesis [16]. A pathogenic role may be attributed to gremlin in the context of pathogenesis of DN as over expression of gremlin induces transdifferentiation of cultured tubular epithelial cells to a more fibroblast-like phenotype [17]. Taken together, these data suggest a pathogenic role for gremlin in DN and identify gremlin as a potential therapeutic target [18].
Based on the functional significance of GREM1 and its location on chromosome 15q12, a region previously found to be linked with ACR in Mexican Americans [3,4], we investigated GREM1 as a positional candidate gene containing sequence variants that may contribute to albuminuria and its related traits in Mexican Americans. Of the 12 genetic variants examined for association, none of the variants revealed statistically significant association with ACR after accounting for covariate influences (Table 2). Therefore, it is unlikely that DNA sequence variants that we examined in this gene significantly contribute to the risk for variation in albuminuria in this population. However, these results should be interpreted with caution since genetic variants within unidentified key regulatory elements located either deeper within introns or further upstream or downstream of GREM1 may be present and affect gene expression or function thereby contributing to albuminuria. In addition, the development of albuminuria may be influenced by interacting genetic and environmental risk factors, and the genetic variants that we have identified in the GREM1 gene may be seen to confer risk only when accounting for the modifying factors [4]. Our association analyses however indicated the presence of significant association between two novel 3′UTR SNPs (SNP-14, and SNP-16) and GFR and BMI, respectively. Also a promoter variant was significantly associated with SBP and DBP measures. Functional significance of these associations needs to be elucidated although the contribution of these novel SNPs to variation in albuminuria-related traits appear to be minor.
To characterize whether the variants identified in the promoter region on GREM1 could disrupt the cis-acting putative transcription factor binding sites, the sequence extending 2.0 kb upstream of exon 1 of the GREM1 was analyzed by a computer-assisted Trans-Fac program [19]. Analysis of the 5′-upstream region predicted clustering of several potential cis-acting binding elements for multiple transcription regulators including AP1, GATA-1, and USF. However, none of the variants that we identified disrupted any of the predicted transcription regulators.
Our study has potential limitations. Given the sample size (32 subjects) used for resequencing GREM1, it is possible that we might have missed rare variants specific to this population. Another limitation to be acknowledged is that the GFR estimated by MDRD formula has not been validated in Mexican-Americans. Whereas the time-consuming and expensive direct measurement of GFR is difficult to perform (e.g., inulin, iothalamate clearance) in large scale studies, the estimated GFR using the abbreviated equations is currently one of the best validated means for transforming serum creatinine measurements into GFR in adults [20]. Given attention to such limitations, we have opted to estimate the GFR using the MDRD commonly employed in genetic studies [21,22]. Finally, it should be noted that once the issue of multiple testing is considered, the significant association found for some albuminuria-related traits becomes statistically insignificant.
In conclusion, we report for the first time that the polymorphisms identified in GREM1 show no compelling evidence of association with ACR in Mexican American families with T2DM. While this study found some evidence for contribution of genetic variants in GREM1 to the phenotypic variation in some albuminuria related traits, the magnitude of the genetic effects appear to be minimal. Identification of variants in this study may make it possible to explore this locus for its possible contribution to subclinical cardiovascular and renal related risk factors in other populations.
Acknowledgement
We thank members of the SAFDGS for their participation and cooperation. This study was supported by a Scientist Development Grant from the American Heart Association (FT), Diabetes Action Research and Education Foundation (FT), Satellite HealthCare (FT), George O’Brien Kidney Research Center (P50 DK061597; HEA, FT), VA-Merit Review (HEA, NHA), and by grants from the National Institute of Diabetes, Digestive and Kidney Diseases (MPS: DK42273, DK47482 and RD: DK53889). This work was also supported by the National Center for Research Resources contracts UL1 RR025767 and KL2 RR025766 for the Institute for Integration of Medicine and Science. We also thank the General Clinical Research Center, South Texas Healthcare System.
Footnotes
Publisher's Disclaimer: This is a PDF file of an unedited manuscript that has been accepted for publication. As a service to our customers we are providing this early version of the manuscript. The manuscript will undergo copyediting, typesetting, and review of the resulting proof before it is published in its final citable form. Please note that during the production process errors may be discovered which could affect the content, and all legal disclaimers that apply to the journal pertain.
Conflict of Interest: None
References
- [1].Weir MR. Microalbuminuria and cardiovascular disease. Clin J Am Soc Nephrol. 2007;2:581–590. doi: 10.2215/CJN.03190906. [DOI] [PubMed] [Google Scholar]
- [2].Freedman BI, Bostrom M, Daeihagh P, et al. Genetic factors in diabetic nephropathy. Clin J Am Soc Nephrol. 2007;2:1306–1316. doi: 10.2215/CJN.02560607. [DOI] [PubMed] [Google Scholar]
- [3].Bhandari K, Duggirala R, Kawalitt I, et al. Genome-wide search for albuminuria susceptibility gene in Mexican Americans. Diabetes. 2001;50:A240–A241. [Google Scholar]
- [4].Lehman DM, Leach RJ, Johnson-Pais T, et al. Evaluation of tight junction protein 1 encoding zona occludens 1 as a candidate gene for albuminuria in a Mexican American population. Exp Clin Endocrinol Diabetes. 2006;114:432–437. doi: 10.1055/s-2006-924328. [DOI] [PubMed] [Google Scholar]
- [5].Merino R, Rodriguez-Leon J, Macias D, et al. The BMP antagonist Gremlin regulates outgrowth, chondrogenesis and programmed cell death in the developing limb. Development. 1999;126:5515–5522. doi: 10.1242/dev.126.23.5515. [DOI] [PubMed] [Google Scholar]
- [6].Michos O, Panman L, Vintersten K, et al. Gremlin-mediated BMP antagonism induces the epithelial-mesenchymal feedback signaling controlling metanephric kidney and limb organogenesis. Development. 2004;131:3401–3410. doi: 10.1242/dev.01251. [DOI] [PubMed] [Google Scholar]
- [7].Maciel TT, Melo RS, Schor N, et al. Gremlin promotes vascular smooth muscle cell proliferation and migration. J Mol Cell Cardiol. 2008;44:370–379. doi: 10.1016/j.yjmcc.2007.10.021. [DOI] [PubMed] [Google Scholar]
- [8].Walsh DW, Roxburgh SA, McGettigan P, et al. Co-regulation of Gremlin and Notch signalling in diabetic nephropathy. Biochim Biophys Acta. 2008;1782:10–21. doi: 10.1016/j.bbadis.2007.09.005. [DOI] [PubMed] [Google Scholar]
- [9].Puppala S, Dodd GD, Fowler S, et al. A genomewide search finds major susceptibility loci for gallbladder disease on chromosome 1 in Mexican Americans. Am J Hum Genet. 2006;78:377–392. doi: 10.1086/500274. [DOI] [PMC free article] [PubMed] [Google Scholar]
- [10].Duggirala R, Blangero J, Almasy L, et al. A major susceptibility locus influencing plasma triglyceride concentrations is located on chromosome 15q in Mexican Americans. Am J Hum Genet. 2000;66:1237–1245. doi: 10.1086/302849. [DOI] [PMC free article] [PubMed] [Google Scholar]
- [11].Puppala S, Arya R, Thameem F, et al. Genotype by diabetes interaction effects on the detection of linkage of glomerular filtration rate to a region on chromosome 2q in Mexican Americans. Diabetes. 2007;56:2818–2828. doi: 10.2337/db06-0984. [DOI] [PubMed] [Google Scholar]
- [12].Boerwinkle E, Chakraborty R, Sing CF. The use of measured genotype information in the analysis of quantitative phenotypes in man. I. Models and analytical methods. Ann Hum Genet. 1986;50:181–194. doi: 10.1111/j.1469-1809.1986.tb01037.x. [DOI] [PubMed] [Google Scholar]
- [13].Almasy L, Blangero J. Exploring positional candidate genes: linkage conditional on measured genotype. Behav Genet. 2004;34:173–177. doi: 10.1023/B:BEGE.0000013731.03827.69. [DOI] [PubMed] [Google Scholar]
- [14].Abecasis GR, Cookson WOC, Cardon LR. Pedigree tests of transmission disequilibrium. Eur J Hum Genet. 2000;8:545–551. doi: 10.1038/sj.ejhg.5200494. [DOI] [PubMed] [Google Scholar]
- [15].McMahon R, Murphy M, Clarkson M, et al. IHG-2, a mesangial cell gene induced by high glucose, is human gremlin. Regulation by extracellular glucose concentration, cyclic mechanical strain, and transforming growth factor-beta1. J Biol Chem. 2000;275:9901–9904. doi: 10.1074/jbc.275.14.9901. [DOI] [PubMed] [Google Scholar]
- [16].Kane R, Stevenson L, Godson C, et al. Gremlin gene expression in bovine retinal pericytes exposed to elevated glucose. Br J Ophthalmol. 2005;89:1638–1642. doi: 10.1136/bjo.2005.069591. [DOI] [PMC free article] [PubMed] [Google Scholar]
- [17].Murphy M, McMahon R, Lappin DW, et al. Gremlins: is this what renal fibrogenesis has come to? Exp Nephrol. 2002;10:241–244. doi: 10.1159/000063698. [DOI] [PubMed] [Google Scholar]
- [18].Lappin DW, McMahon R, Murphy M, et al. Gremlin: an example of the re-emergence of developmental programmes in diabetic nephropathy. Nephrol Dial Transplant. 2002;17:65–67. doi: 10.1093/ndt/17.suppl_9.65. [DOI] [PubMed] [Google Scholar]
- [19].Wingender E, Chen X, Hehl R, et al. TRANSFAC: an integrated system for gene expression regulation. Nucleic Acids Res. 2000;28:316–319. doi: 10.1093/nar/28.1.316. [DOI] [PMC free article] [PubMed] [Google Scholar]
- [20].Lamb EJ, Tomson CR, Roderick PJ. Clinical Sciences Reviews Committee of the Association for Clinical Biochemistry: Estimating kidney function in adults using formulae. Ann Clin Biochem. 2005;42:321–345. doi: 10.1258/0004563054889936. [DOI] [PubMed] [Google Scholar]
- [21].Schelling JR, Abboud HE, Nicholas SB, et al. Family Investigation of Nephropathy and Diabetes Research Group: Genome-wide scan for estimated glomerular filtration rate in multi-ethnic diabetic populations: the Family Investigation of Nephropathy and Diabetes (FIND) Diabetes. 2008;57:235–243. doi: 10.2337/db07-0313. [DOI] [PubMed] [Google Scholar]
- [22].Freedman BI, Bowden DW, Rich SS, et al. Genome-wide linkage scans for renal function and albuminuria in Type 2 diabetes mellitus: the Diabetes Heart Study. Diabet Med. 2008;25:268–276. doi: 10.1111/j.1464-5491.2007.02361.x. [DOI] [PubMed] [Google Scholar]