

Abstract
Objective
To assess the relationships between intimate partner homicide (IPH) and public policies including police staffing levels in large U.S. cities.
Design
The research uses a multiple time-series design to examine the effects of statutes aimed at restricting access to firearms for perpetrators of domestic violence, allowing or mandating arrest for violators of domestic violence restraining orders (DVROs), beer excise taxes, and police staffing levels on IPH in 46 of the largest U.S. cities from 1979 to 2003. Both total IPH and IPH committed with a firearm are analyzed. Generalized estimating equations using a Poisson distribution are used to regress IPH on the policies and potential confounders.
Results
State statutes restricting those under DVROs from accessing firearms, and laws allowing the warrantless arrest of DVRO violators are associated with reductions in total and firearm IPH. Police staffing levels are also negatively associated with IPH and firearm IPH. There was no evidence that other policies to restrict firearm access to domestic violence offenders or alcohol taxes had a significant impact on IPH.
Conclusions
Reducing access to firearms for DVRO defendants, increasing police staffing levels and allowing the warrantless arrest of DVRO violators may reduce the city-level risk of IPH. Future research should evaluate factors that may mediate the effect of these laws and increased police staffing levels on IPH to determine if there are opportunities to increase their protective effect. Further research is needed on firearm law implementation to determine why the other tested laws were not found effective.
Keywords: Domestic violence, homicide, public policy, firearms
Intimate partner homicide (IPH) is a global problem; one review of studies from multiple countries shows that IPH accounts for up to 70 percent of femicides (the killing of females) and nine percent of homicides of men.[1] In the U.S., intimate partners account for one third of perpetrators of femicides and four percent of perpetrators of homicides of men.[2] Over 60 percent of IPHs in the U.S. from 1976 to 2005 were committed with firearms.[3] Violent events between intimates that involve firearms are more likely to end in death than those involving knives, other weapons or bodily force.[4] Furthermore, the risk of femicide by an intimate partner increases by five-fold when an abuser has access to a firearm.[5]
Numerous studies link alcohol use, particularly heavy and binge drinking, with intimate partner violence (IPV), and some studies indicate a link between alcohol use and the severity of physical aggression used in an IPV event.[6] State-level alcohol consumption is positively associated with IPH; however, causal connections between alcohol, forms of abuse, and IPH are not entirely clear.[7] A meta-analysis of 112 studies that assessed the effects of alcoholic beverage taxes and prices on drinking reported that increasing taxes and prices decreases alcohol use.[8] An increase in alcohol price or tax could lower consumption among drinkers who are at risk of committing IPV. Higher state excise taxes on beer are associated with lower overall and severe violence against children.[9] Furthermore, alcohol price is negatively associated with the risk of violence against wives, however the results regarding violence against husbands are mixed.[10]
Over 65 percent of intimate partner femicide victims are physically abused by their perpetrators prior to the homicide.[11] Roughly half of violent incidents between partners are reported to the police by female victims.[12] About half of all female victims of IPH and near-lethal IPV obtained a domestic violence restraining order (DVRO), had their abuser arrested, or reported stalking or threatening behaviors to the police during the year preceding the lethal or near-lethal event.[13] Furthermore, IPV perpetrators are less likely to recidivate after a police report is made regardless of whether an arrest occurred.[14] These statistics suggest that the police have opportunities to intervene in IPV and prevent future homicide.
The current study is an investigation of the impacts of targeted IPV policies, alcohol taxes and police staffing levels on IPH. Movement on many of these policies occurred around the same period, the early- to mid-1990s, and they could act as confounders for each other; estimating their effects on IPH simultaneously is an important contribution of this research. To the authors' knowledge, this is the first study to examine the effects of police staffing levels and alcohol taxes on IPH with a multiple time-series design, which research on policy changes is particularly suited. This research will provide advocates and policy makers with a better understanding of the impacts of targeted IPV policies, alcohol taxes and police staffing levels on IPH.
Method
Study Design and Population
We used a multiple time-series design to study trends in IPH and firearm IPH in 46 of the largest U.S. cities from 1979 to 2003. Data on IPH were obtained from the FBI's Supplementary Homicide Reports (SHR).[15] The dependent variables were measured as counts of homicide victims, or homicide victims killed with firearms, of at least 15 years of age identified as spouses, former spouses, boyfriends, girlfriends or homosexual partners of the offenders.
Independent Variables
Two sets of targeted IPV policies were examined in this research, including policies designed to limit a known IPV perpetrator's access to firearms. We examined state laws reducing access to firearms for those under DVROs; state laws reducing a domestic violence (DV) misdemeanant's access to firearms; and state laws allowing police officers to confiscate firearms from the scene of DV. To be consistent with previous research, we used data on the passage of these laws, found in Vigdor and Mercy.[16] As a control, the models included federal laws to reduce access to firearms for those under DVROs and for DV misdemeanants.
We also estimated the effects of laws that allow police to make warrantless arrests for DVRO violations and laws that mandate arrest when officers see evidence of a DVRO violation. Data on these laws up to the year 1996 were obtained from Dugan et al.[17] and updated using the LexisNexis State Capital database. IPV-targeted laws were represented by dichotomous variables set to one if a city-year was subject to the law and zero if it was not.
Data on police staffing levels were collected from the Uniform Crime Reports.[18] Consistent with prior research, police staffing levels were measured as the natural logarithm of the number of sworn officers per 1000 persons.[19, 20] Because the measurement of police staffing levels occurs annually on October 1st, the variable was lagged by one year in the models to more accurately represent contemporary levels.
Given the low cost, wide appeal, and price elasticity of beer, the beer excise tax was used in this research.[21] State taxes are often used in research as a measure of alcohol price because the majority of variation in price across states is due to differing tax rates.[22] Data regarding the federal, state and city excise taxes on beer per gallon were originally collected by Markowitz et al.[23] The federal tax was measured as a dichotomous variable to represent its single, large increase during the study-period, while state and local taxes were combined in a continuous variable and adjusted for inflation to 1983 cents.
The models included as a control the prevalence of firearm ownership, measured as the percentage of suicides committed with firearms in the county in which the majority of each study city resides.[24] This measure is positively correlated with femicide at the state level.[25] However, while it is a good proxy in the cross-section, it has only been weakly related to temporal changes in household prevalence of gun ownership.[24] Data were obtained from the CDC WONDER database.[26, 27]
This study built on similar research by Dugan et al. [17] that examined the effects of state and local policies and victim resources on IPH in U.S. cities from 1976 to 1996, using and updating that data set with information from the same governmental agencies as the original data.
The percentages of the population over 15 years of age married and divorced were included as controls because of their previous significant associations with IPH.[28] The percentage of the population that was Black was included as a control due to the higher rates of IPH experienced by Blacks than Whites.[29]
Feminists posit that IPV is largely determined by gender inequality. Prior research on the link between gender inequality (as measured by differences in educational level) has shown both positive and negative relationships depending on the race, gender, and marital status of victims.[17] We measure gender equality by the ratio of the percent of women over 25 years of age with bachelor's degrees to the percent of men over 25 years of age with bachelor's degrees, and include this as a control variable. Population data are from the decennial censuses.[30-33]
Lack of financial resources reduces the abilities of women to leave abusive relationships.[17] Public assistance programs, such as Aid to Families with Dependent Children (AFDC), now Temporary Assistance for Needy Families (TANF), may contribute to a woman's financial ability to leave an abusive relationship. Higher AFDC benefits are associated with lower rates of IPH victimization of men.[17] Per capita income, obtained from the U.S. Bureau of Economic Analysis,[34] and AFDC/TANF benefit levels for a family of four, obtained from the U.S. House of Representatives' Green Books,[35-38] were both measured in 1983 dollars.
City fixed effects were used to control for unmeasured factors that cause IPH rates to vary from city to city. A linear trend term controlled for omitted factors such as gradual changes in the social norms and resources relevant to IPV that may affect IPH rates nationally over time, while year dummies approximated factors that caused the national rates to change from year to year. The linear trend term was interacted with city fixed effects to account for factors that cause IPH rates to vary over time differently across cities. To control for broader trends in lethal violence and the unmeasured social forces underlying those trends, the non-intimate partner homicide rate for adults aged 25 years and older was included in the analysis.[15]
Statistical Approach
The statistical models used generalized estimating equations, clustered by city, to control for serial correlation of model errors, common in longitudinal data.[39] The offset for the dependent variable was the natural logarithm of the number of people at risk in that city-year. There was no evidence of overdispersion, therefore the count data were modeled by the Poisson distribution.
Endogeneity, which can result if IPH influences the passage of the policies under study, can bias model estimates. The influence of previous levels of IPH and firearm IPH on the passage of each policy was tested; the only significant association found was the negative effect of the three-year lag of firearm IPH levels on passage of the misdemeanor firearm restriction law. To reduce any bias endogeneity might introduce into the models, each of the policies, with the exception of the beer tax variables, was lagged by one year in the models. The bias introduced by feedback endogeneity, however, is largely removed from the present models because of the large number of time periods under study.[40]
Due to the multiple hypotheses under study, a post-hoc Bonferroni correction was used and regression estimates were considered statistically significant if the corrected p value for a two-tailed test was less than .05.
Results
On average, mean IPH and firearm IPH rates per 100000 persons for the study cities decreased from 1979 to 2003, while the average number of sworn police officers per 1000 persons increased modestly from the early 1980s to 1999, then began a downward trend (Figure 1). The number of cities in states with the laws under study also increased throughout the time period (Table A-1). Of the 27 states and 25 years included in the research, 14 states and 2 cities changed their level of taxation on beer (Table A-2). Increases in the tax were usually less than seven cents per gallon. The relative, 1983 value of the state excise tax decreased over time, increasing people's economic ability to buy beer; the only increase in the excise tax experienced by many cities was the doubling of the federal tax in 1991, when it increased from 29 to 58 cents per gallon.
Figure 1.
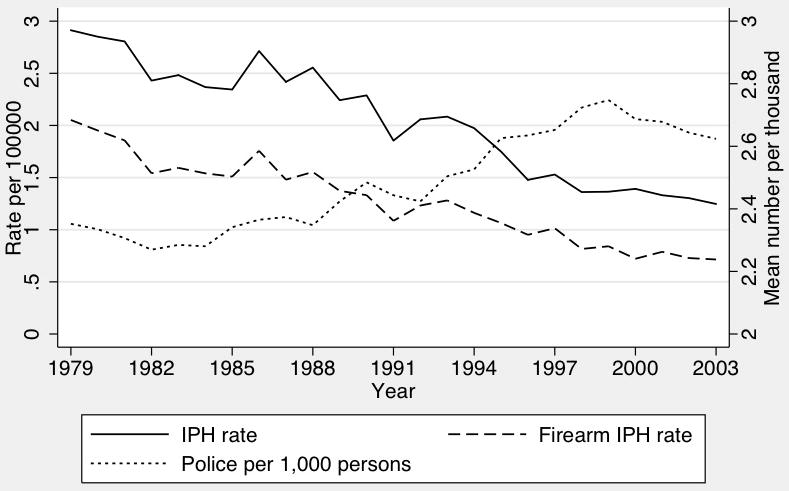
Mean intimate partner homicide (IPH) and firearm IPH rates versus police offers per 1000 persons for 46 of the largest U.S. cities from 1979 to 2003
Model estimates are presented in Table 1. The second, third and fourth columns of the table display the incident rate ratios (IRR), 95% confidence intervals (CI) and Bonferroni-corrected p values produced by the regression on IPH, while the next three columns display the estimates produced by the regression on firearm IPH.
Table 1.
Estimated impact of domestic violence policies, police staffing levels and beer excise taxes on intimate partner homicide in 46 U.S. cities from 1979 to 2003*
| Parameter | Intimate partner homicide | Firearm intimate partner homicide | ||||
|---|---|---|---|---|---|---|
| IRR† | 95% CI† | P value‡ | IRR | 95% CI | P value‡ | |
| Firearm restriction laws | ||||||
| State DVRO† | 0.81 | 0.68 to 0.95 | .044 | 0.75 | 0.62 to 0.92 | .020 |
| State misdemeanor | 1.08 | 0.91 to 1.27 | 1 | 1.18 | 0.99 to 1.41 | .248 |
| Firearm confiscation | 1.10 | 0.92 to 1.31 | 1 | 1.19 | 0.97 to 1.46 | .384 |
| DVRO violation laws | ||||||
| Warrantless arrest | 0.84 | 0.75 to 0.94 | .012 | 0.84 | 0.73 to 0.96 | .048 |
| Mandatory arrest | 1.11 | 0.98 to 1.27 | .404 | 1.05 | 0.89 to 1.24 | 1 |
| Log of police per 1000 persons | 0.68 | 0.53 to 0.87 | .008 | 0.60 | 0.45 to 0.79 | <.001 |
| State beer excise tax§ | 1.00 | 0.99 to 1.01 | 1 | 1.00 | 0.99 to 1.01 | 1 |
| Federal beer tax increase | 1.03 | 0.80 to 1.32 | 1 | 1.11 | 0.80 to 1.54 | 1 |
| Deviance statistic and Chi-square test | 1418.64 | <.001 | 1248.34 | <.001 | ||
Data were modeled by generalized estimating equations using a Poisson distribution; all policies, except for beer excise tax variables, were lagged by one year; estimates from the control variables used in the models are reported in Appendix Table A-3
IRR, incidence rate ratio; CI, confidence interval; DVRO, domestic violence restraining order
P values adjusted using post-hoc Bonferroni correction for multiple hypotheses
State beer excise taxes were measured in 1983 cents
State laws restricting access to firearms for those under DVROs were associated with a 19 percent reduction in IPH risk (IRR: 0.81, 95% CI: 0.68 to 0.95) and a 25 percent reduction in firearm IPH risk (IRR: 0.75, 95% CI: 0.62 to 0.92). Neither the estimated effects of the state law restricting access to firearms for DV misdemeanants nor the firearm confiscation law were statistically significant or in the hypothesized direction.
DVRO violation warrantless arrest laws were associated with a 16 percent decrease in IPH (IRR: 0.84, 95% CI: 0.75 to 0.94) and firearm IPH (IRR: 0.84, 95% CI: 0.73 to 0.96). The number of police officers per 1000 persons was negatively associated with both IPH (IRR: 0.68, 95% CI: 0.53 to 0.87) and firearm IPH risk (IRR: 0.60, 95% CI: 0.45 to 0.79).
Discussion
This analysis suggests that state laws restricting access to firearms for those under DVROs, laws allowing the police to arrest DVRO violators, and higher police staffing levels reduce the risk of IPH. This research looked at areas of policy relevant to IPV – IPV-targeted laws, alcohol taxes, and police staffing levels - each of which experienced change during the early- to mid-1990s. By estimating their effects simultaneously, we prevented these policies from potentially confounding each others' estimated effects on IPH.
The reduction in IPH in response to DVRO firearm restriction laws found here is consistent with research by Vigdor and Mercy that examined the effects of these laws on IPH at the state level.[16] Our research, based on city-level data, provides additional evidence that these state laws may suppress IPH. Similar to Vigdor and Mercy,[16] the current study estimated that laws restricting access to firearms for DV misdemeanants and laws allowing police to confiscate firearms from the scene of DV do not affect IPH. The apparent lack of effectiveness of these laws may be due to inadequate enforcement, otherwise porous gun laws that allow prohibited individuals to obtain firearms, and/or low levels of convictions among IPV offenders.
Barriers to effective enforcement of laws designed to disarm IPV offenders have been documented.[41] As with most policy evaluations, this study did not control for policy implementation. Additional research is needed to determine best practices for implementing these policies and whether their effects on IPH depend enforcement measures.
Consistent with previous research,[17] laws allowing the warrantless arrest of DVRO violators were associated with decreases in IPH. The mechanism by which this policy may reduce IPH is unclear. It is unknown whether these laws result in increases in arrests and charges; however the threat of arrest may deter some perpetrators from violating DVROs and subsequently using lethal violence. We found no association between laws mandating the arrest of DVRO violators and IPH. Dugan et al. reported that these statutes were associated with reduced risks for specific subgroups of IPH victims (e.g., White, unmarried females).[17] If these laws only affect certain subgroups, the effects may not be detectable on the aggregated victim groups examined here. We did not disaggregate groups by gender, race or relationship type because doing so would reduce annual counts to such an extent that city-level rates would be unstable.
Higher police staffing levels were linked with lower risks of IPH. Arrest can deter repeat IPV, including lethal forms,[5, 14, 17] and we hypothesized that increased police staffing enhances the ability of police to arrest perpetrators of IPV, either through having more resources available or because it may indicate an ability of police jurisdictions to have specialized DV units. The effects of higher levels of police staffing on IPH also may be due to the increased incarceration of IPV offenders for non-IPV crimes. Perpetrators of IPV are more likely to commit acquaintance and stranger violence than those who do not engage in IPV, and many IPV perpetrators have non-violent criminal histories.[42, 43] A decrease in IPH is expected if a sufficient amount of IPV perpetrators are in jail or prison.
We found no support for the hypothesis that higher beer taxes reduce IPH risk. However, the small tax increases that occurred during the study period were possibly not large enough to change consumer behavior to the extent needed to affect IPH.
While we found significant effects of certain policies and police staffing levels on IPH, the overall fit of our models, as determined by deviance statistics, was poor, suggesting that factors not included in the models may explain variation in rates of IPH. Over the past 30 years, numerous changes occurred which may be implicated in the decrease of IPH, such as the passage of laws allowing or mandating warrantless arrest for IPV perpetration and laws increasing the availability and strength of DVROs. Increases in women's economic standing and the proliferation of social services for victims are also hypothesized to reduce the risk of IPH by providing women with options other than staying in the relationships.[28] These policies and societal changes were beyond the scope of this research.
This study is limited by relying on imperfect SHR data to measure IPH. The SHR is a voluntary reporting system and, as such, many jurisdictions fail to report for a given time period. Among those reported homicides, the relationship between victim and perpetrator is sometimes unknown, excluded or miscoded, making it difficult to ascertain the true number of IPH victimizations. To account for this, the models were retested, with similar results, using the adjustment for SHR underreporting used in Dugan et al.[17]
This research tested the effects of the one-year lag of the policy variables on IPH. We also tested alternative models with non-lagged policy variables and found that the estimates of policy effects differed from those derived from our policy-lagged models. For example, while the IRR did not change considerably, in the alternative models the DVRO firearm restriction law did not have a significant impact on IPH, however in the lagged models, it did (estimates from the alternative models available upon request). It is preferable to use lagged policy variables to reduce any bias that might result if the policies were passed in response to IPH levels, and also to better reflect the lag between a law going into effect and its full implementation. In the alternative models, the policy variables switched on in the year of policy adoption, measuring the effect of the policy before implementation and substantive changes in police practice could be made. For these reasons, we believe the lagged policy variable models are more trustworthy.
This study adds to a small, but growing, body of research that provides evidence that state laws restricting those under DVROs from accessing firearms and allowing the warrantless arrest of DVRO violators save lives, and that increasing the number of police officers in a city may reduce IPH, as well. Laws allowing the warrantless arrest of DVRO violators are now widespread, and future research should focus on how these laws may reduce IPH so that their protective effect may be replicated in other state and local policies. Future research should also evaluate factors that may mediate the effect of state laws restricting those under DVRO laws from accessing firearms and increased police staffing levels on IPH to determine if there are opportunities to increase their protective effect.
What is already known on this subject
Firearms are the weapons used in the majority of intimate partner homicides.
Once a violent event is reported to them, police have the opportunity to intervene in intimate partner violence, and potentially prevent intimate partner homicide.
What this study adds
State statutes designed to limit access to firearms for those under domestic violence restraining orders are associated with a reduction in intimate partner homicide at the city level, net of other criminal justice statutes targeted at perpetrators of IPV.
Laws allowing the warrantless arrest of violators of domestic violence restraining orders are associated with a reduction in intimate partner homicide, as are high police staffing levels.
Acknowledgments
We would like to acknowledge Karen Bandeen-Roche and Jeffrey Wooldridge, who both provided statistical insight to this research, Jon Vernick, Guohua Li and Jackie Campbell, for their invaluable comments, guidance and suggestions, and Laura Dugan, whose research inspired this study.
Funding: This research was funded by a Ruth L. Kirschstein National Research Service Award Individual Fellowship (F31 AA016035).
The project described was supported by Award Number 5F31AA016035-02 from the National Institute On Alcohol Abuse And Alcoholism. The content is solely the responsibility of the authors and does not necessarily represent the official views of the National Institute On Alcohol Abuse And Alcoholism or the National Institutes of Health.
APPENDIX
Table A-1.
Year of passage of criminal justice statutes
| State | Domestic violence misdemeanant gun restriction | DVRO* defendant gun restriction | Firearm confiscation allowed | Warrantless arrest for DVRO violation | Mandatory arrest for DVRO violation |
|---|---|---|---|---|---|
| Arizona | 1996 | 1996 | 1980 | 1991 | |
| California | 1994 | 1991 | 1984 | 1993 | 1995 |
| Colorado | 1994-1998 | 1994 | 1991 | 1991 | |
| Georgia | 1986 | ||||
| Hawaii | 1988 | 1993 | 1996 | 1980 | |
| Illinois | 1996 | 1996 | 1993 | 1986 | |
| Indiana | 1999 | 2002 | 1985 | ||
| Louisiana | 1983 | ||||
| Maryland | 1996 | 1996 | 1992 | 1992 | |
| Massachusetts | 1994 | 1978 | 1978 | ||
| Michigan | 1996 | 1978 | |||
| Minnesota | 1992 | 1978 | 1983 | ||
| Missouri | 1980 | 1989 | |||
| Nebraska | 2004 | 1989 | 1989 | ||
| New Mexico | 1987 | ||||
| New York | 1993 | 1996 | 1995 | 1996 | |
| North Carolina | 1995 | 1987 | |||
| Ohio | 1994 | 1979 | 2003 | ||
| Oklahoma | 1993 | 1986 | |||
| Oregon | 1977 | ||||
| Pennsylvania | 1995 | 1995 | 1986 | 1986 | |
| Tennessee | 1995 | 1979 | |||
| Texas | 2001 | 1996 | 1983 | ||
| Virginia | 1994 | 1992 | 2004 | ||
| Washington | 1993 | 1979 | |||
| Wisconsin | 1996 | 1989 | 1996 |
DVRO, domestic violence restraining order
Table A-2.
Changes in state and city beer taxes in cents per gallon
| State or City | Year | Amount changed | State or City | Year | Amount changed |
|---|---|---|---|---|---|
| Arizona | 1984 | 8 | New York City | 1980 | 12 |
| California | 1991 | 16 | North Carolina | 1999 | -0.2 |
| Hawaii | 1986 | 40 | Ohio | 1989 | 3 |
| 1988 | 5 | 1993 | 6.7 | ||
| 1989 | 7 | Cleveland | 1990 | 16 | |
| Illinois | 1999 | 11.5 | Oklahoma | 1984 | 8 |
| Indiana | 1981 | 2 | Tennessee | 1981 | 1.6 |
| Minnesota | 1987 | 2 | 2002 | 1.2 | |
| New Mexico | 1981 | 1 | Texas | 1984 | 3.3 |
| 1983 | 9 | Washington | 1981 | 3.5 | |
| 1993 | 17 | 1982 | 0.6 | ||
| 1994 | 6 | 1989 | 6.5 | ||
| New York | 1983 | 1 | 1993 | 3 | |
| 1989 | 5.5 | 1995 | 4.6 | ||
| 1990 | 10 | 1997 | 3 | ||
| 1999 | -7.5 | ||||
| 2001 | -1 | ||||
| 2003 | -1.5 |
Table A-3.
Estimated impact of control variables on intimate partner homicide in 46 U.S. cities from 1979 to 2003*
| Parameter | Intimate partner homicide | Firearm intimate partner homicide | ||||
|---|---|---|---|---|---|---|
| IRR† | 95% CI† | p value‡ | IRR | 95% CI | p value | |
| Percent Black | 0.98 | 0.91 to 1.06 | 1 | 0.95 | 0.86 to 1.05 | 1 |
| Percent married | 1.02 | 0.92 to 1.14 | 1 | 1.03 | 0.93 to 1.14 | 1 |
| Percent divorced | 1.07 | 0.92 to 1.24 | 1 | 1.10 | 0.94 to 1.28 | 1 |
| AFDC/TANF benefit§ | 1.00 | 1.00 to 1.00 | 1 | 1.00 | 1.00 to 1.00 | 1 |
| Income per capita§ | 1.00 | 1.00 to 1.00 | .328 | 1.00 | 1.00 to 1.00 | 1 |
| Unemployment rate | 1.03 | 0.98 to 1.07 | .928 | 1.07 | 1.01 to 1.13 | .096 |
| Educational ratio | 0.47 | 0.33 to 0.67 | < .001 | 0.26 | 0.12 to 0.53 | < .001 |
| Prevalence of firearm ownership | 1.45 | 0.87 to 2.43 | .624 | 1.44 | 0.69 to 2.99 | 1 |
| Adult, non-intimate homicide rate | 1.01 | 1.01 to 1.02 | < .001 | 1.01 | 1.01 to 1.02 | < .001 |
Data modeled by generalized estimating equations using a Poisson distribution, estimates of federal law variables, city and year fixed effects, linear time trend, and the interaction of city fixed effects with linear time trend not reported
IRR, incidence rate ratio; CI, confidence interval
P values adjusted using post-hoc Bonferroni correction for multiple hypotheses
Per capita income and AFDC/TANF benefits measured in 1983 dollars
Footnotes
Competing interests: None
Contributorship: April Zeoli is the guarantor of the paper, and as such had full access to the data and accepts full responsibility for the data and the analyses. Both April Zeoli and Daniel Webster contributed to the research conception and design, analysis and interpretation of data and drafting and approval of the final version to be published.
The Corresponding Author has the right to grant on behalf of all authors and does grant on behalf of all authors, an exclusive license (or non-exclusive for government employees) on a worldwide basis to the BMJ Publishing Group Ltd and its Licensees to permit this article (if accepted) to be published in Injury Prevention and any other BMJPGL products to exploit all subsidiary rights, as set out in our license. http://ip.bmjjournals.com/ifora/licence.dtl
Contributor Information
April M. Zeoli, School of Criminal Justice, Michigan State University, Baltimore, MD, USA
Daniel W. Webster, Johns Hopkins Bloomberg School of Public Health, Baltimore, MD, USA
References
- 1.Krug E, Dahlberg L, Mercy J, et al. World report on violence and health. Geneva: World Health Organization; 2002. [Google Scholar]
- 2.Rennison CM. Crime Data Brief. Washington, DC: Bureau of Justice Statistics; 2003. Intimate partner violence, 1993-2001. Report No.: NCJ197838. [Google Scholar]
- 3.Bureau of Justice Statistics. Homicide trends in the u.S.: Intimate homicide. [website]: Office of Justice Programs. 2008 [updated July 11, 2007; cited 2008 April 10]; Available from: http://www.ojp.usdoj.gov/bjs/homicide/intimates.htm.
- 4.Saltzman LE, Mercy JA, OCarroll P, et al. Weapon involvement and injury outcomes in family and intimate assaults. JAMA. 1992;267:3043–3047. [PubMed] [Google Scholar]
- 5.Campbell JC, Webster DW, Koziol-McLain J, et al. Risk factors for femicide in abusive relationships: Results from a multisite case control study. Am J Public Health. 2003;93:1069–1097. doi: 10.2105/ajph.93.7.1089. [DOI] [PMC free article] [PubMed] [Google Scholar]
- 6.Foran H, O'Leary K. Alcohol and intimate partner violence: A meta-analytic review. Clin Psychol Rev. 2008;28:1222–1234. doi: 10.1016/j.cpr.2008.05.001. [DOI] [PubMed] [Google Scholar]
- 7.Parker RN. Bringing “Booze” Back in: The relationship between alcohol and homicide. Journal of Research in Crime and Delinquency. 1995;32:3–38. [Google Scholar]
- 8.Wagenaar AC, Salois MJ, Komro KA. Effects of beverage alcohol price and tax levels on drinking: A meta-analysis of 1003 estimates from 112 studies. Addiction. 2009;104:179–190. doi: 10.1111/j.1360-0443.2008.02438.x. [DOI] [PubMed] [Google Scholar]
- 9.Markowitz S, Grossman M. Alcohol regulation and domestic violence towards children. Contemp Econ Policy. 1998;16:309–320. [Google Scholar]
- 10.Markowitz S. The price of alcohol, wife abuse, and husband abuse. S Econ J. 2000;67:279–303. [Google Scholar]
- 11.McFarlane J, Campbell JC, Wilt SA, et al. Stalking and intimate partner femicide. Homicide Studies. 1999;3:300–316. [Google Scholar]
- 12.Greenfeld LA, Rand MR, Craven D, et al. Violence by intimates: Analysis of data on crimes by current or former spouses, boyfriends, and girlfriends. Washington, DC: U.S. Department of Justice; 1998. Report No.: NCJ-167237. [Google Scholar]
- 13.McFarlane J, Campbell JC, Watson K. The use of the justice system prior to intimate partner femicide. Criminal Justice Review. 2001;26:193–208. [Google Scholar]
- 14.Felson RB, Ackerman JM, Gallagher CA. Police intervention and the repeat of domestic assault. Criminology. 2005;43:563–588. [Google Scholar]
- 15.Fox JA. ICPSR04351-v1. Ann Arbor, MI: Inter-University Consortium for Political and Social Research [producer and distributor]; 2005. Uniform crime reports [united states]: Supplementary homicide reports, 1976-2003 [computer file] [Google Scholar]
- 16.Vigdor ER, Mercy JA. Do laws restricting access to firearms by domestic violence offenders prevent intimate partner homicide? Eval Rev. 2006;30:313–346. doi: 10.1177/0193841X06287307. [DOI] [PubMed] [Google Scholar]
- 17.Dugan L, Nagin DS, Rosenfeld R. Exposure reduction or retaliation? The effects of domestic violence resources on intimate-partner homicide. Law Soc Rev. 2003;37:169–198. [Google Scholar]
- 18.U.S. Dept. of Justice FBI. Computer file. Ann Arbor, MI: Inter-University Consortium for Political and Social Research [producer and distributor]; Uniform crime reporting program data: [united states]: Police employee (leoka) data, [computer file] [Google Scholar]
- 19.Marvell T, Moody C. Specification problems, police levels, and crime rates. Criminology. 1996;34:609–646. [Google Scholar]
- 20.Kovandzic TV, Sloan JJ. Police levels and crime rates revisited: A county-level analysis from florida (1980-1998) J Crim Justice. 2002;30:65–76. [Google Scholar]
- 21.Trolldal B, Ponicki W. Alcohol price elasticities in control and license states in the united states, 1982-99. Addiction. 2005;100:1158–1165. doi: 10.1111/j.1360-0443.2005.001129.x. [DOI] [PubMed] [Google Scholar]
- 22.Chaloupka F, Grossman M, Saffer H. The effects of price on alcohol consumption and alcohol-related problems. Alcohol Res Health. 2002;26:22–34. [PMC free article] [PubMed] [Google Scholar]
- 23.Markowitz S, Chatterji P, Kaestner R. Estimating the impact of alcohol policies on youth suicides. J Ment Health Policy Econ. 2003;6:37–46. [PubMed] [Google Scholar]
- 24.Azrael D, Cook PJ, Miller M. State and local prevalence of firearms ownership measurement, structure, and trends. Journal of Quantitative Criminology. 2004;20:43–62. [Google Scholar]
- 25.Miller M, Azrael D, Hemenway D. Firearm availability and suicide, homicide, and unintentional firearm deaths among women. J Urban Health. 2002;79:26–38. doi: 10.1093/jurban/79.1.26. [DOI] [PMC free article] [PubMed] [Google Scholar]
- 26.National Center for Health Statistics. Compressed mortality file compiled from cmf 1999-2003, series 20, no 2i 2006 on cdc wonder on-line database. Centers for Disease Control and Prevention; 2006. [cited 2006 Sept. 6, 2006] [Google Scholar]
- 27.National Center for Health Statistics. Compressed mortality file compiled from cmf 1968-1998, series 20, no 2h 2004 on cdc wonder on-line database. Centers for Disease Control and Prevention; 2006. [cited 2006 Sept. 6, 2006] [Google Scholar]
- 28.Dugan L, Nagin DS, Rosenfeld R. Explaining the decline in intimate partner homicide: The effects of changing domesticity, women's status, and domestic violence resources. Homicide Studies. 1999;3:187–214. [Google Scholar]
- 29.Fox JA, Zawitz MW. Homicide trends in the united states: Intimate homicide. [website]: Bureau of Justice Statistics. 2009 [updated July 11, 2007; cited 2009 Jan 16]; Available from: http://www.ojp.usdoj.gov/bjs/homicide/intimates.htm.
- 30.U.S. Census Bureau. Volume 1, characteristics of the population. Washington, DC: USGPO; 1973. Census of the population, 1970. [Google Scholar]
- 31.U.S. Census Bureau. Volume 1, characteristics of the population. Washington, DC: USGPO; 1981. 1980 census of the population. [Google Scholar]
- 32.U.S. Census Bureau. Census of population and housing, 1990: Summary file 1. 1991 Website. [cited 2006 June 26]; Available from: http://factfinder.census.gov.
- 33.U.S. Census Bureau. Census 2000 summary file 3. 2001 Website. [cited 2006 June 26]; Available from: http://factfinder.census.gov.
- 34.U.S Bureau of Economic Analysis. Metropolitan statistical areas per capita personal income 1979-2003. [website]: U S Department of Commerce. 2006 [cited 2006 August 12]; Available from: www.bea.gov/bea/regional/reis.
- 35.Committee on Ways and Means. 2004 green book. Washington, DC: U.S. House of Representatives; 2004. [Google Scholar]
- 36.Committee on Ways and Means. 2000 green book. Washington, DC: U.S. House of Representatives; 2000. [Google Scholar]
- 37.Committee on Ways and Means. 1998 green book. Washington, DC: U.S. House of Representatives; 1998. [Google Scholar]
- 38.Committee on Ways and Means. 1996 green book. Washington, DC: U.S. House of Representatives; 1996. [Google Scholar]
- 39.Diggle PJ, Heagerty P, Liang KY, et al. In: Analysis of longitudinal data. Second. Atkinson A, et al., editors. New York: Oxford University Press; 2002. [Google Scholar]
- 40.Wooldridge JM. Econometric analysis of cross section and panel data. Second. Cambridge, MA: MIT Press; 2002. [Google Scholar]
- 41.Frattaroli S, Teret SP. Understanding and informing policy implementation: A case study of the domestic violence provisions of the maryland gun violence act. Eval Rev. 2006;30:347–360. doi: 10.1177/0193841X06287684. [DOI] [PubMed] [Google Scholar]
- 42.Piquero AR, Brame R, Fagan J, et al. Assessing the offending activity of criminal domestic violence suspects: Offense specialization, escalation, and de-escalation evidence from the spouse assault replication program. Public Health Rep. 2006;121:409–418. doi: 10.1177/003335490612100409. [DOI] [PMC free article] [PubMed] [Google Scholar]
- 43.Fagan J, Wexler S. Crime in the home and crime in the streets: The relation between family violence and stranger crime. Violence Vict. 1987;2:5–21. [PubMed] [Google Scholar]