

Abstract
Summary: SiteHound uses Molecular Interaction Fields (MIFs) produced by EasyMIFs to identify protein structure regions that show a high propensity for interaction with ligands. The type of binding site identified depends on the probe atom used in the MIF calculation. The input to EasyMIFs is a PDB file of a protein structure; the output MIF serves as input to SiteHound, which in turn produces a list of putative binding sites. Extensive testing of SiteHound for the detection of binding sites for drug-like molecules and phosphorylated ligands has been carried out.
Availability: EasyMIFs and SiteHound executables for Linux, Mac OS X, and MS Windows operating systems are freely available for download from http://sitehound.sanchezlab.org/download.html.
Contact: roberto@sanchezlab.org or roberto.sanchez@mssm.edu
Supplementary information: Supplementary data are available at Bioinformatics online.
1 INTRODUCTION
The molecular function of a protein is largely determined by interactions with other molecules at binding sites on its surface. Hence, identification of the location and characteristics of ligand-binding sites can contribute to functional annotation of a protein; it can guide experiments, and be useful in predicting or verifying interactions. The identification of ligand-binding sites can also be an important part of the drug discovery process.
Several methods have been developed for the identification of binding sites from protein structures and sequences. Sequence-based methods (Berezin et al., 2004; Capra and Singh, 2007) have the advantage of being applicable to proteins of unknown structure, by relying on the evolutionary conservation of residues. However, they are also limited by the fact that not all binding sites are conserved, and not all conserved residues correspond to binding sites. Structure-based approaches can overcome these limitations and complement sequence-based methods (Wang et al., 2008). The simplest example of this complementarity is the use of a protein structure as a filter for sequence-based predictions (Lichtarge and Sowa, 2002). Some structure-based methods rely on geometrical features (Dundas et al., 2006), while others rely on energetic calculations. Energy-based methods can identify conserved residue side-chains in high-energy conformations, which tend to correspond to functionally relevant residues (Cheng et al., 2005; Liang et al., 2006) or directly describe the molecular interaction properties of the protein surface (Laurie and Jackson, 2005). Hence, these methods can identify non-conserved binding sites, and identify residues that are conserved solely due to functional constraints. The methods that rely on molecular interaction properties can in principle also distinguish binding sites with distinct ligand preferences (e.g. hydrophobic versus polar) if different chemical probes are used for the molecular interaction calculation.
Here we describe software tools that enable the identification of binding sites via calculation of molecular interaction properties. EasyMIFs, a simple Molecular Interaction Field (MIF) calculator; and SiteHound, a post processing tool for MIFs that identifies interaction energy clusters corresponding to putative binding sites. The motivation for the development of these tools is to provide easy to use and freely available software for the analysis of protein structures on a wide range of computer systems. While a web interface to SiteHound is available (Hernandez et al., 2009), it is limited to smaller systems and only two types of binding sites. The EasyMIFs and SiteHound tools provide a large set of chemical probes for MIF calculation and are designed to facilitate large scale and automated analysis, for which web interfaces are not practical.
2 METHODS
2.1 MIF calculation
MIFs describe the spatial variation of the interaction energy between a target molecule (e.g. a protein) and a probe, which represents a specific chemical group or atom. The MIF is usually discretized on a 3D orthogonal grid that surrounds the target molecule, thus representing a map of the potential energy between the probe and the target molecule. Some of the applications of MIFs include quantitative structure–activity relationship (QSAR), ligand selectivity analysis, pharmacophoric search and binding site detection (Cruciani, 2006). EasyMIFs provides a simple and rapid way of characterizing a protein structure from a chemical standpoint, returning maps that can be displayed in molecular graphics software such as PyMOL (DeLano) and others. The MIF calculations are carried out in vacuo using the GROMOS force field (Van Der Spoel et al., 2005) and a distance dependent dielectric. For each grid point in the discretized orthogonal grid, the program computes the potential energy between the probe (a particular atom type) and all atoms in the protein, as a sum of van der Waals and electrostatic interactions. The parameters for the Lennard-Jones term, representing the van der Waals interactions, depend on the chosen probe and the particular protein atom type, and are taken from a matrix of parameters distributed with the GROMACS package (Van Der Spoel et al., 2005). The distance-dependent dielectric sigmoidal function of Solmajer and Mehler (1991) as described in Cui et al. (2008) is used. The default output is a 1 Å resolution grid with dimensions large enough to accommodate the entire protein.
2.2 Binding site identification
The SiteHound algorithm identifies the location of potential binding sites by filtering and clustering the MIFs produced by EasyMIFs or other programs in a way similar to Q-SiteFinder (Laurie and Jackson, 2005). The main differences lie in the use of multiple probes for the detection of different types of binding sites; alternative clustering algorithms, which improve results for ligands of different shapes (see Supplementary Materials); and the fact that SiteHound can be run independently of a web interface. In the first step, a probe-dependent energy cutoff is applied to filter out all the MIF points corresponding to unfavorable interaction energies. The remaining points are clustered according to spatial proximity with an agglomerative hierarchical clustering algorithm using average or single linkage. This step yields a hierarchical dendrogram, which is cut into non-overlapping clusters by applying a distance cut-off. Total interaction energy (TIE; the sum of the energy of all the points in the cluster) is used to rank the resulting clusters. A test on 77 protein–ligand complexes containing drug-like molecule showed that the correct site is identified among the top three SiteHound clusters in 95% of the cases (79% for unbound proteins) when using the ‘methyl’ probe (Ghersi and Sanchez, 2009). Similar accuracy was observed in a set of more than 120 proteins that bind to phosphorylated ligands when using the ‘phosphate oxygen’ probe for binding site detection (Ghersi and Sanchez, manuscript in preparation).
2.3 Usage and output
While EasyMIFs and SiteHound can be used separately (see Supplementary Materials) they are usually used in combination with each other. A script called auto.py allows for fully automated binding site identification using a single command: ‘auto.py –i 1kna.pdb –p PROBE’. Where the –i option specifies the input PDB file (e.g. 1kna.pdb) and the –p option specifies the probe used for binding site detection. More than 30 atom types from the GROMOS forcefield are available to use as probes. As mentioned above, the methyl (CMET) and phosphate oxygen (OP) probes have been tested extensively. Additionally, hydroxyl oxygen (OA) has been used to characterize sugar-binding sites; and peptide nitrogen (N), water (OW) and bare carbon (C) have been used to characterize various other ligand binding sites. The dimensions of a box large enough to enclose the whole protein, with a clearance of 5 Å in each direction and a resolution of 1 Å are determined automatically. Alternatively, command line options can be used to specify the center, dimensions and resolution of the grid. Several output files are produced, the most important ones being: _summary.dat that contains a summary of all the clusters ranked by TIE; _predicted.dat that lists the protein residues in contact with each of the clusters; and _clusters.pdb, which can be used to display the clusters in molecular graphics programs (Fig. 1). Calculations typically take a few minutes for one protein depending on the computer system and the size of the protein (see Supplementary Materials). Most of the computing time is taken up by the MIF calculation in EasyMIFs. The ability to run SiteHound separately from EasyMIFs allows the user to explore different clustering options (e.g. average or single linkage) and parameters (energy and distance cutoff) without the need to recalculate the MIF.
Fig. 1.
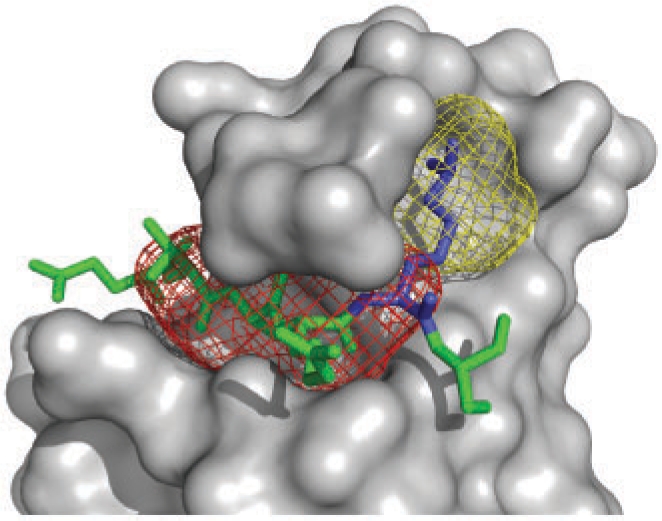
Sample SiteHound output. Chromo domain of HP1 complexed with histone H3 tail (green) containing dimethyl-lysine 9 (blue) (PDB 1kna). SiteHound methyl probe clusters are shown as mesh surfaces. The red cluster identifies the peptide-binding region; the yellow cluster identifies the dimethyl-lysine-binding environment. The figure was rendered with PyMOL (DeLano) using the SiteHound ‘_clusters.pdb’ output file.
Supplementary Material
ACKNOWLEDGEMENTS
The authors thank Dr Mihaly Mezei for help with the electrostatic term and Marylens Hernandez for setting up the SiteHound website.
Funding: NSF MCB 0517352; NIH GM081713.
Conflict of Interest: none declared.
REFERENCES
- Berezin C, et al. ConSeq: the identification of functionally and structurally important residues in protein sequences. Bioinformatics. 2004;20:1322–1324. doi: 10.1093/bioinformatics/bth070. [DOI] [PubMed] [Google Scholar]
- Capra JA, Singh M. Predicting functionally important residues from sequence conservation. Bioinformatics. 2007;23:1875–1882. doi: 10.1093/bioinformatics/btm270. [DOI] [PubMed] [Google Scholar]
- Cheng G, et al. Improvement in protein functional site prediction by distinguishing structural and functional constraints on protein family evolution using computational design. Nucleic Acids Res. 2005;33:5861–5867. doi: 10.1093/nar/gki894. [DOI] [PMC free article] [PubMed] [Google Scholar]
- Cruciani G. Molecular Interaction Fields: Applications in Drug Discovery and ADME Prediction. Chichester: Wiley-VCH; 2006. [Google Scholar]
- Cui M, et al. Prediction of protein loop structures using a local move Monte Carlo approach and a grid-based force field. Protein Eng. Des. Sel. 2008;21:729–735. doi: 10.1093/protein/gzn056. [DOI] [PMC free article] [PubMed] [Google Scholar]
- DeLano WL. The PyMOL Molecular Graphics System. Available at http://www.pymol.org. [Google Scholar]
- Dundas J, et al. CASTp: computed atlas of surface topography of proteins with structural and topographical mapping of functionally annotated residues. Nucleic Acids Res. 2006;34:W116–W118. doi: 10.1093/nar/gkl282. [DOI] [PMC free article] [PubMed] [Google Scholar]
- Ghersi D, Sanchez R. Improving accuracy and efficiency of blind protein-ligand docking by focusing on predicted binding sites. Proteins. 2009;74:417–424. doi: 10.1002/prot.22154. [DOI] [PMC free article] [PubMed] [Google Scholar]
- Hernandez M, et al. SITEHOUND-web: a server for ligand binding site identification in protein structures. Nucleic Acids Res. 2009;37:W413–W416. doi: 10.1093/nar/gkp281. [DOI] [PMC free article] [PubMed] [Google Scholar]
- Laurie AT, Jackson RM. Q-SiteFinder: an energy-based method for the prediction of protein-ligand binding sites. Bioinformatics. 2005;21:1908–1916. doi: 10.1093/bioinformatics/bti315. [DOI] [PubMed] [Google Scholar]
- Liang S, et al. Protein binding site prediction using an empirical scoring function. Nucleic Acids Res. 2006;34:3698–3707. doi: 10.1093/nar/gkl454. [DOI] [PMC free article] [PubMed] [Google Scholar]
- Lichtarge O, Sowa ME. Evolutionary predictions of binding surfaces and interactions. Curr. Opin. Struct. Biol. 2002;12:21–27. doi: 10.1016/s0959-440x(02)00284-1. [DOI] [PubMed] [Google Scholar]
- Solmajer T, Mehler EL. Electrostatic screening in molecular dynamics simulations. Protein Eng. 1991;4:911–917. doi: 10.1093/protein/4.8.911. [DOI] [PubMed] [Google Scholar]
- Van Der Spoel D, et al. GROMACS: fast, flexible, and free. J. Comput. Chem. 2005;26:1701–1718. doi: 10.1002/jcc.20291. [DOI] [PubMed] [Google Scholar]
- Wang K, et al. Protein meta-functional signatures from combining sequence, structure, evolution, and amino acid property information. PLoS Comput. Biol. 2008;4:e1000181. doi: 10.1371/journal.pcbi.1000181. [DOI] [PMC free article] [PubMed] [Google Scholar]
Associated Data
This section collects any data citations, data availability statements, or supplementary materials included in this article.