

Abstract
Motivation: Modelling antigenic shift in influenza A H3N2 can help to predict the efficiency of vaccines. The virus is known to exhibit sudden jumps in antigenic distance, and prediction of such novel strains from amino acid sequence differences remains a challenge.
Results: From analysis of 6624 amino acid sequences of wild-type H3, we propose updates to the frequently referenced list of 131 amino acids located at or near the five identified antibody binding regions in haemagglutinin (HA). We introduce a class of predictive models based on the analysis of amino acid changes in these binding regions, and extend the principle to changes in HA1 as a whole by dividing the molecule into regional bands.
Our results show that a range of simple models based on banded changes give better predictive performance than models based on the established five canonical regions and can identify a higher proportion of vaccine escape candidates among novel strains than a current state-of-the-art model.
Contact: wlees01@mail.cryst.bbk.ac.uk
Supplementary information: Supplementary Data is available at Bioinformatics online.
1 INTRODUCTION
Seasonal influenza poses a serious world-wide threat to public health, with up to 500 000 deaths being attributable on average to annual influenza epidemics (WHO, 2009). Of particular concern are strains of influenza A. The trimeric viral surface protein haemagglutinin (HA) of influenza A, which contains the host cell receptor binding site, is the primary focus of successful attack by natural antibodies; antibodies binding to the sister surface protein neuriminidase are not generally considered to prevent infection. HA is synthesized as a single polypeptide chain that subsequently cleaves into two chains, HA1 (328 amino acids) and HA2 (221 amino acids). The two chains are covalently attached by a disulfide bond (Wiley and Skehel, 1987).
HA's rapid evolution through nucleotide polymorphism allows it to escape antibody activity periodically through antigenic drift, leading to epidemics and requiring regular updates to the recommended vaccine composition [a separate mechanism, genetic reassortment between viral strains and between species, is usually responsible for the much larger antigenic shifts causing pandemics (Lamb and Krug, 2001)]. Influenza H3N2 has been the most frequently occurring subtype of influenza A in human infections over the last 40 years (Cox and Subbarao, 2000). Its HA component, H3, is antigenically distinguishable from that of other numbered subtypes (Skehel, 2009).
In the laboratory, the haemagglutinin inhibition (HI) test is used to characterize an influenza strain antigenically (WHO, 1953). Given an antiserum raised against influenza strain i, cij is the minimum serum concentration that is required to inhibit agglutination of viruses of strain j. In the HI test cij and cii are measured by diluting serum until agglutination no longer takes place (HI results are conventionally expressed as dilutions, but in keeping with more general chemical practice we will use concentrations in this summary). Burnet and Lush (1940) proposed the ratio
 |
(1) |
as an indicator of the potential effectiveness of a vaccine based on strain i in controlling a viral infection by strain j. If Rij is four or less then the vaccine is considered effective. This is known as the antigenic escape threshold. It should be noted that in general
 |
(2) |
The geometric mean of the above ratios (RijRji)1/2 was introduced by Archetti and Horsfall (1950) as a measure of antigenic variation and has been shown to be a superior predictor of vaccine effectiveness against a particular strain than simple concentration ratios (Ndifon et al., 2009).
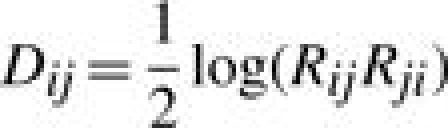
Lapedes and Farber (2001) demonstrated that a ‘shape space’ of low dimensionality can be constructed in which antisera and antigens are treated as points, with the distance between them (the ‘antigenic distance’) being linearly related to the logarithm of the concentration ratio. The equation
 |
(3) |
will be used in the current work as a measurement of antigenic distance between strains i and j.
Five regions of the HA1 monomer have been found to undergo mutations when the virus is cultured in the presence of monoclonal antibodies, eventually leading to antibody escape. These regions are presumed to encompass the sites at which antibodies bind to HA1 (Wiley and Skehel, 1987; Wiley et al., 1981; Wilson and Cox, 1990); they are conventionally labelled sites A to E. Another factor known to affect immunogenicity is the presence or absence of N-glycosylation sites (Skehel et al., 1984).
Modelling the antigenic distance between two influenza strains of the same subtype via amino acid sequence analysis can provide a rapid indication of the likelihood that an existing vaccine will protect against a newly identified strain, and also facilitates study of the virus's evolution in response to antibody pressure. An early proposal was that, to achieve antibody escape, a strain would have to develop at least one mutation in each of the five antigenic sites (Wiley et al., 1981). More recent models have focussed on the analysis of ‘immunodominant’ amino acid locations (Huang et al., 2009; Lee and Chen, 2004; Liao et al., 2008). The evolutionary selective pressure on specific locations has been shown to vary over time (Blackburne et al., 2008), suggesting that the significance of a specific location in determining the strength of the immune response may change over time.
Bush and co-workers drew up a list of 131 varying amino acid residues at or near the five antigenic sites (Bush et al., 1999), and this list of residues is used in a number of subsequent studies (see, for example, Blackburne et al., 2008; Lee and Chen, 2004; Plotkin and Dushoff, 2002; Smith et al., 2004). The list was developed by identifying locations at which amino acids had undergone variation across a sample of 357 HA1 sequences obtained from wild-type viruses between 1968 and 1999. These locations were mapped onto the protein using an X-ray crystal structure of the A/Aichi/2/68 strain (PDB 1HGD; Sauter et al., 1992). Variant residues at or near the five antigenic sites were included in the list provided that molecular modelling software demonstrated that the amino acid surface was exposed. Variant residues that were buried, or did not lie near to an antigenic site, were excluded from the list. (The exact criterion of ‘nearness’ for a residue to be included in the list is not specified in the referred paper.)
The approach taken in constructing this list of residues has two implications for bioinformatics researchers. Firstly, the list is de facto retrospective; residues that did not vary across the sample of 357 strains were not considered for inclusion. This limits the predictive power of antigenic models based on the set; if a strain is found that contains variations at as yet unconsidered locations, the new locations must be considered and if necessary added to the model before predictions are made. The second and related implication is that the list should be reviewed periodically in the light of newly identified varying locations.
In this article, we present the results of such a review, and develop antigenic models based on antibody binding site variations using both the original and extended lists of residues. In addition, we develop models using the extended list that are independent of the standard assumptions about the relevance of sites A to E.
2 METHODS
2.1 Assigning residues to antigenic sites
All available wild-type human H3N2 HA1 amino acid sequences of length 328 or greater were obtained from the NIAID BioHealthBase BRC (6624 in total) and aligned using MUSCLE (Edgar, 2004). The structure of the A/Aichi/2/68 HA trimer was obtained from the Protein Data Bank (PDB 1HGD; Sauter et al., 1992). Interface analysis of this structure was extracted from the European Bioinformatics Institute's Protein Interfaces, Surfaces and Assemblies server (PISA) (Krissinel and Henrick, 2007).
The co-ordinates of Cα atoms were obtained from the structure, and the Cα co-ordinates of those locations identified in the original list of 131 residues (Fig. 1a) were used to derive the range of each of the five antigenic sites in terms of their x-, y- and z-co-ordinates. All residues that had a non-zero exposed surface area in the trimeric structure as determined by PISA, varied between sequences and were outside the original set of 131 were then considered. Those whose Cα atom lay within 2 Å of the range of an antigenic site as calculated above was assigned to that site (the 2 Å tolerance makes some allowance for error and thermodynamic movement in the determined structure while maintaining the integrity of the sites as originally defined). Where, using these calculations, a residue lay in range of more than one antigenic site, it was assigned to the site containing the closest Cα atom to that under consideration.
Fig. 1.

Original and expanded set of antigenic residues. Antigenic residues shown on a single monomer of A/Aichi/2/68 HA1. (a) Original 131 residues in black, proposed additions in grey, others white. (b) Original and expanded residues in black, others in white.
2.2 Training and validation sets
For our study of model performance, we created a database of HI test results from a total of 46 published sources, including published papers and annual reports of WHO testing centres in the UK, the USA and Australia (references are given in the Supplementary Material). From this database, we derived a training dataset of Archetti and Horsfall distance measurements between strains isolated up to and including the year 2000, and a validation dataset of measurements between later strains, in both cases including just those strains for which HA1 gene sequences were available from Genbank. Samples isolated after 2000 giving abnormally low homologous titres (<1280) were eliminated in order to avoid known issues with mammalian cultured samples in the predominantly egg-based current testing environment (Hay et al., 2007). Pairwise samples between a pre- and post-2000 isolate were not included in either dataset. This strict segmentation focuses the evaluation on the prediction of novel strains in contrast to the approach taken by some other authors (Lee and Chen, 2004; Liao et al., 2008).
Having undertaken these steps, our training set comprised 203 samples (163 at or above the antigenic escape threshold and 40 below the threshold), and our validation set 90 samples (34 at or above the threshold and 56 below the threshold).
2.3 Linear models
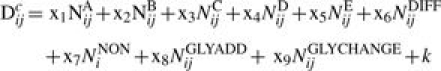
To explore the predictive power of models based on the data described above for the five canonical antigenic sites, together with any associated changes in glycosylation, we constructed linear models of the form:
 |
(4) |
Here Dcij is the calculated distance between the strains i and j, NAij…NEij are the number of residues that change in site A …E between strains i and j, NDIFFij is a count of the total number of antigenic sites that contain amino acid variations between the two strains, NNONij is a count of the number of amino acid residues outside the antigenic sites that vary between the strains.
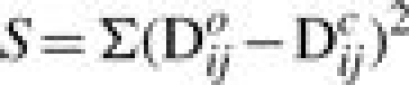
N-linked glycosylation occurs where an oligosaccharide chain is attached to asparagine in an amino acid sequence of the form Asn-X-Ser/Thr, where X is any amino acid apart from proline: this sequence is known as an N-glycosylation sequon (Marshall, 1974). NGLYADDij is the difference between the number of N-glycosylation sequons in strains i and j, and NGLYCHANGEij is a count of the number of sequons shared by strain i and strain j but differing in sequon composition. Variables x1 to x9 and a constant k are parameters determined by minimizing the least squares residual S given by
 |
(5) |
where Doij is the observed distance between the strains i and j, derived from the training dataset using Equation 3.
To gain some insight into the significance of dividing the antigenically active region of HA1 into five sites, we also tested a simpler model of the form:
 |
(6) |
This gives an identical weighting to changes at any of the five sites.
Finally, we modelled variation across all amino acid residues in the HA1 polymer:
| (7) |
Where NALL is the number of amino acids that change across all locations in the HA1 polymer, irrespective of whether or not they are associated with one of the canonical sites.
The models in Equations 4, 6 and 7 are referred to as the ‘5 site’, ‘1 site’ and ‘whole monomer’ models respectively.
Although the preceding models give a sense of whether five sites have more predictive power than one or zero, they do not investigate whether these canonical sites are significant in themselves. Consequently we tested several additional control models of the general form given in equation 4 above, but with the ‘antigenic sites’ positioned without reference to the canonical locations and with the number of terms varying according to the chosen number of artificial sites. Amino acids determined by PISA to have non-zero solvent surface area were allocated to these artificial sites depending on the distance of their Cα atom in the A/Aichi/2/68 structure from the Cα atom of residue 158 (GLY), which is at the extreme membrane-distal end of the monomer. In models M1–M7, the artificial sites were constrained to amino acids within 70 Å of residue 158, covering the complete region occupied by the five sites in the 131-residue and 241-residue sets. In models M8 and M9, the artificial sites extend over nearly the entire length of the monomer (100 Å from site 158). The boundary ranges of these artificial sites are shown in Table 1.
Table 1.
The range of artificial sites
| Model name and extent of artificial sites | ||||||||
|---|---|---|---|---|---|---|---|---|
| M1 | M2 | M3 | M4 | M5 | M6 | M7 | M8 | M9 |
| 0–30 | 0–20 | 0–15 | 0–10 | 0–8 | 0–7 | 0–6 | 0–20 | 0–10 |
| 30–70 | 20–40 | 15–30 | 10–20 | 8–16 | 7–14 | 6–12 | 20–40 | 10–20 |
| 40–70 | 30–50 | 20–30 | 16–25 | 14–23 | 12–20 | 40–60 | 20–30 | |
| 50–70 | 30–50 | 25–40 | 23–33 | 20–28 | 60–80 | 30–40 | ||
| 50–70 | 40–55 | 33–45 | 28–38 | 80–100 | 40–50 | |||
| 55–70 | 45–57 | 38–48 | 50–60 | |||||
| 57–70 | 48–58 | 60–70 | ||||||
| 58–70 | 70–80 | |||||||
| 80–90 | ||||||||
| 90–100 | ||||||||
The range of each site measured in Angstroms from residue 158 for each of the control models implemented for this article.
2.4 Performance metrics
All models were tested on their ability to successfully predict ‘escapees’, i.e. those pairs where the antigenic distance between two strains was above the antigenic escape threshold (log−1 Dab=4). Performance was evaluated according to the criteria described below, each expressed as a percentage, where tp is the number of true positives, tn is the number of true negatives, fp is the number of false positives and fn is the number of false negatives.
Sensitivity is the ability of the model to forecast escapees in the validation set, given by:
 |
(8) |
Specificity is the ability of the model to forecast non-escapees in the validation set, given by:
 |
(9) |
The Matthews correlation coefficient (MCC) provides a balanced measure of a model's ability to make accurate predictions for the validation set, one that penalizes both false positives and false negatives (Matthews, 1975). It is given by the following formula:
 |
(10) |
For comparison, we include in our results the performance of a multiple regression model published by Liao et al. (2008), using 20 immunodominant amino acid locations identified in that work and grouping changes by method GM6 as described by the authors.
2.5 Elimination of false positives
The linear models considered here, in common with many reported by others (Lee and Chen, 2004; Liao et al., 2008; Huang et al., 2009), correctly identify the vast majority of escapees (high sensitivity), but tend to overpredict the number of escapees (relatively lower specificity).
On examination of the results, we observed a high number of false positives among those samples with relatively few mutations in the regions under consideration. To create a model with more balanced predictive properties, we therefore introduced a screening step, in which all positive results were examined, and those which had fewer than a specified ‘cutoff’ number of amino acid changes in the regions under consideration were rejected. Given that there is a high correlation between the number of changes and the antigenic distance (Lee and Chen, 2004), this appears a reasonable step to take.
3 RESULTS
3.1 Assignment of residues
Across our sample of 6624 sequences, only 19 residues in the HA1 polymer exhibited no variation. A further 20 showed variation only in samples isolated in years 2000–2009, and 23 showed variation only in samples isolated in years 1968–1999. Of the 19 sites exhibiting no variation, 3 are classified by PISA as buried, leaving 16 residues with exposed surface area invariant across all samples (Table 2).
Table 2.
Our classification of HA1 amino acid residues
| Number of residues | Classification |
|---|---|
| 131 | Previously identified antigenic residues (including five classified by PISA as buried). |
| 16 | Additional residues classified by PISA as buried. |
| 16 | Surface exposed residues invariant across all samples. |
| 109 | Additional residues assigned to antigenic sites. |
| 56 | Variant residues distant from antigenic sites (and therefore not assigned). |
| =328 | Total amino acid residues in the HA1 polymer. |
Where a residue could potentially be assigned to more than one site it was assigned to the site with the nearest Cα atom (see Table 3).
Table 3.
The assignment of amino acid residues to five antigenic sites
| Site | Previously identified residues | Proposed additional assignments |
|---|---|---|
| A | 122, 124, 126, 130–133, 135, 137, 138, 140, 142–146, 150, 152, 168 (n = 19) | 71–72, 98, 127, 141, 148–149, 151, 255 (n = 28) |
| B | 128, 129, 155–160, 163–165, 186–190, 192–194, 196–198 (n = 22) | 161–162, 199 (n = 25) |
| C | 44–48, 50, 51, 53, 54, 273, 275, 276, 278–280, 294, 297, 299, 300, 304, 305, 307–312 (n = 27) | 41–43, 49, 52, 55, 271–272, 274, 282, 284–285, 287–293, 295–296, 298, 301–303, 313–314 (n = 54) |
| D | 96, 102, 103, 117, 121, 167, 170–177, 179, 182, 201, 203, 207–209, 212–219, 226–230, 238, 240, 242, 244, 246–248 (n = 41) | 95, 97, 99–101, 104–105, 107, 118, 120, 166, 169, 178, 180, 183–184, 200, 204–206, 210–211, 220–225, 231–236, 239, 243, 245, 257–258 (n = 80) |
| E | 57, 59, 62, 63, 67, 75, 78, 80–83, 86–88, 91, 92, 94, 109, 260–262, 265 (n = 22) | 56, 58, 60, 64–65, 68–70, 73–74, 76–77, 79, 84–85, 89–90, 93, 110–115, 119, 259, 263–264, 267–270 (n = 54) |
The assignment of amino acid residues (that vary between strains) in HA1 to the five canonical antigenic sites. The total number of residues belonging to a given site is given in brackets.
Figure 1 shows the locations of the antigenic sites with the original set of 131 residues and our revised set of 241 residues. As can be seen, the effect of increasing the number of residues is to extend the defined sites so that they almost completely cover the membrane-distal end of the protein chain, with the remaining gaps comprising buried and invariant locations.
3.2 Performance of antigenic models
The results of training and evaluating our linear models (as specified in section 2.3-2.5) using the datasets described in Section 2.2 have several striking features (Table 4). Firstly, the multi-site models produced significantly better performance (in terms of both specificity and MCC) than their 1 site and whole monomer counterparts. An analysis of the coefficients x1 … x9 reveals contribution of all parameters to the predictive power of the model, demonstrating that antigenic distance is related to concurrent change in multiple regions of the HA1 monomer and indicating the need for some division of the monomer into sites or regions in order to obtain predictive power.
Table 4.
Antigenic model performance
| Model | Sites | Sensitivity | Specificity | MCC |
|---|---|---|---|---|
| Original 131 residues | 5 | 88 | 54 | 42 |
| Original 131 residues | 1 | 82 | 36 | 19 |
| Proposed 241 residues | 5 | 100 | 38 | 43 |
| Proposed 241 residues | 1 | 100 | 9 | 19 |
| Whole monomer | – | 100 | 0 | NaN |
| M1 | 2 | 100 | 38 | 43 |
| M2 | 3 | 100 | 48 | 51 |
| M3 | 4 | 97 | 48 | 47 |
| M4 | 5 | 97 | 57 | 55 |
| M5 | 6 | 100 | 52 | 54 |
| M6 | 7 | 100 | 48 | 51 |
| M7 | 8 | 85 | 59 | 43 |
| M8 | 5 | 100 | 48 | 51 |
| M9 | 10 | 91 | 64 | 54 |
| After Liao et al. (see text) | – | 83 | 73 | 54 |
The performance of the antigenic models described in Section 2.3 without screening as specified in Section 2.5 measured using the metrics defined in Section 2.4 (all of which are percentages).
Secondly, the MCC of our unscreened 241-residue models is within 1% of the 131-residue models, while their sensitivity is significantly increased. The former are able to predict a greater number of the escapees, indicating that the additional positions have antigenic activity, but the rate of false positives is also increased.
Thirdly, and perhaps most significantly, the MCCs of all the novel ‘artificial site’ models are higher than those based on the five canonical sites, and in several instances significantly higher (around 12 percentage points). These results suggest that epitopes are not confined to the canonical sites. Indeed, the performance of the M8 and M9 models, both of which take into account the largest number of surface residues (ranging up to 100 Å from the distal end of the molecule), suggests that epitopes may be located at points further towards the proximal end of the monomer than previously identified.
The screening step described in Section 2.5 can improve the overall performance of all models at the expense of some sensitivity. By varying the cutoff between 0 and 10, we obtained MCC values of between 53% and 62%, with sensitivities between 97% and 74%, and specificities between 57% and 80% (Fig. 2). This demonstrates an ability to create a predictive model with the desired balance between sensitivity and specificity for a particular application.
Fig. 2.

Receiver operating characteristic (ROC) curves for selected models. ROC curve (Metz, 1978) for models M4, M5 and the 131 location 5 site model (131–5), obtained by applying the screening step described in Section 2.5, with cutoff values between 0 and 10.
One possible explanation for the high rate of false positives obtained by the linear models is that antigenic escape requires amino acid variations at locations across a substantial proportion of the docking area of an antibody. As can be seen from the few available antibody docking X-ray studies, this area can be extensive, spanning two or even three of the five antigenic sites identified from monoclonal antibody studies—see PDB 1EO8 (Fleury et al., 2000) (Fig. 3) and PDB 2VIR (Fleury et al., 1998) (Fig. 4). Variation at sufficiently widespread locations would be a necessary but not a sufficient condition for escape, since variation at locations outside the docking area would have no effect. All model types we have discussed will be sensitive to the area over which variations are spread, either through the count of ‘antigenic sites’ experiencing variation, or through the count of ‘antigenically critical residues’ that vary, which are typically spread widely across the surface region (see for example Fig. 3 in Huang et al., 2009).
Fig. 3.

The HA1/antibody interface for structure PDB 1EO8. The antibody is shown in grey. The 241 residues from our extended list are in black, other HA residues in white.
Fig. 4.

The HA1/antibody interface for structure PDB 2VIR. The antibody is shown in grey. The 241 residues from our extended list are in black, other HA residues in white.
This mechanism would explain why better predictive performance is obtained in this study by multi-site models compared to single or zero site models. It would also explain the larger number of false positives seen in the 241-residue model compared to the 131-residue model, as, with the larger number of residues in the former, there is greater opportunity for the model to be misled by mutations outside the antibody docking area.
Neutral mutations outside any current antibody binding site could also lead to false positives. If, as we suggest, there are no fixed sites, the type of model we have studied would have no ability to distinguish such mutations.
The ability of the best ‘artificial sites’ models to identify vaccine escape exceeds that of the ‘immunodominant sites’ model that we have referenced when run on our dataset (MCC 62% against 54%). The relatively lower performance of the referenced model presented here as compared to that previously published [sensitivity 83%, specificity 73% against previously published results of sensitivity 95%, specificity 80% (Liao et al., 2008)] underlines the comparative difficulty of predicting novel strains: not only have we strictly segregated reference strains between training and validation sets, but also we have selected a cutoff year between training and validation sets that is close to an antigenic cluster transition. By changing the cutoff year and relaxing the strict segregation, we can reproduce results that match those previously published with the reference model and performance of our ‘artificial sites’ models improves correspondingly.
4 DISCUSSION
In this article, we have presented an updated set of varying amino acid residues close to the five antigenic sites identified in the 1980s by monoclonal antibody studies, using the same mechanism that was used to produce the original set, but taking advantage of the much larger number of HA1 sequences now available (6624 compared to the original 357). The amount of the surface covered by this much larger set, plus the analysis of the predictive models we have presented, lends support to the idea that neutralizing antibody epitopes can occur at many points within 70 Å, or even 100 Å, of the distal end of the HA1 monomer.
The models we have described are simple in their approach, and we believe that their performance can be further extended by incorporating more sophisticated measures of the region and density of amino acid variation. Likewise, while we have focussed on the H3 subtype of Influenza A, we anticipate that the approach would extend to other subtypes of interest such as H1 and H5. Our ‘artificial sites’ approach is particularly promising as it is not inherently data dependent; all surface residues within a given range of the distal end of the HA1 molecule can be incorporated irrespective of whether they have been shown to vary within existing strains. Use of the models could be combined with the use of an ‘immunodominant sites’ model to provide sensitivity both towards previously observed and as yet unmodelled variation.
Given the comparatively large surface area of interface between HA1 and an antibody observed in the referenced X-ray studies, it is likely that antigenic escape requires antibody mutations across an equally large area. The requirement for mutations to be distributed across such an area can be seen as a side effect of current predictive models of both the ‘antigenic site’ and ‘antigenically critical residue’ types. Whether such models are based on any deeper biological mechanisms is still to be determined—there may or may not turn out to be particular regions of HA1 to which antibodies bind—however, we have presented evidence from our models that they are not clearly delineated by the canonical five sites, and indeed this is supported by the two X-ray studies cited.
Current models tend to produce significant numbers of false positives. We have demonstrated the ability of a screening step to create a model with more balanced predictive powers and better overall performance, at the expense of reduced sensitivity. It may be possible to improve performance further by developing methods capable of relating the spatial relationship between mutated residues to the shape of potential epitopes at a given location.
Supplementary Material
ACKNOWLEDGEMENTS
Data was obtained from the NIAID BioHealthBase BRC online through the website at http://www.biohealthbase.org/. Linear models were developed in R (http://www.r-project.org). Figures were rendered in Jmol (an open-source Java viewer for chemical structures in 3D. http://www.jmol.org). The RCSB PDB is available at http://www.rcsb.org/pdb/. We are grateful to Dr Clare Sansom for helpful discussions. We are grateful to reviewers for helpful comments received, particularly in relation to refinement of the model. The BioHealthBase Bioinformatics Resource Center has been wholly funded with federal funds from the National Institute of Allergy and Infectious Diseases, National Institutes of Health, Department of Health and Human Services, under Contract No. HHSN266200400041C.
Conflicts of Interest: none declared.
REFERENCES
- Archetti I, Horsfall FL. Persistent antigenic variation of influenza A viruses after incomplete neutralization in ovo with heterologous immune serum. J. Exp. Med. 1950;92:441–462. doi: 10.1084/jem.92.5.441. [DOI] [PMC free article] [PubMed] [Google Scholar]
- Blackburne BP, et al. Changing selective pressure during antigenic changes in human influenza H3. PLoS Pathog. 2008;4:e1000058. doi: 10.1371/journal.ppat.1000058. [DOI] [PMC free article] [PubMed] [Google Scholar]
- Burnet FM, Lush D. The action of certain surface active agents on viruses. Aust. J. Exp. Biol. Med. Sci. 1940;18:48. [Google Scholar]
- Bush RM, et al. Positive selection on the H3 hemagglutinin gene of human influenza virus A. Mol. Biol. Evol. 1999;16:1457–1465. doi: 10.1093/oxfordjournals.molbev.a026057. [DOI] [PubMed] [Google Scholar]
- Bush RM, et al. Predicting the evolution of human Influenza A. Science. 1999;286:1921–1925. doi: 10.1126/science.286.5446.1921. [DOI] [PubMed] [Google Scholar]
- Edgar RC. MUSCLE: multiple sequence alignment with high accuracy and high throughput. Nucleic Acids Res. 2004;32:1792–1797. doi: 10.1093/nar/gkh340. [DOI] [PMC free article] [PubMed] [Google Scholar]
- Fleury D, et al. Antigen distortion allows influenza virus to escape neutralization. Nat. Struct. Biol. 1998;5:119–123. doi: 10.1038/nsb0298-119. [DOI] [PubMed] [Google Scholar]
- Fleury D, et al. Structural evidence for recognition of a single epitope by two distinct antibodies. Proteins. 2000;40:572–578. [PubMed] [Google Scholar]
- Frank SA. Immunology and Evolution of Infectious Disease. Princeton and Oxford: Princeton University Press; 2002. [PubMed] [Google Scholar]
- Hay AJ, et al. Characteristics of Human Influenza AH1N1, AH3N2 and B viruses isolated February to August 2007. London: WHO Collaborating Centre for Reference and Research on Influenza; 2007. Available: http://www.nimr.mrc.ac.uk/wic/report/interim_report_sep_2007.pdf (Accessed 5 October 2009) [Google Scholar]
- Huang J, et al. Co-evolution positions and rules for antigenic variants of human influenza A/H3N2 viruses. BMC Bioinformatics. 2009;10(Suppl. 1):S41. doi: 10.1186/1471-2105-10-S1-S41. [DOI] [PMC free article] [PubMed] [Google Scholar]
- Krissinel E, Henrick K. Inference of macromolecular assemblies from crystalline state. J. Mol. Biol. 2007;372:774–797. doi: 10.1016/j.jmb.2007.05.022. [DOI] [PubMed] [Google Scholar]
- Lapedes A, Farber R. The geometry of shape space: application to influenza. J. Theor. Biol. 2001;212:57–69. doi: 10.1006/jtbi.2001.2347. [DOI] [PubMed] [Google Scholar]
- Lamb RA, Krug RM. Orthomyxoviridae: the viruses and their replication. In: Knipe DM, Howley PM, editors. Fields Virology. Philadelphia: Lippincott-Raven; 2001. pp. 1487–1531. [Google Scholar]
- Lee M, Chen JS. Predicting antigenic variants of influenza A/H3N2 viruses. Emerg. Infect. Dis. 2004;10:1385–1390. doi: 10.3201/eid1008.040107. [DOI] [PMC free article] [PubMed] [Google Scholar]
- Liao Y, et al. Bioinformatics models for predicting antigenic variants of influenza A/H3N2 virus. Bioinformatics. 2008;24:505–512. doi: 10.1093/bioinformatics/btm638. [DOI] [PubMed] [Google Scholar]
- Marshall RD. The nature and metabolism of the carbohydrate-peptide linkages of glycoproteins. Biochem. Soc. Symp. 1974;40:17–26. [PubMed] [Google Scholar]
- Matthews BW. Comparison of the predicted and observed secondary structure of T4 phage lysozyme. Biochim. Biophys. Acta. 1975;405:442–451. doi: 10.1016/0005-2795(75)90109-9. [DOI] [PubMed] [Google Scholar]
- Metz CE. Basic principles of ROC analysis. Semin. Nucl. Med. 1978;8:283–298. doi: 10.1016/s0001-2998(78)80014-2. [DOI] [PubMed] [Google Scholar]
- Ndifon W, et al. On the use of hemagglutination-inhibition for influenza surveillance: surveillance data are predictive of influenza vaccine effectiveness. Vaccine. 2009;27:2447–2452. doi: 10.1016/j.vaccine.2009.02.047. [DOI] [PubMed] [Google Scholar]
- Plotkin JB, Dushoff J. Codon bias and frequency-dependent selection on the hemagglutinin epitopes of influenza A virus. Proc. Natl Acad. Sci. USA. 2003;100:7152–7157. doi: 10.1073/pnas.1132114100. [DOI] [PMC free article] [PubMed] [Google Scholar]
- Sauter NK, et al. Binding of influenza virus hemagglutinin to analogs of its cell-surface receptor, sialic acid: analysis by proton nuclear magnetic resonance spectroscopy and X-ray crystallography. Biochemistry. 1992;31:9609–9621. doi: 10.1021/bi00155a013. [DOI] [PubMed] [Google Scholar]
- Skehel J. An overview of influenza haemagglutinin and neuraminidase. Biologicals. 2009;37:177–178. doi: 10.1016/j.biologicals.2009.02.012. [DOI] [PubMed] [Google Scholar]
- Skehel JJ, et al. A carbohydrate side chain on hemagglutinins of Hong Kong influenza viruses inhibits recognition by a monoclonal antibody. Proc. Natl Acad. Sci. USA. 1984;81:1779–1783. doi: 10.1073/pnas.81.6.1779. [DOI] [PMC free article] [PubMed] [Google Scholar]
- Smith DJ, et al. Mapping the antigenic and genetic evolution of Influenza Virus. Science. 2004;305:371–376. doi: 10.1126/science.1097211. [DOI] [PubMed] [Google Scholar]
- Wiley DC, Skehel JJ. The structure and function of the hemagglutinin membrane glycoprotein of influenza virus. Annu. Rev. Biochem. 1987;56:365–394. doi: 10.1146/annurev.bi.56.070187.002053. [DOI] [PubMed] [Google Scholar]
- Wiley DC, et al. Structural identification of the antibody-binding sites of Hong Kong influenza haemagglutinin and their involvement in antigenic variation. Nature. 1981;289:373–378. doi: 10.1038/289373a0. [DOI] [PubMed] [Google Scholar]
- Wilson IA, Cox NJ. Structural basis of immune recognition of influenza virus hemagglutinin. Annu. Rev. Immunol. 1990;8:737–771. doi: 10.1146/annurev.iy.08.040190.003513. [DOI] [PubMed] [Google Scholar]
- World Health Organization. First Report of the Expert Committee on Influenza. World Health Organization Technical Report Series. 1953 No. 64. [PubMed] [Google Scholar]
- World Health Organization. Influenza. WHO Fact Sheet No 211 revised April 2009. 2009 Available: http://www.who.int/mediacentre/factsheets/fs211/en/ (Accessed 5 October 2009) [Google Scholar]
Associated Data
This section collects any data citations, data availability statements, or supplementary materials included in this article.