Abstract
Dynamic field gradient focusing uses an electric field gradient to separate and concentrate proteins in native buffers. A prototype preparative-scale dynamic field gradient focusing apparatus reproducibly separated hemoglobin and bovine serum albumin with a mean resolution of 2.64 ± 0.503. Run-to-run variations in the hemoglobin’s focal point and peak width appeared to be related to fluctuations in the shape of the electric field, rather than the 5% accuracy of the pump that provided the counter-flow in the separation annulus. The variation in the electric field gradient was probably due to the formation and expansion of an ion-depleted region at the top of the separation annulus.
Keywords: Dynamic field gradient focusing, Electric field gradient focusing, Equilibrium-gradient method, Preparative electrophoresis
1 Introduction
Dynamic field gradient focusing (DFGF) is an equilibrium-gradient method [1] for separating proteins, or other charged species, according to their electrophoretic mobilities using the combination of an adjustable electric field gradient and an opposing counter-flow. The adjustable electric field gradient allows the resolution of the separation to be changed during the course of the run, which should facilitate separating analytes with similar mobilities [2], Such flexibility would be very useful for separating protein isoforms that have small differences in electrophoretic mobility due to differences in primary structure, glycosylation, phosphorylation, acetylation, and so forth. Proteins with similar mobilities will overlap with one another when initially focused in steep gradients; but they can be individually resolved by decreasing the slope of the electric field [2]. Successful protein separations using analytical-scale DFGF [2, 3] prompted the development of a preparative-scale DFGF apparatus [4, 5].
This report describes the use of a prototype preparative-scale DFGF apparatus to separate bovine hemoglobin (Hb) and FITC-BSA. Attempting more complicated separations, e.g. between protein isoforms, at this stage in the preparative-scale DFGF apparatus’ development would hinder progress by introducing more uncertain factors that could mask o confound problems with the instrument. Using a relativel simple, benchmark separation reduces the number of variables involved in trying to understand and characterize th performance of the preparative-scale DFGF apparatus.
The mathematics that describes field gradient focusin [6, 1], whether in dynamic [2, 4, 7] or stationary [8, 9] electri fields, shows that it is an equilibrium-gradient method [1] and is therefore similar to techniques like IEF and density gradient sedimentation [1, 6]. These techniques all utilize net force that reverses direction at some point in the separation chamber to focus proteins, or other analytes, at the poin in the chamber where each protein’s net velocity is zero. A shown in Fig. 1, the net force in DFGF arises from the interaction of an electric field gradient and a constant counter-flow of buffer acting on the proteins. The buffer pushes all proteins up a vertically oriented separation chamber at the same velocity. Simultaneously, the electric field gradient pushes each protein down the chamber with a velocity equa to the product of that protein’s electrophoretic mobility and the local electric field. The net velocity causes the proteins to migrate to their individual focal points where the downward velocity imparted by the electric field gradient equals the upward velocity of the counter-flow buffer. The dynamic nature of the computer-controlled electric field gradient allows the operator to move the focal points further apart in the separation chamber, should focused peaks of protein overlap.
Figure 1.
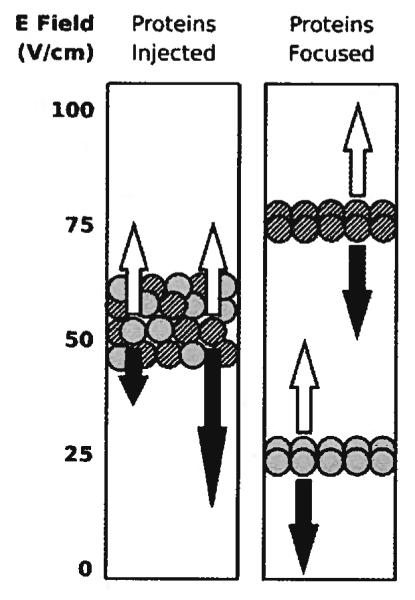
The vertical electric field gradient pushes each protein down the separation chamber with a velocity (black arrows) proportional to the product of the field strength and the protein’s electrophoretic mobility. A counter-flow buffer pumped into the bottom of the separation chamber pushes the proteins back up the chamber at a uniform velocity (white arrows). Proteins focus at the height in the chamber where the two velocities are equal. The mobility of the solid gray protein exceeds the mobility of the striped protein, so the gray protein focuses at a lower height in the separation chamber.
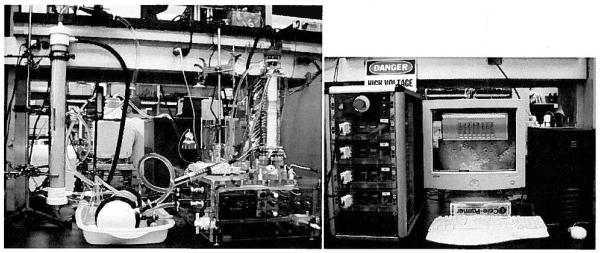
A complete comparison of the preparative-scale DFGF apparatus, shown in Fig. 2, to all other preparative electrophoresis instruments would require a review beyond th scope of this report. Two reviews of commercially available preparative electrophoresis equipment were written by Righetti and co-workers [10, 11], The reviews do not compare the noncommercial vortex-stabilized electrophoresis chamber [12], which served as the basis for the design of the preparative-scale DFGF chamber [4, 5]. Two other papers [12, 13] do mention how the vortex-stabilized electrophoresis chamber differs from earlier preparative electrophoresis instruments. We draw from references [4, 5, 10–13] to briefly illustrate the primary differences between the preparative-scale DFGF chamber and other preparative electrophoresis instruments.
Figure 2.
The preparative-scale DFGF apparatus consists of the equipment shown in the left and right panels. The right side of the left panel shows the clear, acrylic separation tower containing the ceramic rotor. The gap between the inner wall of the separation tower and the outer wall of the rotor forms the separation annulus, which contains some protein in this picture. The tower mounts to a clear, acrylic base that contains a motor that turns the rotor and fluid connections to the lumen of the rotor. The far left of the left panel shows the degassing unit, behind which stands a 20-L reservoir for the cooling buffer that flows through the degassing unit, then on through the heat exchanger laying on the bench to the right of the degassing unit, into the acrylic base, up through the rotor, then back down through the base, and finally back into the reservoir. The panel on the right shows the computer-controlled, multi-channel power supply that connects to the top of the separation tower and generates the variable electric field gradient on the array of electrodes located within the rotor’s lumen.
The preparative-scale DFGF apparatus distinguishes itself from other preparative electrophoresis instruments in two main ways. First, none of the other thin-film, recycling, or rotating preparative electrophoresis instruments perform DFGF, although some can be used for IEF [10, 11], Secondly, the purpose of rotation in the vortex-stabilized electrophoresis chamber and the preparative-scale DFGF chamber differs from the other annular, rotating instruments: the Biostream and Rotofor. In both, the vortex-stabilized electrophoresis chamber [12] and the preparative-scale DFGF chamber [4, 5], the inner wall of the vertical annulus turns within a stationary outer wall in order to generate counter-rotating vortex pairs that reduce axial dispersion in the direction of the separation at the cost of radial mixing. In contrast to this, the outer wall of the Biostream rotates to provide shear stabilization within a vertical annulus for separations that take place radially [12, 13]. Generating counter-rotating vortices in the Biostream would actually disrupt the shear-stabilized laminar flow through the device [13] and prevent proteins from separating [12]. The inner and outer walls of the Rotofor’s horizontal, annular chamber slowly rotate together to help distribute the cooling effect of the cold-finger that chills the inner wall [12].
The technique of DFGF differs from IEF in a few practical ways. Dynamic field gradient focusing relies on a computer-controlled, multi-channel power supply and a pump, rather than carrier ampholytes and a pH gradient, to generate the gradient for separating proteins. This eliminates the need for testing many catholyte and anolyte buffers and concentrations to try to minimize gradient drift [14], The buffer for DFGF only needs to have a low-conductivity (0.032 S/m or less [5]) and satisfy the solubility requirements of the proteins being separated. Separating and focusing proteins by their electrophoretic mobilities in native buffers using DFGF avoids the precipitation problem inherent in focusing proteins at their pIwhere they are often least soluble. Enhancing the resolution of IEF separations requires harvesting the samples of interest and re-running them in a shallower gradient [15], but the resolution of DFGF separations is adjustable during the run [2]. For example, the resolution between two proteins can be increased by changing the buffer’s pH to increase the difference in mobility between two proteins [2], or the slope of electric field gradient could be decreased to move the focal points of the two proteins further apart [2].
2 Materials and methods
2.1 Chemicals
The following chemicals were used in the protein separations: CTAB, bovine Hb (product no. H-2500), and BSA (product no. A-7906) were purchased from Sigma-Aldrich (St. Louis, MO). The BSA was labeled with FITC according to the instructions in the kit (F-6434) from Molecular Probes (Eugene, OR), and frozen in aliquots for later use. The kit also contained instructions for determining the extent of labeling by measuring the absorbance of FITC at 494 nm. The BSA molecules had approximately 1 FITC each. Tris base was bought from Fisher Scientific (Fair Lawn, NJ) and SDS from Bio-Rad Laboratories (Hercules, CA). The glacial acetic acid was purchased from J.T. Baker (Mallinckrodt Baker, Phillipsburg, NJ). The water used throughout the experiments came from a Bamstead Thermolyne (Dubuque, IA) Nanopure Infinity UV/UF system.
The working buffer for the separation experiments was prepared 30 L at a time. Each batch of buffer contained 10 mM Tris, 0.105 mM CTAB, 0.035 mM SDS, and 2.841 mL glacial acetic acid dissolved in Nanopure water. The buffer’s conductivity was 120 μS/cm and its pH was 8.8, both measured at 25°C. Each batch of buffer was split into volumes of 20 L for cooling the rotor, 9.5 L for purging the electrolysis gas in the stator electrode housings, and 250 mL for providing the counter-flow. The remaining 250 mL of buffer was used for preparing protein samples, rinsing the separation chamber, and purging air bubbles from the separation chamber.
Gels for SDS-PAGE were prepared using SDS, acrylamide, and bis-acrylamide purchased from Bio-Rad; ammonium persulfate and TEMED from Sigma-Aldrich; Tris base from Fisher Scientific; and hydrochloric acid from J.T. Baker. The glycine in the running buffer was purchased from Sigma-Aldrich. The TCA used in the fixative was bought from J.T. Baker. Components for the staining solution [16] were purchased from Bio-Rad (CBB G-250dye), J.T. Baker (methanol), and Sigma-Aldrich (phosphoric acid and ammonium sulfate).
2.2 Equipment
The preparative-scale DFGF apparatus (Fig. 2) used to separate proteins in this work is described in detail in a previous paper [5]. Only a brief description of the main aspects follows here. The vertical annular separation chamber where proteins were separated was formed between a membrane-coated, porous, boron-nitride rotor and a grooved, acrylic stator. The combination of the rotating inner wall (60 rotations/min) and stationary, grooved outer wall formed stable, counter-rotating vortex pairs. These vortices reduced axial convection to about 2 · 10−8 m2 //s at the expense of radially mixing the contents of the separation annulus. A counter-flow buffer pumped into the bottom of the annular separation chamber pushed proteins up the chamber while an electric field gradient pushed them back down the chamber, creating the net force that caused proteins to focus in the separation chamber.
The electric field gradient in the separation annulus was generated by setting the electric potential on an array of 32 electrodes in the lumen of the porous rotor. Each electrode on the array is connected to 1 of the 32 channels of an external, computer-controlled power supply, shown in Fig. 2. Electric current flowed from the electrodes inside the rotor’s lumen, through the porous rotor and membrane, up through the separation annulus, and then into a pair of cathodes located in the top of the stator. Purge buffer flowed over the stator electrodes to remove gas bubbles formed by electrolysis. Dialysis membranes (6 kDa MWCO) prevented bulk fluid flow between the separation annulus and the purge buffer. Chilled and degassed buffer flowing up through the rotor’s lumen removed electrolysis gases generated on the electrode array and cooled the separation annulus. A digital video camera (model DCR-PC120BT, Sony Electronics, Oradell, NJ) was used to record the positions of the proteins over the course of the experiment. A set of 24 syringes, each 1.06 cm apart, spanned the separation annulus from 2.45 to 26.9 cm and were used to collect samples at the end of the runs. Gels for sample analysis were run using a Bio-Rad Mini PROTEAN 3 Cell and an E-C 600 power supply (E-C Apparatus Corporation, St. Petersburg, FL).
2.3 Focusing procedure and sample collection
The three experimental runs were carried out on separate days, with 30 L of fresh working buffer each day. The focusing procedure described in a previous paper [5] was followed with one change: 7 mg each of Hb and FITC-BSA dissolved in 1 mL of working buffer were injected into the center of the annular separation chamber instead of just 10 mg of Hb.
Samples were collected from the separation chamber after the proteins had focused for 2 h because the protein bands seemed to have stopped moving, i.e. they reached their focal points by that time. Small 0.3-mL samples were collected in order to minimize band spreading during sample collection, which had been a problem in previous experiments [5]. Sample 1, the first of 24 samples, was withdrawn using the uppermost syringe near the top of the chamber. Then, the second 0.3-mL sample was collected using the second syringe from top of the chamber. Sample collection continued in this fashion with the third syringe from the top and progressed on down to the 24th and final syringe at the bottom of the separation annulus.
2.4 Sample analysis
Sample purity was examined using SDS-PAGE to verify that the Hb and FITC-BSA were separated. Ten percent acrylamide gels were prepared according to instructions given on pages 15–18 of Hoefer Mighty Small II Manual (San Francisco, CA). Samples were diluted 50:50 with sample treatment buffer. The gels were run at 10 mA and 1 W until the bromophenol blue from the sample treatment buffer reached the bottom of the gel (approximately 1.25 h).
The gels were bathed in fixative (20% w/v TCA in water) for an hour prior to staining for 15 h in a CBB G-250 solution [16]. The gels were then washed for 30 min prior to placing them on a fluorescent light box and digitally photographing them with an Olympus D-460 camera (Olympus Optical, Tokyo, Japan).
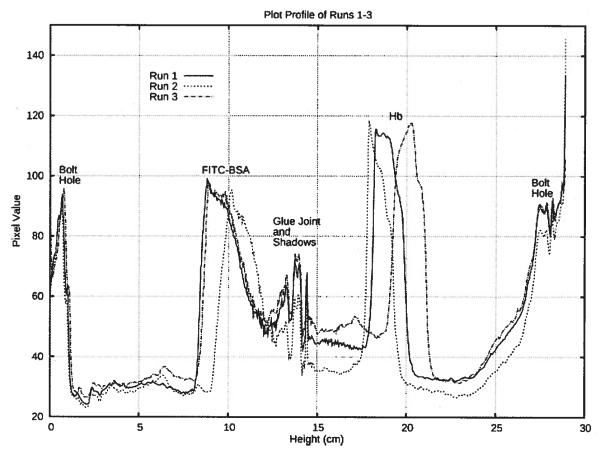
Figure 3, the plot profile of the focused protein bands, was prepared from video footage of each experimental run for calculating the focused band resolution. The video footage was passed from the camera to Windows Movie Maker (v5.1, Microsoft, Redmond, WA) to make an uncompressed *.avi file. The uncompressed *.avi file was opened in VirtualDub (vl.6.10, http://www.virtualdub.org/), a video editing program. The video was forwarded to a frame 1 s before samples were collected. The frame was copied and pasted into Photoshop 5.5 (Adobe Systems Incorporated, San Jose, CA) where it was rotated, cropped and saved as a *.tif file. The *.tif image was opened in ImageJ (U. S. National Institutes of Health, Bethesda, MA) and scaled so that the pixel height of the white ceramic rotor corresponded to the rotor’s physical height of 29.083 cm. The color of the *.tif image was inverted so that the plot profile produced peaks, rather than troughs, where the protein bands were located. The vertical plot profile assigned a horizontally averaged pixel value within an area 16 pixels wide and 634 pixels tall centered on the rotor.
Figure 3.
The plot profile from each run shows the focused FITC-BSA and Hb bands near 9 and 19 cm, respectively. The peaks at 0 and 27 cm are from bolt holes that cross in front of the separation annulus, while the glue joint and its shadows can be seen at 13 cm, between the two protein peaks.
According to Giddings [1], the resolution, Rs, for adjacent peaks in an equilibrium-gradient method is
| (1) |
where ΔZ is the distance between peak centers and a σAvg is the average SD in width of the two peaks. We took the average SD to be
| (2) |
where the subscripts indicate to which protein the SD belongs. The SD in width for each peak was calculated from the peak width at half-height, wh, for each peak, assuming that the peaks were Gaussian, using the formula [17]
| (3) |
The peak height for the FITC-BSA, HBSA, was calculated as the difference between the maximum peak height and the baseline to the left of the FITC-BSA peak. Hemoglobin’s peak width, HHb, was the difference between the maximum peak width and the baseline to the right of the Hb peak. The protein tended to adsorb to the surface of the membrane and discolor it, making the baseline between the peaks higher than would be expected in a region with no protein in free solution, and therefore, unusable. The membrane was much cleaner above the Hb band and below the BSA band, which resulted in much more accurate baseline pixel values. The peak width at the base, 1b for each peak was equal to four times the SD in width of the peak [17], Ninety-five percent confidence intervals were calculated based on a Student’s t-distribution with n – 1 = 2 degrees of freedom.
3 Results and discussion
Three test separations were performed using 7 mg each of Hb and FITC-BSA to verify that the prototype preparative-scale DFGF apparatus could separate proteins reproducibly. Frame grabs in Fig. 4 from the end of each experiment showed that the Hb and FITC-BSA bands separated from each other. The surface of the rotor appeared darker between the bands, compared to above the Hb and below the FITC-BSA bands, because some protein adsorbed to the polysulfone membrane that coated the rotor. The adsorbed protein rinsed off after soaking the rotor for 15 h in 20% Tween-20 solution, providing a clean rotor for the next run.
Figure 4.

Still images taken prior to sample collection at the end of each of the three experimental runs. The upper Hb band separated from the lower FITC-BSA band.
The thin dark line that spanned the middle of each image was a glue joint in the acrylic stator. The two thicker and darker gray lines below it were shadows of the glue joint due to the over-head lighting in the laboratory. Trying to light the chamber from the front instead resulted in so much glare that the video footage was unusable.
The bottoms of the protein bands in Fig. 4 had sharp fronts and relatively more diffuse tails. This suggested that the focused bands were not Gaussian peaks, but more triangular ones that were skewed somewhat forward. This effect is predicted by theory [8] and arises from the concentrated protein peak decreasing the conductivity in the neighborhood of the focused protein, compared to the bulk conductivity, and thereby flattening the electric field gradient where the protein is focused.
Samples collected at the end of each run were analyzed by SDS-PAGE. All gels showed that the two test proteins were separated from each other. Figure 5 shows the gel from run 2, which had the least distance between the Hb and FITC-BSA protein bands. Even in that case there was no overlap between proteins. The skew in the protein bands was also seen in the gels. The FITC-BSA in lanes 15 and 16 most clearly showed the skew and it was visible to a lesser extent with the Hb in lanes 8 and 9.
Figure 5.
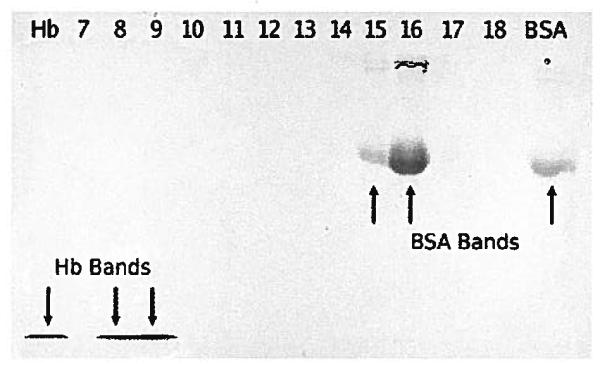
SDS-PAGE of samples from run 2. The top of the chamber, towards the left, contains the focused Hb in samples 8 and 9. Crude Hb is on the far left. The focused FITC-BSA was in samples 15 and 16 on the right of the gel and towards the bottom of the separation chamber. The right-most lane contains crude FITC-BSA.
The plot profiles in Fig. 3 were prepared from Fig. 4 in order to calculate the resolution between the protein bands (peaks), the peak widths, and the focal points listed in Table 1. The bottom and top of the white ceramic rotor in Fig. 4 corresponds to 0 and 29.038 cm, respectively, in Fig. 3. The peaks between 12.5 and 15 cm came from the glue joint and its shadows. The large peak between 0 and 1 cm arose from a bolt hole that crossed in front of the separation chamber at that point. A similar hole and peak occurred at the top of the chamber, as well. The pixel value ramps up from 23 to 30 cm because of shadows cast by the overhead lighting on the separation annulus.
Table 1.
Peak statistics and resolutiona)
| Peak height (Intensity) |
Half height (Intensity) |
Width at half height (cm) |
Variance (cm2) |
Focal point (cm) |
Peak width (cm) |
Resolution |
|||||||
|---|---|---|---|---|---|---|---|---|---|---|---|---|---|
| Protein | BSA | Hb | BSA | Hb | BSA | Hb | BSA | Hb | BSA | Hb | BSA | Hb | |
| Run 1 | 99.0 | 116 | 64.2 | 75.1 | 0.971 | 0.695 | 1.10 | 0.562 | 9.66 | 19.0 | 4.19 | 3.00 | 2.59 |
| Run 2 | 95.4 | 118 | 62.1 | 75.3 | 0.896 | 0.570 | 0.934 | 0.377 | 10.7 | 18.5 | 3.87 | 2.46 | 2.47 |
| Run 3 | 98.5 | 118 | 65.6 | 75.8 | 0.938 | 0.728 | 1.02 | 0.617 | 9.83 | 20.1 | 4.05 | 3.14 | 2.87 |
| Mean | 97.6 | 117 | 64.0 | 75.4 | 0.935 | 0.664 | 1.02 | 0.519 | 10.1 | 19.2 | 4.03 | 2.87 | 2.64 |
| 95% CI | 4.78 | 3.27 | 4.47 | 0.919 | 0.093 | 0.208 | 0.203 | 0.312 | 1.34 | 2.10 | 0.402 | 0.898 | 0.503 |
All numbers are rounded.
The results in Table 1 show that the separations were reproducible, with a mean resolution of 2.64 ± 0.503, and that the Hb band exhibited much more variability than the FITC-BSA band. The large confidence interval about the mean resolution also results from the variability in the Hb band’s focal point and base width. The confidence interval about the focal point for Hb was 50% greater than the confidence interval around the FITC-BSA focal point and the confidence interval around Hb peak width was more than twice the confidence interval for the FITC-BSA peak width. The variations in Hb width and focal point probably arose from fluctuations either in the counter-flow or in the conductivity within the separation annulus, as will be discussed next.
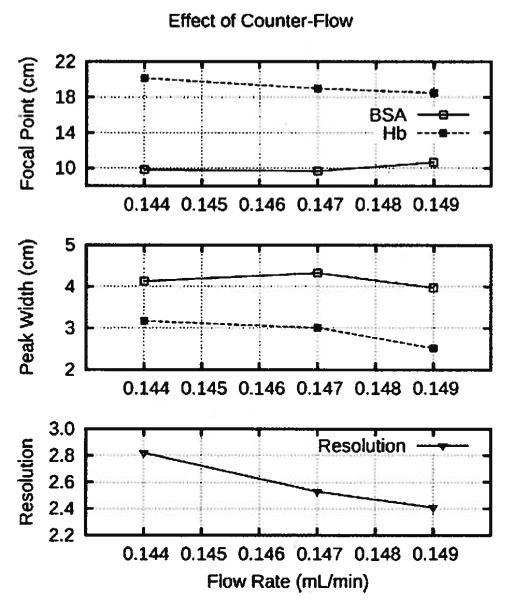
Small run-to-run differences in the flow rate entering the separation annulus occurred because the pump was only accurate to within 5% of the set point, which was 0.147 ml/ min for each run. At first, it appeared that the variability in Hb peak width and focal point were caused by fluctuations in the peristaltic pump providing the counter flow because the variations in the Hb peak width and focal point correlated with the flow rate into the separation annulus, as shown in Fig. 6. However, the focal point shifted in the opposite direction from what theory [6, 8] predicts. The focal point should have moved up the separation annulus as the flow rate increased, as demonstrated by BSA focal point. Likewise, theory [6, 8] dictates that the width of the Hb peak should not change with theflow rate, unless theflow rate increases dispersion in the system. Although the Hb peak decreased slightly with increasing flow rate, the FITC-BSA peak width demonstrated the expected behavior by neither increasing, nor decreasing, with the flow rate into the separation annulus. Thus, the combination of expected and unexpected influence of the flow rate from the pump on the FITC-BSA and Hb bands, respectively, suggested that the variation in the pump’s flow rate probably was not the cause of the fluctuations in the Hb band.
Figure 6.
Protein focal points, peak widths, and resolution varied with the fluctuating output of the pump providing the counter-flow for the separation annulus. The flow rate was 0.144, 0.147 and 0.149 mL/min for runs 3,1, and 2, respectively.
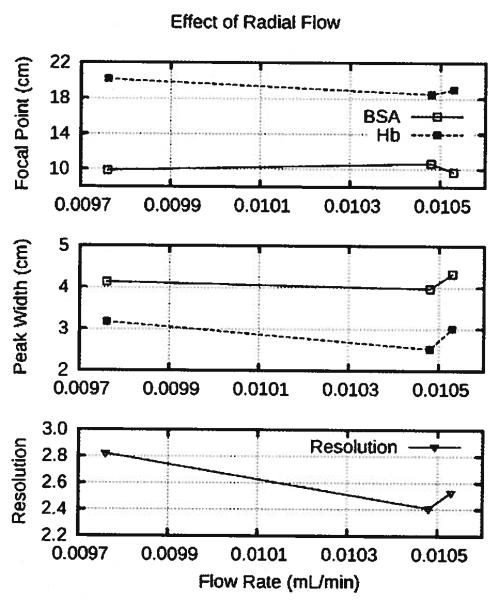
Fluctuations in radialflow through the rotor due to EOF could have affected the flow rate in the separation chamber, and hence, Hb focal point; but the radial flow through the rotor varied even less than the flow rate in the separation annulus and showed no dear influence on the focal points and peak widths, as shown in Fig. 7. This suggested that the radial flow through the rotor was not responsible for run-to-run variations in the Hb band.
Figure 7.
The peak widths and focal points do not trend with the radial flow through the rotor.
Another more likely source of the variation in the Hb band’s focal point and width was a decrease in conductivity at the top of the separation annulus (data not shown) that would have altered the electric field gradient in the region of Hb focal point, but not around FITC-BSA focal point. The electric field strength increased in the low-conductivity, ion-depleted region to compensate for the decreased conductivity. The front of the ion-depleted region moved downward from the top of the chamber as the run time progressed, shortening the electric field gradient and moving Hb focal point further down the chamber. The slope of the electric field gradient would have increased due to the front of the expanding ion-depleted zone, resulting in a tighter Hb band. However, it is unclear why the front moved faster, rather than slower, when the flow rate in the separation chamber increased. This raised the possibility that the fluctuation in the Hb band was independent of the flow rate in the separation annulus and fluctuation was due to the variation in the propagation of the ion-depleted region.
Presumably, such an ion-depleted region would form because current-carrying ions migrated from the separation chamber into the purge buffer flowing over the stator electrodes faster than they were pumped into the separation chamber by the counter-flow. In addition, some very recent work in small hollow-fiber systems [18] shows that the resistance to ionic transport between the cooling buffer and the separation annulus can cause ion depletion. A more complex, non-linear model of the preparative-scale DFGF instrument (unpublished results) also showed that resistance to ionic transport in and out of the separation annulus could cause an ion-depleted region to form at the top of the separation annulus. Thus, resistance to ion transport in the membrane-coated, porous, ceramic rotor in the preparative-scale device tested here could have caused or contributed to the ion depletion in the preparative-scale DFGF instrument.
4 Concluding remarks
This report describes the separation of Hb and FITC-BSA using a prototype preparative-scale DFGF apparatus. Over the course of three runs, the mean resolution between the Hb and FITC-BSA bands was 2.64 ± 0.503, which showed that the apparatus could reproducibly separate these two proteins, as verified by SDS-PAGE analysis of samples taken at the end of reach run. The Hb band exhibited greater run-to-run variation in its focal point and peak width than the FITC-BSA band. The data showed that the Hb focal point moved down the separation chamber and that peak width slightly decreased when the flow rate into the separation annulus increased. In contrast to Hb, the FITC-BSA band’s moved up the separation annulus as the flow rate increased and FITC-BSA band width was unaffected by the flow rate. Theory [6, 8] predicts that the increased flow rate should have moved the focal points higher up the column, not further down, and that the band widths should not have changed. The discrepancy between theory [6, 8] and Hb behavior, in contrast to the FITC-BSA band’s behavior, suggested that the flow rate was not the cause of the variations in the Hb band.
Instead, the effects produced by an expanding, low-conductivity region at the top of the separation chamber were more consistent with the decreased peak width and shifted focal point exhibited by the Hb band. The ion-depleted, low-conductivity region increased the electric field strength in the ion-depleted region, which compressed the electric field gradient and increased its slope, moving Hb focal point down the separation annulus and decreasing the focused width of the Hb band. Thus, the run-to-run variation in Hb focal point and band width probably arose from the variation in the formation of the ion-depleted region at the top of the separation annulus.
Recent work [18] and unpublished non-linear modeling of the preparative-scale DFGF instrument suggest that resistance to ionic transport through the membrane-coated, porous, ceramic rotor caused the ion-depleted region. Further study of the ion-depleted region and its formation will hopefully reduce run-to-run variation for simple protein separations and pave the way for reliably performing the more difficult isoform separations that the preparative-scale DFGF apparatus was designed to do.
Acknowledgments
We thank the Washington State University National Institutes of Health Protein Biotechnology Training Program (grant T32GM08336), the National Science Foundation (grant BES 9970972), and Berlex Laboratories (now a subsidiary of Healthcare Pharmaceuticals) for funding. Protasis Corporation supplied the multi-channel power supply and materials for the FITC-BSA.
Abbreviations
- DFGF
dynamic field gradient focusing
- Hb
hemoglobin
Footnotes
The authors declare no conflict of interest
5 References
- [1].Giddings JC, Dahlgren K. Sep. Sci. 1971;6:345–356. [Google Scholar]
- [2].Huang Z, Ivory CF. Anal. Chem. 1999;71:1628–1632. [Google Scholar]
- [3].Myers P, Bartle KD. J. Chromatogr. A. 2004;1044:253–258. doi: 10.1016/j.chroma.2004.04.069. [DOI] [PubMed] [Google Scholar]
- [4].Tracy NI, Ivory CF. J. Sep. Sci. 2008;31:341–352. doi: 10.1002/jssc.200700307. [DOI] [PMC free article] [PubMed] [Google Scholar]
- [5].Tracy NI, Huang Z, Ivory CF. Biotech. Prog. 2008;24:444–451. doi: 10.1021/bp070251c. [DOI] [PMC free article] [PubMed] [Google Scholar]
- [6].Wang Q, Tolley HD, LeFebre DA, Lee ML. Anal. Bioanal. Chem. 2002;373:125–135. doi: 10.1007/s00216-002-1286-y. [DOI] [PubMed] [Google Scholar]
- [7].Ivory CF. Sep. Sci. Technol. 2000;35:1777–1793. [Google Scholar]
- [8].Koegler WS, Ivory CF. Biotechnol. Prog. 1996;12:822–836. [Google Scholar]
- [9].Greenlee RD, Ivory CF. Biotechnol. Prog. 1998;14:300–309. doi: 10.1021/bp970113v. [DOI] [PubMed] [Google Scholar]
- [10].Righetti PG, Faupel M, Wenisch E. In: Advances in Electrophoresis. Chrambach A, Dunn MJ, Radola BJ, editors. VCH Publishers, Inc.; New York: 1992. pp. 159–200. [Google Scholar]
- [11].Righetti PG, Castagna A, Herbert B, Candiano G. Biosci. Rep. 2005;25:3–17. doi: 10.1007/s10540-005-2844-2. [DOI] [PubMed] [Google Scholar]
- [12].Ivory CF. Electrophoresis. 2004;25:360–374. doi: 10.1002/elps.200305753. [DOI] [PubMed] [Google Scholar]
- [13].Tracy NI, Ivory CF. Electrophoresis. 2004;25:1748–1757. doi: 10.1002/elps.200305832. [DOI] [PubMed] [Google Scholar]
- [14].Mosher RA, Saville DA, Thormann W. The Dynamics of Electrophoresis. VCH; New York: 1991. [Google Scholar]
- [15].Bottenus D, Leatzow D, Ivory CF. Electrophoresis. 2006;27:3325–3331. doi: 10.1002/elps.200500939. [DOI] [PubMed] [Google Scholar]
- [16].Candiano G, Bruschi M, Musante L, Santucci L, et al. Electrophoresis. 2004;25:1327–1333. doi: 10.1002/elps.200305844. [DOI] [PubMed] [Google Scholar]
- [17].Ettre LS. Pure Appl. Chem. 1993;65:819–872. [Google Scholar]
- [18].Humble PH, Harb JN, Tolley HD, Woolley AT, et al. J. Chromatogr. A. 2007;1160:311–319. doi: 10.1016/j.chroma.2007.04.013. [DOI] [PubMed] [Google Scholar]


