

Abstract
We recently reported evidence for an association between the individual variation in normal human episodic memory and a common variant of the KIBRA gene, KIBRA rs17070145 (T-allele). Since memory impairment is a cardinal clinical feature of Alzheimer’s disease (AD), we investigated the possibility of an association between the KIBRA gene and AD using data from neuronal gene expression, brain imaging studies, and genetic association tests. KIBRA was significantly over-expressed and 3 of its 4 known binding partners under-expressed in AD-affected hippocampal, posterior cingulate and temporal cortex regions (p<0.010, corrected) in a study of laser capture microdissected neurons. Using positron emission tomography in a cohort of cognitively normal, late-middle-aged persons genotyped for KIBRA rs17070145, KIBRA T non-carriers exhibited lower glucose metabolism than did carriers in posterior cingulate and precuneus brain regions (P<0.001, uncorrected). Lastly, non-carriers of the KIBRA rs17070145 T-allele had increased risk of late-onset AD in an association study of 702 neuropathologically verified expired subjects (p=0.034; OR=1.29) and in a combined analysis of 1026 additional living and expired subjects (p=0.039; OR=1.26). Our findings suggest that KIBRA is associated with both individual variation in normal episodic memory and predisposition to AD.
Keywords: genetics, imaging, expression profiling, memory
INTRODUCTION
We recently capitalized on genome-wide association, brain gene expression and brain imaging studies to characterize an association between a common variant of the KIBRA gene and individual variation in normal human memory. KIBRA rs17070145 T-allele non-carriers had lower scores than carriers of this allele on episodic memory tests in a pooled genome-wide association study (GWAS) of normal young adults, a replication study of young adults, and another replication study of middle-aged adults [22]. KIBRA was expressed in human and murine brains, supporting its potential relevance to the biology of memory and related behaviors. After controlling for their memory scores in a functional magnetic resonance imaging (fMRI) study, KIBRA T-allele non-carriers had greater hippocampal activation than non-carriers during an episodic memory task, suggesting that the hippocampus had to work harder to perform the task in those with the poor memory allele.
Since memory impairment is a cardinal clinical feature of Alzheimer’s disease (AD), we decided to investigate the possibility of an association between AD and KIBRA using data from neuronal gene expression, brain imaging, and genetic association studies. We initially tested the hypothesis that the KIBRA biomolecular pathway would exhibit dysregulation at the transcriptional level in the brains of AD patients. We compared expression of the KIBRA gene and its four known binding partners PRKCZ (protein kinase C zeta), DYNLL1 (dynein light chain 1), ESR1 (estrogen receptor), and KIAA0513 using data from a microarray study of non-tangle-bearing neurons laser-capture microdissected from AD cases and matched elderly controls. For this microarray study, neurons were extracted from six brain regions shown to be differentially affected by AD, including the hippocampus and entorhinal cortex (which are vulnerable to early neurofibrillary pathology in persons clinically affected by or at risk for AD [7, 9]), the posterior cingulate cortex (which is associated with unusually early hypometabolism and fibrillar amyloid pathology in persons clinically affected by or at risk for AD [19, 30]), the middle temporal gyrus (associated with amyloid pathology in persons affected by AD [10, 13, 19]), superior frontal gyrus (which demonstrates metabolic changes with regards to aging [16]), and primary visual cortex (which is relatively spared in persons with AD [18]).
Next, we used data from a fluoro-deoxyglucose (FDG) positron emission tomography (PET) study to test the hypothesis that cognitively normal, late-middle aged KIBRA rs17070145 T-allele non-carriers have lower cerebral glucose metabolism than carriers of this allele in brain regions known to be metabolically affected by AD. We have previously reported an association between apolipoprotein E (APOE) ε4 gene dose (i.e. the number of ε4 alleles in a person’s APOE genotype) and lower cerebral glucose metabolism in each of the precuneus, posterior cingulate, parietotemporal and prefrontal regions known to be progressively affected by AD [24]. Since APOE ε4 gene dose is associated with three levels of risk for late-onset AD, we proposed that PET could be used as a presymptomatic, quantitative endophenotype—a measure more closely related to disease-severity than the clinical features themselves—to assess putative modifiers of AD risk.
Since the precuneus and posterior cingulate cortex have been implicated in i) successful retrieval memory [6], ii) the “default system” that is preferentially active during the passive “resting” state [6], iii) the earliest metabolic reductions in persons at genetic risk for late-onset AD [24], iv) early fibrillar amyloid pathology [19], and v) preferential rates of gray matter loss in AD patients [12], our PET studies also provide support for the relationship between KIBRA’s connection to neurobiological processes involved in both normal episodic memory and predisposition to AD.
Finally, we looked for an association of the KIBRA rs17070145 SNP with AD and found that non-carriers of the T-allele have an increased risk of developing late-onset AD (and explored possible associations with all three KIBRA rs17070145 genotypes) using data from our GWAS association study of 702 clinically characterized and neuropathologically verified expired subjects and in a combined analysis of data from 1026 additional living and expired subjects.
METHODS
Tissue collection for expression studies
Brain samples were collected at 3 Alzheimer’s Disease Centers (Washington University, Duke University, and Sun Health Research Institute) from individuals clinically-classified as neurologically normal (10 males and 4 females) with a mean age of 79.8 ± 9.1 and clinically-classified late-onset AD-afflicted individuals (15 males and 18 females) with a mean age of 79.9 ± 6.9. Individuals were matched as closely as possible for their mean age of death, mean educational level, and proportion of persons with under-represented racial backgrounds. Subjects in the AD group have a Braak stage of V or VI [5] with a CERAD neuritic plaque density of moderate or frequent [17]. Samples were collected (mean PMI of 2.5 hours) from six brain regions that are either histopathologically or metabolically relevant to AD—these include the entorhinal cortex (BA 28 and 34), superior frontal gyrus (BA 10 and 11), hippocampus, primary visual cortex (BA 17), middle temporal gyrus (BA 21 and 37), and the posterior cingulate cortex (BA 23 and 31). Following dissection, samples were frozen, sectioned (8 μm), and fixed on glass slides.
Brain sections were stained with 1% Neutral Red and pyramidal neurons were identified by their characteristic size, shape, and location within the region of interest. To visualize localization of tangles, an adjacent section for each case was stained with a 0.1% Thioflavin S fluorescent stain. Upon locating areas of the brain section where tangle-bearing neurons are present, these areas were extrapolated to the adjacent Neutral Red stained section to avoid collection of neurons containing neurofibrillary tangles. In the entorhinal cortex, large stellate neurons were collected from layer II and pyramidal cells were collected from CA1 of the hippocampus. The CA1 region was selected for study because this area is the most-affected and earliest affected region in the hippocampus in terms of tangle formation, and this region has already been expression profiled in neurologically-healthy elderly individuals. In all other regions, cortical layer III neurons were collected. For each individual, approximately five hundred histopathologically normal pyramidal neurons were collected from the entorhinal cortex, hippocampus, middle temporal gyrus, posterior cingulate cortex, superior frontal gyrus, and primary visual cortex using LCM with the Arcturus Veritas Automated Laser Capture Microdissection System (Mountain View, CA). Cells were collected onto CapSure Macro LCM Caps (Arcturus) and extracted according to the manufacturer’s protocol. Total RNA was isolated from the cell lysate using the PicoPure RNA Isolation Kit (Arcturus) with DNase I treatment using Qiagen’s RNase-free DNase Set (Valencia, CA.
Expression profiling
Expression profiling was performed as previously described [15]. Isolated total RNA was double round amplified, cleaned, and biotin-labeled using Affymetrix’s GeneChip Two-Cycle Target Labeling kit (Santa Clara, CA) with a T7 promoter and Ambion’s MEGAscript T7 High Yield Transcription kit (Austin, TX) as per manufacturer’s protocol. Amplified and labeled cRNA was quantitated on a spectrophotometer and run on a 1% TAE gel to check for an evenly distributed range of transcript sizes. 20ug of cRNA was fragmented to approximately 35 to 200 bp by alkaline treatment (200mM Tris-acetate, pH 8.2, 500 mM KOAc, 150 mM MgOAc) and run on a 1% TAE gel to verify fragmentation. Separate hybridization cocktails are made using 15 μg of fragmented cRNA from each sample as per Affymetrix’s protocol.
Microarray Analysis
200 μL of each cocktail was separately hybridized to an Affymetrix Human Genome U133 Plus 2.0 Array for 16 hours at 45C in the Hybridization Oven 640. The Affymetrix Human Genome Arrays measure the expression of over 47,000 transcripts and variants, including 38,500 characterized human genes. Hybridization cocktails for nine entorhinal cortex samples (normal neurons from AD-brains) previously collected following the same profiling methodology used in this project [8] was re-analyzed on the Affymetrix Human Genome U133 Plus 2.0 Array to be evaluated in this study; a tenth entorhinal cortex sample was also separately processed for this sample group. Arrays are washed on Affymetrix’s upgraded GeneChip Fluidics Station 450 using a primary streptavidin phycoerythrin (SAPE) stain, subsequent biotinylated antibody stain, and secondary SAPE stain. Arrays are scanned on Affymetrix’s GeneChip Scanner 3000 7G with AutoLoader. Scanned images obtained by the Affymetrix GeneChip Operating Software (GCOS) v1.2 are used to extract raw signal intensity values per probe set on the array and calculate detection calls (absent, marginal, or present). Assignment of detection calls is based on probe-pair intensities for which one probe is a perfect match of the reference sequence and the other is a mismatch probe for which the thirteenth base (of the 25 oligonucleotide reference sequence) is changed. All raw chip data was scaled in GCOS to 150 to normalize signal intensities for inter-array comparisons. Reports generated by GCOS were reviewed for quality control—we looked for at least 20% present calls, a maximum 3’/5’ GAPDH ratio of 30, and a scaling factor under 10. Arrays that failed to pass these standards were not included in further analyses.
Pyramidal cell quality control
To ensure neuronal cell purity in the samples, expression of GFAP, an astrocyte cell marker, was evaluated. Six samples that had GFAP expression greater than one standard deviation from the mean were removed from statistical analyses.
Expression profiling statistical analysis
Data for samples from neurologically-healthy elderly controls has been published [15]. Microarray data files of the normal samples are available on the Gene Expression Omnibus (GEO) site at http://www.ncbi.nlm.nih.gov/geo/query/acc.cgi?acc=GSE5281 (project accession#GSE5281) and regional analyses are posted at http://www.tgen.org/neurogenomics/data/private3). For this study, we analyzed 13 controls against 10 AD cases for the entorhinal cortex, 13 controls against 10 AD cases for the hippocampus, 12 controls against 16 AD cases for the middle temporal gyrus, 13 controls against 9 AD cases for the posterior cingulate, 11 controls against 23 AD cases for the superior frontal gyrus, and 12 controls against 19 AD cases for the primary visual cortex.
Direct comparisons between brains of neurologically-healthy and AD-afflicted brains were performed between all brain regions to analyze expression differences. For each analysis, genes that did not demonstrate at least approximately 10% present calls for each region-specific comparison were removed using Genespring GX 7.3 Expression Analysis software (Agilent Technologies; Palo Alto, CA). A two-tailed unpaired t-test, assuming unequal variances (with a multiple testing correction using the Benjamini and Hochberg False Discovery Rate (FDR)), was applied to each comparison in Excel to evaluate statistical significance of differential expression identified for KIBRA, PRKCZ, DYNLL1, ER, PR, and KIAA0513. Probes that demonstrated an average control signal and average AD signal both below 100 were removed. Fold change values were calculated by calculating the ratio between the average scaled expression signal (for all samples) for a gene from the AD sample region and the average scaled expression signal for the same gene from the normal samples.
Brain Imaging
Newspaper advertisements were previously used to recruit cognitively normal volunteers 47 to 68 years of age who reported a family history of probable AD in at least one first-degree relative. The subjects provided DNA samples, which were used for both APOE and KIBRA genotyping, and a four-hour battery of clinical ratings and neuropsychological tests [25]. As previously described [25], PET images were acquired following the intravenous injection of 5-8 mCi of FDG, a transmission scan and 60-minute dynamic sequence of emission scans in the three-dimensional mode on the HR+ scanner (Siemens, Knoxville, TN) as the participants, who had fasted for at least 4 hours, lay quietly with eyes closed in a darkened room. Regional analyses were performed using the PET images (counts relative to the whole brain uptake) acquired during the last 30 minutes. As previously noted, an automated algorithm (SPM, Wellcome Department of Cognitive Neurology, London, U.K.) was used to linearly and non-linearly deform each person’s PET image into the coordinates of a standard brain atlas, normalize absolute measurements using proportionate scaling, generate an age-adjusted statistical parametric map of significantly lower CMRgl in the KIBRA T non-carriers than in the KIBRA T carriers (P<0.005, uncorrected for multiple comparisons), and superimpose this map onto a map of CMRgl reductions in previously studied patients with AD [1] and a spatially standardized, volume-rendered MRI.
Genome-Wide Association Study
The Affymetrix 500K GeneChip (Affymetrix, Santa Clara, CA) was used to genotype rs17070145 in each subject as previously described [27]. Genotypes were extracted using both SNiPer-HD [11] and the BRLMM Analysis Tool (Affymetrix).
rs17070145 TaqMan® genotyping
Genotyping of SNP rs17070145 was carried out using TaqMan® allelic discrimination chemistry (Applied Biosystems, Foster City, CA). 70ng of patient DNA was dried overnight to the bottom of clear 96 well plates. 5 μl of TaqMan® master-mix containing primers specific to rs17070145 was added to the dried DNA and PCR was carried out with the following cycling parameters: 1) Denature at 95° C for 3 minutes, 2) 95° C for 15 seconds, 3) 60° C for 90 seconds, 4) cycle step 2-3 59 times, 5) hold at 4° C. Genotyping was carried out using the ABI Prism 7000 sequence detection system chemistry (Applied Biosystems, Foster City, CA). Genotype clusters were determined manually using software version 1.1.
Genetic Statistical Analysis
915 samples were examined from the GWAS in Haploview 3.32 [4] (http://www.broad.mit.edu/mpg/haploview/). Inclusion criteria were as follows: Individuals samples needed >98% call rate across the region or the entire sample was excluded. SNP rs17070145 must have >99% call rate across all samples. The Hardy Weinberg Equilibrium cut-off was 0.05 and minor allele frequency (MAF) >5%. After application of exclusion criteria, 702 samples remained for analysis.
Genotyping errors were also assessed comparing SNiPER-HD and BRLMM algorithms across 903 samples (12 of the total 915 samples had no calls for rs17070145). Concordance was also calculated using 106 samples genotyped on both the Affymetrix platform (called using SNiPER-HD) and the TaqMan® allelic discrimination assay (for BRLMM versus SNiPER-HD, out of 903 evaluated samples, 891 are concordant (98.7%) and for SNiPER-HD versus TaqMan, out of 106 evaluated samples, 102 are concordant (96.2%)).
Once association with AD was established in the training population, SNP rs17070145 was taken forward in five new replication populations, three of these cohorts being European populations with antemortem clinical diagnoses. The fourth and fifth replication cohorts consisted of Netherlands: (N=28) and US: (N=24) postmortem samples. Using PLINK (http://pngu.mgh.harvard.edu/purcell/plink/) [23], χ2 analysis was performed on the combined European populations and on the entire replication cohort of 1,026 patients. Additionally, the populations were stratified based on nationality and the Cochran-Mantel-Haenszel (CMH) χ2 was calculated. For the European cohort, three strata were defined (K=3) for the German, Dutch and Norwegian populations. For the entire cohort, five strata (K=5) were defined for the CMH test: the antemortem US population, and the German, Norwegian populations, postmortem US and postmortem Netherlands. Because the additional postmortem samples were of postmortem diagnosis (as opposed to antemortem diagnosis in the other three cohorts), they were added as separate strata. Additionally, general genotypic association tests were carried out on the training, individual replication cohorts, and the combined replication cohort of 1,026 patients.
For the age of onset, QTL analysis with regards to rs17070145 genotype was conducted in PLINK using the Wald test. Braak Score and MMSE scores were evaluated for genotypic effects using logistic regression in PLINK. Stratification was also assessed and controlled for in the discovery post-mortem and the ante-mortem cohorts as previously described [27].
RESULTS
Neuronal gene expression of KIBRA and its interacting proteins are altered in AD-affected brain regions
We utilized data from our previously reported microarray study of laser-capture microdissected non-tangle bearing neurons in expired AD cases and controls [14] to test the hypothesis that neuronal gene expression of KIBRA and its four known binding partners might be altered in neuropathologically or metabolically affected AD regions. The investigated genes included KIBRA, PRKCZ (protein kinase C zeta), DYNLL1 (dynein light chain 1), ESR1 (estrogen receptor), and KIAA0513 and the investigated regions included the hippocampus and entorhinal cortex (preferentially affected by neurofibrillary tangle pathology), posterior cingulate and temporal cortex (preferentially affected by neuritic plaques and reduced glucose metabolism), the superior frontal gyrus (preferentially affected metabolically by aging), and the primary visual cortex (which is relatively pathologically spared). Regional analysis of AD brains compared to control brains identified significant expression changes (P<0.010, corrected for multiple testing) as shown in Figure 1. Overall, statistically significant trends demonstrated increased neuronal expression of KIBRA in the hippocampus, middle temporal gyrus, and posterior cingulate cortex of AD brains and decreased neuronal expression of genes coding for its binding partners, including protein kinase C zeta, a kinase known to phosphorylate KIBRA, DYNLL1, and KIAA0513.
Figure 1. Gene expression profiling in select brain regions of AD donors and healthy matched controls demonstrates significant expression changes in KIBRA and its binding partners.

Expression of KIBRA and genes coding for known binding partners showed statistically significant (P<0.010, corrected for multiple testing) expression changes in six different brain regions (color codes shown in the legend). The primary visual cortex was profiled as a regional AD control because it is spared with regards to AD pathologies. Fold changes are shown to the right of arrows and corrected p-values are shown in parentheses. Regions and genes with no data listed indicates that the probe was either not significant, demonstrated undetectable changes across the region-specific comparison, or showed expression changes that may be overlapping with background).
Expression of KIBRA and genes coding for binding partners were also evaluated in a previously published microarray data set that compared gene expression of tangle-bearing neurons to non-tangle-bearing neurons from the entorhinal cortices of AD patients [8] (additional regions were not profiled in this study). Interestingly, no statistically significant (P>0.05, uncorrected, data not shown) expression changes were identified for KIBRA, PRKCZ, ESR1, DYNLL1, and KIAA0513. This finding provides transcriptomic evidence that KIBRA is not associated with tangle pathologies characteristic of AD.
Non-carriers of the KIBRA rs17070145 T-allele have reduced glucose metabolism in AD-affected brain regions
Next, we utilized available DNA and data from a FDG PET study of late-middle-aged cognitively normal persons with two copies, one copy and no copies of the APOE ε4 allele (16) to test the hypothesis that the 67 non-carriers of the KIBRA rs17070145 T-allele would have lower glucose metabolism than the 69 KIBRA T-carriers in the brain regions previously found to be hypometabolic in AD patients and cognitively normal APOE ε4 carriers. The KIBRA T carriers were slightly younger than the non-carriers (55.5±4.4 versus 57.3±4.5 years, P=0.02), but did not differ significantly in their educational level (15.8±1.5 versus 15.6±1.5 years, P=0.47), proportion of males and females (23/44 versus 26/43, P=0.65), proportion of APOE ε4 homozygotes, heterozygotes and non-carriers (11/24/32 versus 17/17/35, P=0.27), or MMSE scores (29.8±0.5 versus 29.7±0.6, P=0.17). As predicted, KIBRA T non-carriers (controlled for APOE status) had significantly lower CMRgl than KIBRA T carriers in brain regions preferentially affected by AD, including the precuneus and the posterior cingulate cortex (P<0.001, uncorrected for multiple comparisons, Figure 2, Supplementary Table 1, located at http://www.tgen.org/neurogenomics/data). The CMRgl reduction extended into the mid-cingulate cortex and remained significant after correction for age.
Figure 2. KIBRA T non-carriers have significantly lower CMRgl than carriers in brain regions preferentially affected by AD.
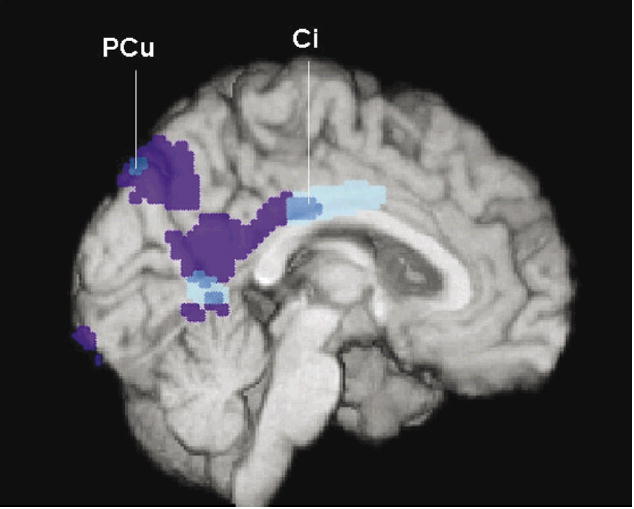
In the precuneus (PCu) and cingulate (Ci) regions, including PCu and posterior Ci regions previously shown to have CMRgl reductions in patients with AD and more anteriorly in middle Ci cortex, KIBRA T carriers had higher CMRgI than KIBRA T non-carriers. Brain regions with lower CMRgl in KIBRA T non-carriers than carriers are shown in dark and light blue, brain regions with lower CMRgl in previously studied AD patients than controls are shown in dark blue and purple, and all of these regions are shown at P<0.005, uncorrected for multiple comparisons and are superimposed onto the left medial hemisphere.
KIBRA SNP rs17070145 is associated with Late-Onset AD (LOAD) in a GWAS of neuropathologically verified cases and controls
Lastly, we evaluated the rs17070145 SNP implicated in our original study of episodic memory. Rs17070145 was evaluated on the Affymetrix 500K GeneChip in a discovery cohort of clinically characterized and neuropathologically verified expired LOAD cases and controls. This cohort included 595 American cases with a clinical diagnosis of dementia after the age of 60, as well as a neuropathological diagnosis of AD, and 320 American controls who were cognitively normal before they died, neuropathologically verified to have a low probability of AD, and who were included in our originally reported GWAS of LOAD [22]. The rs17070145 SNP was associated with LOAD (P=0.034, Supplementary Table 2).
KIBRA SNP rs17070145 is associated with LOAD in a replication study of clinically characterized LOAD cases and controls
When the implicated rs17070145 was evaluated in a replication cohort of 632 LOAD cases and 394 LOAD controls (including 230 living cases and 172 living controls from Mayo Clinic Rochester which were included in our original GWAS of LOAD [27], 219 expired cases and 113 controls from Germany, and 143 expired cases and 97 Norwegian controls, 16 expired cases and 12 controls from The Netherlands, and 24 expired cases from the US who were not included in our original study), it continued to be associated with LOAD (chi-square, P=0.039, odds ratio [OR] 1.26 (1.06-1.49 95% C.I.)). When data from our 5 replication cohorts were combined and analyzed using the Cochran-Mantel-Haenszel (CMH) approach, the SNP was significantly associated with AD (P=0.044, OR 1.22 (1.01-1.47 95% C.I.)). Although the SNP was not significant in some of the smaller and presumably lower-powered individual cohorts, it is noteworthy that the SNP’s C allele was significantly associated with poorer episodic memory in our original cohort and significantly associated with AD in our larger discovery and combined replication cohorts (Table 1 and Supplementary Table 3).
In post-hoc analyses, we explored the possibility that the implicated rs17070145 allele dosage might be associated with age-at-dementia onset, neurofibrillary tangle state (using Braak staging), and neocortical neuritic plaque severity (using the Consortium to Establish a Registry for AD (CERAD) categories [19]) in the subjects for whom these data were available. After controlling for gender (education level data unavailable) the KIBRA risk genotype was not significantly associated with estimated age-at-dementia onset (N=270, P=1.0). After controlling for gender and age-at-death, the KIBRA risk genotype was not significantly correlated with Braak stage (N=555, P=0.697; education data not available) or CERAD severity (N=213, P=0.451; Supplementary Table 4). Finally, we found no significant association between Mini Mental State Examination (MMSE) scores and rs17070145 in either the AD patients or controls (N=313, P=1.0). These data are available at http://www.tgen.org/neurogenomics/data.
DISCUSSION
We previously used findings from an unbiased GWAS, replication genetic association studies, brain gene expression studies, and a brain imaging study to implicate a common genetic variant in the individual variation of normal episodic memory. Here, we used findings from neuronal gene expression studies, a brain imaging study, a GWAS, and a hypothesis-based genetic association study to implicate the same SNP in the predisposition to late-onset AD.
Our microarray study of non-tangle-bearing neurons from expired AD cases and controls demonstrated that KIBRA was overexpressed while three of KIBRA’s four known binding partners were underexpressed in AD-affected hippocampal, posterior cingulate and temporal cortex regions. In a PET study of cognitively normal late-middle-aged persons, KIBRA rs17070145 T non-carriers had lower glucose metabolism than non-carriers in AD-affected posterior cingulate and precuneus regions. Lastly, in the genetic association studies, non-carriers of the KIBRA rs17070145 T-allele had moderate but significantly increased risk of late-onset AD.
In mid-2007 Rodriguez-Rodriguez et al. published an association of the T allele of rs17070145 with an increased risk for very-late onset (>86 years-of-age) antemortem-diagnosed AD [28]. The study population was derived from an isolated geographical region in the north of Spain and consisted of a small number of individuals with very-late AD (N=32 cases; N=95 controls). In our study we clearly show no association of rs17070145 with age-of-onset and in fact our trend suggests a protective effect of carrying the T-allele with progressive increasingly later age-of-onset. The study reported herein included approximately 2.5-times greater sampled individuals that were divided up into multiple validation cohorts (starting in the well-powered and relatively free of diagnostic error post-mortem-assessed cohort). The disparity in the findings between our two groups may rest in the differences in power, AD diagnosis, and/or geographical differences in the cohort composition. Additional studies have also reported both confirmatory and different findings with regards to the role of KIBRA in memory functions [3, 20, 21, 29].
It remains to be clarified why some of the same genes that contribute to normal episodic memory performance, and by inference the molecular pathways to which they are related, also appear to contribute to the risk of LOAD. One might postulate that carriers of the gene associated with poorer memory have a lower “cognitive reserve” [2, 31, 32] to compensate for the same level of AD pathology (if so, one might predict that persons with the poor memory allele would have an earlier age at dementia onset or lower MMSE scores after controlling for our available measures of neuropathological severity. While our estimated age-at-onset and neuropathological measures are relatively crude and the samples having these data relatively small, we were unable to detect a significant association). Alternatively, one might postulate that some of the same molecular processes contributing to episodic memory performance (including synaptic neurotransmission, long-term potentiation and neuronal plasticity) also contribute to the pathological and clinical features of AD. For instance, KIBRA is a binding partner of dendrin, a putative modulator of synaptic plasticity, which could be involved in normal memory, the pathological feature of AD most related to dementia severity (synaptic loss), or the ability to compensate for AD pathology. In addition, KIBRA includes a C2-like domain that is similar to the C2-domain of synaptotagmin, which is believed to function as the main calcium sensor in synaptic vesicle exocytosis. Finally, KIBRA includes a domain that interacts with protein kinase C zeta (PKC-ζ), which has been implicated in memory formation and the consolidation of long-term potentiation.
Interestingly, our PET study of cognitively normal late-middle-aged adults found that the implicated KIBRA genotype was associated with lower CMRgl in the precuneus and posterior cingulate regions. As Buckner and his colleagues have noted, these brain regions are metabolically affected in the earliest clinical and preclinical stages of LOAD, even in young adult APOEε4 carriers [25, 26] and later show some of the earliest evidence of neuritic plaque deposition (12); they are among the neuronally and metabolically active brain regions when the brain is in its default mode (12); and they are preferentially related to successful retrieval memory. These findings, along with the AD-related alterations in neuronal gene expression of KIBRA and some of its binding partners in hippocampus, and temporal and posterior cingulate cortex, raise the possibility that a common molecular mechanism (along with a common neural system) contributes to the brain’s default mode, successful episodic memory performance, and the predisposition to AD. Together, findings from our genetic, transcriptomic and brain imaging studies may provide a foundation for elucidation of these critical molecular and neuronal functions.
While the implicated KIBRA genotype was not associated with age-at-dementia onset, Braak stage, or neuritic plaque severity, it is important to note that the number of available subjects with available data for these analyses was relatively small, that age-at-dementia onset and semi-quantitative histopathological data provide relatively crude measurements with, in some cases, questionable inter-rater reliability, and that the histopathological measurements were performed on expired donors who were pre-selected in part on the basis of categorical distinctions in their histopathological severity.
If KIBRA and the molecular processes to which it is related in normal human memory participate in both memory and the predisposition to AD, it is possible that some of these processes could be targeted in the discovery of memory-enhancing, AD-modifying and AD risk-reducing therapies. Using this target, we have recently shown that a treatment targeting this pathway enhances memory in aged rats (Huentelman et al., manuscript currently under review). It will be interesting to determine the extent to which treatments of this kind enhance memory in older persons and perhaps even compensate for, slow down, and reduce the risk of AD.
Supplementary Material
Acknowledgments
We would like to thank Christopher B. Heward of Kronos Life Sciences Laboratories for support on the first AD association study. This study was also funded by the National Institute on Aging (Arizona Alzheimer’s Disease Center P30 AG19610, RO1 AG023193, Mayo Clinic Alzheimer’s Disease Center P50 AG16574 and Intramural Research Program, P30 AG19610 to EMR), the National Institute of Mental Health (RO1 MH57899 to EMR), the Arizona Alzheimer’s Consortium (Arizona Department of Health Services to EMR), the Banner Alzheimer Foundation (to EMR), the Mayo Clinic Foundation (to RJC), the National Alzheimer’s Coordinating Center (U01 AG016976), and the state of Arizona. We thank our research volunteers and their families for their generous participation and Drs. Creighton Phelps, Marcelle Morrison-Bogorad, Marilyn Miller, and Walter Kukull for their assistance in the acquisition of tissue samples and data, and directors, pathologists, and technologists from the following ADCs and brain banks: Lucia Sue (Sun Health Research Institute and Arizona Alzheimer’s Disease Center); Ruth Seemann and Dan Brady (National Institute on Aging); Juan C. Troncoso and Olga Pletnikova (John Hopkins, P50 AG05146); Harry Vinters and Justine Pomakian (University of California, Los Angeles, P50 AG16570); Christine M. Hulette (The Kathleen Price Bryan Brain Bank, Duke University Medical Center, P50 AG05128, RO1 NS39764, RO1 MH60451, and GlaxoSmithKline); Dikran Horoupian, Ahmad Salehi (Stanford University, P30 AG17824); Jean Paul Vonsattel (New York Brain Bank, Taub Institute, Columbia University, P50 AG08702); E. Tessa Hedley-Whyte, Karlotta Fitch (Massachusetts General Hospital, P50 AG05134); Roger Albin, Lisa Bain, and Eszter Gombosi (University of Michigan, P50 AG08671): William Markesbery, Sonya Anderson (University of Kentucky, P50 AG05144); Dennis W. Dickson and Natalie Thomas (Mayo Clinic, Jacksonville, P50 AG16574 and P50 AG25711); Carol A. Miller, Jenny Tang, and Dimitri Diaz (University of Southern California, P50 AG05142); Dan McKeel, John C. Morris, Eugene Johnson, Jr., Virginia Buckles, and Deborah Carter (Washington University, St Louis, P50 AG 05681); Thomas Montine and Aimee Schantz (University of Washington, P50 AG05136); John Q Trojanowski, Virginia M Lee, Vivianna Van Deerlin, and Terry Schuck (University of Pennsylvania); Ann C. McKee and Carol Kubilus (Boston University, P30 AG13846); Bruce H. Wainer and Marla Gearing (Emory University, AG025688); Charles L. White, III, Roger Rosenberg, Marilyn Howell, and Joan Reisch (University of Texas, Southwestern Medical School, P30-AG12300); William Ellis and Mary Ann Jarvis, (University of California, Davis, P30 AG AG01542); David A. Bennett, Julie A. Schneider, Karen Skish, and Wayne T. Longman (Rush University Medical Center, P30 AG10161); Deborah C. Mash, Margaret J Basile, and Mitsuko Tanaka University of Miami/NPF Brain Endowment Bank); and Nick Lehmans (Translational Genomics Research Institute). Additional support was provided by the Johnnie B. Byrd Sr. Alzheimer’s Disease and Research Institute, the Swiss National Science Foundation (PP00B-68859), the Verum foundation, the Bisgrove charitable donation, the NIH Neuroscience Blueprint (U24NS051872), the ENDGAME Consortium (UO1HL084744), a National Institute on Aging grant to Carl Cotman (University of California, Irvine, P50 AG23173) and the state of Arizona.
Footnotes
DISCLOSURE STATEMENT The authors state that there are no actual or potential conflicts of interest.
Publisher's Disclaimer: This is a PDF file of an unedited manuscript that has been accepted for publication. As a service to our customers we are providing this early version of the manuscript. The manuscript will undergo copyediting, typesetting, and review of the resulting proof before it is published in its final citable form. Please note that during the production process errors may be discovered which could affect the content, and all legal disclaimers that apply to the journal pertain.
References
- 1.Alexander GE, Chen K, Pietrini P, Rapoport SI, Reiman EM. Longitudinal PET Evaluation of Cerebral Metabolic Decline in Dementia: A Potential Outcome Measure in Alzheimer’s Disease Treatment Studies. Am J Psychiatry. 2002;159(5):738–45. doi: 10.1176/appi.ajp.159.5.738. [DOI] [PubMed] [Google Scholar]
- 2.Alexander GE, Furey ML, Grady CL, Pietrini P, Brady DR, Mentis MJ, Schapiro MB. Association of premorbid intellectual function with cerebral metabolism in Alzheimer’s disease: implications for the cognitive reserve hypothesis. Am J Psychiatry. 1997;154(2):165–72. doi: 10.1176/ajp.154.2.165. [DOI] [PubMed] [Google Scholar]
- 3.Almeida OP, Schwab SG, Lautenschlager NT, Morar B, Greenop KR, Flicker L, Wildenauer D. KIBRA Genetic Polymorphism Influences Episodic Memory in Later Life, but Does Not Increase the Risk of Mild Cognitive Impairment. J Cell Mol Med. 2008 doi: 10.1111/j.1582-4934.2008.00229.x. [DOI] [PMC free article] [PubMed] [Google Scholar]
- 4.Barrett JC, Fry B, Maller J, Daly MJ. Haploview: analysis and visualization of LD and haplotype maps. Bioinformatics. 2005;21(2):263–5. doi: 10.1093/bioinformatics/bth457. [DOI] [PubMed] [Google Scholar]
- 5.Braak H, Braak E. Neuropathological stageing of Alzheimer-related changes. Acta Neuropathol (Berl) 1991;82(4):239–59. doi: 10.1007/BF00308809. [DOI] [PubMed] [Google Scholar]
- 6.Buckner RL, Snyder AZ, Shannon BJ, LaRossa G, Sachs R, Fotenos AF, Sheline YI, Klunk WE, Mathis CA, Morris JC, Mintun MA. Molecular, structural, and functional characterization of Alzheimer’s disease: evidence for a relationship between default activity, amyloid, and memory. J Neurosci. 2005;25(34):7709–17. doi: 10.1523/JNEUROSCI.2177-05.2005. [DOI] [PMC free article] [PubMed] [Google Scholar]
- 7.Du AT, Schuff N, Zhu XP, Jagust WJ, Miller BL, Reed BR, Kramer JH, Mungas D, Yaffe K, Chui HC, Weiner MW. Atrophy rates of entorhinal cortex in AD and normal aging. Neurology. 2003;60(3):481–6. doi: 10.1212/01.wnl.0000044400.11317.ec. [DOI] [PMC free article] [PubMed] [Google Scholar]
- 8.Dunckley T, Beach TG, Ramsey KE, Grover A, Mastroeni D, Walker DG, LaFleur BJ, Coon KD, Brown KM, Caselli R, Kukull W, Higdon R, McKeel D, Morris JC, Hulette C, Schmechel D, Reiman EM, Rogers J, Stephan DA. Gene expression correlates of neurofibrillary tangles in Alzheimer’s disease. Neurobiol Aging. 2006;27(10):1359–71. doi: 10.1016/j.neurobiolaging.2005.08.013. [DOI] [PMC free article] [PubMed] [Google Scholar]
- 9.Frisoni GB, Laakso MP, Beltramello A, Geroldi C, Bianchetti A, Soininen H, Trabucchi M. Hippocampal and entorhinal cortex atrophy in frontotemporal dementia and Alzheimer’s disease. Neurology. 1999;52(1):91–100. doi: 10.1212/wnl.52.1.91. [DOI] [PubMed] [Google Scholar]
- 10.Grupe A, Abraham R, Li Y, Rowland C, Hollingworth P, Morgan A, Jehu L, Segurado R, Stone D, Schadt E, Karnoub M, Nowotny P, Tacey K, Catanese J, Sninsky J, Brayne C, Rubinsztein D, Gill M, Lawlor B, Lovestone S, Holmans P, O’Donovan M, Morris JC, Thal L, Goate A, Owen MJ, Williams J. Evidence for novel susceptibility genes for late-onset Alzheimer’s disease from a genome-wide association study of putative functional variants. Hum Mol Genet. 2007;16(8):865–73. doi: 10.1093/hmg/ddm031. [DOI] [PubMed] [Google Scholar]
- 11.Hua J, Craig DW, Brun M, Webster J, Zismann V, Tembe W, Joshipura K, Huentelman MJ, Dougherty ER, Stephan DA. SNiPer-HD: improved genotype calling accuracy by an expectation-maximization algorithm for high-density SNP arrays. Bioinformatics. 2007;23(1):57–63. doi: 10.1093/bioinformatics/btl536. [DOI] [PubMed] [Google Scholar]
- 12.Ishii K, Kawachi T, Sasaki H, Kono AK, Fukuda T, Kojima Y, Mori E. Voxel-based morphometric comparison between early- and late-onset mild Alzheimer’s disease and assessment of diagnostic performance of z score images. AJNR American journal of neuroradiology. 2005;26(2):333–40. [PMC free article] [PubMed] [Google Scholar]
- 13.Jack CR, Petersen RC, Xu Y, O’Brien PC, Smith GE, Ivnik RJ, Tangalos EG, Kokmen E. Rate of medial temporal lobe atrophy in typical aging and Alzheimer’s disease. Neurology. 1998;51(4):993–9. doi: 10.1212/wnl.51.4.993. [DOI] [PMC free article] [PubMed] [Google Scholar]
- 14.Liang WS, Dunckley T, Beach TG, Grover A, Mastroeni D, Ramsey K, Caselli RJ, Kukull WA, McKeel D, Morris JC, Hulette CM, Schmechel D, Reiman EM, Rogers J, Stephan DA. Altered neuronal gene expression in brain regions differentially affected by Alzheimer’s Disease: A reference data set. Physiol Genomics. 2008 doi: 10.1152/physiolgenomics.00242.2007. [DOI] [PMC free article] [PubMed] [Google Scholar]
- 15.Liang WS, Dunckley T, Beach TG, Grover A, Mastroeni D, Walker DG, Caselli RJ, Kukull WA, McKeel D, Morris JC, Hulette C, Schmechel D, Alexander GE, Reiman EM, Rogers J, Stephan DA. Gene expression profiles in anatomically and functionally distinct regions of the normal aged human brain. Physiol Genomics. 2007;28(3):311–22. doi: 10.1152/physiolgenomics.00208.2006. [DOI] [PMC free article] [PubMed] [Google Scholar]
- 16.Loessner A, Alavi A, Lewandrowski KU, Mozley D, Souder E, Gur RE. Regional cerebral function determined by FDG-PET in healthy volunteers: normal patterns and changes with age. J Nucl Med. 1995;36(7):1141–9. [PubMed] [Google Scholar]
- 17.McKhann G, Drachman D, Folstein M, Katzman R, Price D, Stadlan EM. Clinical diagnosis of Alzheimer’s disease: report of the NINCDS-ADRDA Work Group under the auspices of Department of Health and Human Services Task Force on Alzheimer’s Disease. Neurology. 1984;34(7):939–44. doi: 10.1212/wnl.34.7.939. [DOI] [PubMed] [Google Scholar]
- 18.Metsaars WP, Hauw JJ, van Welsem ME, Duyckaerts C. A grading system of Alzheimer disease lesions in neocortical areas. Neurobiol Aging. 2003;24(4):563–72. doi: 10.1016/s0197-4580(02)00134-3. [DOI] [PubMed] [Google Scholar]
- 19.Mirra SS, Heyman A, McKeel D, Sumi SM, Crain BJ, Brownlee LM, Vogel FS, Hughes JP, van Belle G, Berg L. The Consortium to Establish a Registry for Alzheimer’s Disease (CERAD). Part II. Standardization of the neuropathologic assessment of Alzheimer’s disease. Neurology. 1991;41(4):479–86. doi: 10.1212/wnl.41.4.479. [DOI] [PubMed] [Google Scholar]
- 20.Nacmias B, Bessi V, Bagnoli S, Tedde A, Cellini E, Piccini C, Sorbi S, Bracco L. KIBRA gene variants are associated with episodic memory performance in subjective memory complaints. Neurosci Lett. 2008 doi: 10.1016/j.neulet.2008.03.008. [DOI] [PubMed] [Google Scholar]
- 21.Need AC, Attix DK, McEvoy JM, Cirulli ET, Linney KN, Wagoner AP, Gumbs CE, Giegling I, Moller HJ, Francks C, Muglia P, Roses A, Gibson G, Weale ME, Rujescu D, Goldstein DB. Failure to replicate effect of kibra on human memory in two large cohorts of European origin. Am J Med Genet B Neuropsychiatr Genet. 2008 doi: 10.1002/ajmg.b.30658. [DOI] [PubMed] [Google Scholar]
- 22.Papassotiropoulos A, Stephan DA, Huentelman MJ, Hoerndli FJ, Craig DW, Pearson JV, Huynh KD, Brunner F, Corneveaux J, Osborne D, Wollmer MA, Aerni A, Coluccia D, Hanggi J, Mondadori CR, Buchmann A, Reiman EM, Caselli RJ, Henke K, de Quervain DJ. Common Kibra alleles are associated with human memory performance. Science. 2006;314(5798):475–8. doi: 10.1126/science.1129837. [DOI] [PubMed] [Google Scholar]
- 23.Purcell S, Neale B, Todd-Brown K, Thomas L, Ferreira MA, Bender D, Maller J, Sklar P, de Bakker PI, Daly MJ, Sham PC. PLINK: A Tool Set for Whole-Genome Association and Population-Based Linkage Analyses. Am J Hum Genet. 2007;81(3):559–75. doi: 10.1086/519795. [DOI] [PMC free article] [PubMed] [Google Scholar]
- 24.Reiman EM, Chen K, Alexander GE, Caselli RJ, Bandy D, Osborne D, Saunders AM, Hardy J. Correlations between apolipoprotein E epsilon4 gene dose and brain-imaging measurements of regional hypometabolism. Proc Natl Acad Sci USA. 2005;102(23):8299–302. doi: 10.1073/pnas.0500579102. [DOI] [PMC free article] [PubMed] [Google Scholar]
- 25.Reiman EM, Chen K, Alexander GE, Caselli RJ, Bandy D, Osborne D, Saunders AM, Hardy J. Correlations between apolipoprotein E epsilon4 gene dose and brain-imaging measurements of regional hypometabolism. Proc Natl Acad Sci USA. 2005;102(23):8299–302. doi: 10.1073/pnas.0500579102. [DOI] [PMC free article] [PubMed] [Google Scholar]
- 26.Reiman EM, Chen K, Alexander GE, Caselli RJ, Bandy D, Osborne D, Saunders AM, Hardy J. Functional brain abnormalities in young adults at genetic risk for late-onset Alzheimer’s dementia. Proc Natl Acad Sci U S A. 2004;101(1):284–9. doi: 10.1073/pnas.2635903100. [DOI] [PMC free article] [PubMed] [Google Scholar]
- 27.Reiman EM, Webster JA, Myers AJ, Hardy J, Dunckley T, Zismann VL, Joshipura KD, Pearson JV, Hu-Lince D, Huentelman MJ, Craig DW, Coon KD, Liang WS, Herbert RH, Beach T, Rohrer KC, Zhao AS, Leung D, Bryden L, Marlowe L, Kaleem M, Mastroeni D, Grover A, Heward CB, Ravid R, Rogers J, Hutton ML, Melquist S, Petersen RC, Alexander GE, Caselli RJ, Kukull W, Papassotiropoulos A, Stephan DA. GAB2 alleles modify Alzheimer’s risk in APOE epsilon4 carriers. Neuron. 2007;54(5):713–20. doi: 10.1016/j.neuron.2007.05.022. [DOI] [PMC free article] [PubMed] [Google Scholar]
- 28.Rodriguez-Rodriguez E, Infante J, Llorca J, Mateo I, Sanchez-Quintana C, Garcia-Gorostiaga I, Sanchez-Juan P, Berciano J, Combarros O. Age-dependent association of KIBRA genetic variation and Alzheimer’s disease risk. Neurobiol Aging. 2007 doi: 10.1016/j.neurobiolaging.2007.07.003. [DOI] [PubMed] [Google Scholar]
- 29.Schaper K, Kolsch H, Popp J, Wagner M, Jessen F. KIBRA gene variants are associated with episodic memory in healthy elderly. Neurobiol Aging. 2007 doi: 10.1016/j.neurobiolaging.2007.02.001. [DOI] [PubMed] [Google Scholar]
- 30.Small GW, Ercoli LM, Silverman DH, Huang SC, Komo S, Bookheimer SY, Lavretsky H, Miller K, Siddarth P, Rasgon NL, Mazziotta JC, Saxena S, Wu HM, Mega MS, Cummings JL, Saunders AM, Pericak-Vance MA, Roses AD, Barrio JR, Phelps ME. Cerebral metabolic and cognitive decline in persons at genetic risk for Alzheimer’s disease. Proc Natl Acad Sci USA. 2000;97(11):6037–42. doi: 10.1073/pnas.090106797. [DOI] [PMC free article] [PubMed] [Google Scholar]
- 31.Stern Y. What is cognitive reserve? Theory and research application of the reserve concept. J Int Neuropsychol Soc. 2002;8(3):448–60. [PubMed] [Google Scholar]
- 32.Stern Y, Alexander GE, Prohovnik I, Stricks L, Link B, Lennon MC, Mayeux R. Relationship between lifetime occupation and parietal flow: implications for a reserve against Alzheimer’s disease pathology. Neurology. 1995;45(1):55–60. doi: 10.1212/wnl.45.1.55. [DOI] [PubMed] [Google Scholar]
Associated Data
This section collects any data citations, data availability statements, or supplementary materials included in this article.