Abstract
Study Design
Repeated cross-sectional analysis using national Medicare data from the Dartmouth Atlas Project.
Objectives
To describe recent trends and geographic variation in population-based rates of lumbar fusion spine surgery.
Summary of Background Data
Lumbar fusion rates have increased dramatically during the 80s and even more so in the 90s. The most rapid increase appeared to follow the approval of a new surgical implant device.
Methods
Medicare claims and enrollment data were used to calculate age-, sex- and race-adjusted rates of lumbar laminectomy/discectomy and lumbar fusion for fee-for-service Medicare beneficiaries over age 65 in each of the 306 U.S. Hospital Referral Regions between 1992 and 2003.
Results
Lumbar fusion rates have increased steadily since 1992 (0.3 per 1000 enrollees in 1992 to 1.1 per 1000 enrollees in 2003). Regional rates of lumbar discectomy, laminectomy, and fusion in 1992–1993 were highly correlated to rates of discectomy, laminectomy (R2=0.44) and fusion (R2=0.28) in 2002–2003. There was a nearly 8-fold variation in regional rates of lumbar discectomy and laminectomy between 2002 and 2003. In the case of lumbar fusion there was nearly a 20-fold range in rates among Medicare enrollees between 2002–2003. This represents the largest coefficient of variation seen with any surgical procedure. Medicare spending for inpatient back surgery more than doubled over the decade. Spending for lumbar fusion increased more than 500%, from $75 million to $482 million. In 1992, lumbar fusion represented 14% of total spending for back surgery; by 2003, lumbar fusion accounted for 47% of spending.
Conclusions
The rate of specific procedures within a region or “surgical signature” is remarkably stable over time. However, there has been a marked increase in rates of fusion and a coincident shift and increase in cost. Rates of back surgery were not correlated with the per-capita supply of orthopaedic and neurosurgeons.
Keywords: lumbar surgery rates, trends, spine fusion, cost
INTRODUCTION
There are marked variations in spinal surgery internationally, and between regions in the United States. 5 The United States has the highest rates of spine surgery in the world, despite incidence and prevalence rates of spine disorders that are similar to those found in other countries.6 There remains little or no medical, clinical, or surgical evidence to support such variability.4,7,8
The underlying causes of the international and regional variations found in rates of spine surgery are unknown. Potential factors include lack of scientific evidence, financial incentives and disincentives to surgical intervention, and differences in clinical training and professional opinion. The introduction of new new technology may also play a role.7
This paper examines trends in the rates of laminectomy/discetcomy and fusion in the Medicare population across the US. It provides an updated analysis of rates of lumbar spine surgery in the United States, using methods similar to those in our original reports published in the Dartmouth Atlas series.9 We then discuss the implications of these findings for science policy.
METHODS
Since the publication of the first edition of the Dartmouth Atlas of Health Care in 1996,10 information about population-based, age-, sex-, and race-adjusted rates of particular surgical procedures among U.S. hospital referral regions (HRRs) has been available to the public. Hospital referral regions (HRRs) are aggregations of hospital service areas (HSAs). A hospital service area is a collection of zip codes whose residents receive most of their hospitalizations from the hospitals within that area. Hospital referral regions represent regional health care markets for tertiary medical care and each HRR contains at least one hospital that performs major cardiovascular procedures and neurosurgery.
Medicare claims and enrollment data were used to calculate age-, sex- and race-adjusted rates of lumbar laminectomy/discectomy and lumbar fusion for fee-for-service Medicare beneficiaries over age 65 in each of the 306 U.S. Hospital Referral Regions between 1992 and 2003. The Medicare population in an area that was used as the denominator for the rates in these studies included those alive, age 65 to 99, and not enrolled in a risk-bearing HMO. The numerator for the surgical rates was determined from the MEDPAR (Medicare Part A) claims and was based on all individuals meeting these eligibility criteria that underwent the specified procedure during an inpatient stay within the given year, based on the ICD-9-CM procedure codes shown in Table 1.
Table 1.
ICD-9-CM codes for Back Surgery, Lumbar Discectomy/Laminectomy, and Lumbar Fusion
| Procedure | Procedure Codes | Inclusions & Exclusions |
|---|---|---|
| Total back surgery | 03.0, 03.02, 03.09, 03.6; 78.50, 78.59, 78.60, 78.69, 78.90, 78.99; 80.5, 80.50-52, 80.59; 81.0, 81.00-09 | EXCLUDES Diagnosis codes 140-239.9, 324.1, 630-676, 720.0-9, 730-730.99, 733.1, 733.10, 733.13, 733.95, 733.8, 733.81-82, 805-806.9, 839- 839.59, E800-E849.9 |
| Lumbar discectomy/laminectomy | 80.5, 80.50-52, 80.59 | INCLUDES Diagnosis codes 03.0, 03.09 |
| Lumbar fusion | 81.06-08; also 81.04, 81.05, 81.09, 81.00, 81.0 with inclusions | INCLUDES Diagnosis codes 722.10, 722.73; 721.3, 722.52 722.93; 721.42, 724.02; 724.6, 738.4, 756.11-12; 722.32, 722.83, 724.2, 739.3, 739.4, 846.0-9, 847.2, 847.3 |
Rates based on a count of fewer than 11 observed counts are not displayed for reasons of patient confidentiality. Rates with fewer than 26 expected events are reported in parentheses to indicate lack of statistical precision, as the margin of error in this case is greater than 20%. Rates were adjusted to the age, sex and race distribution of the national Medicare population as follows. The national event rate for each age-sex-race category was computed using the indirect method.
RESULTS
Back Surgery: Discectomy/Laminectomy and Fusion
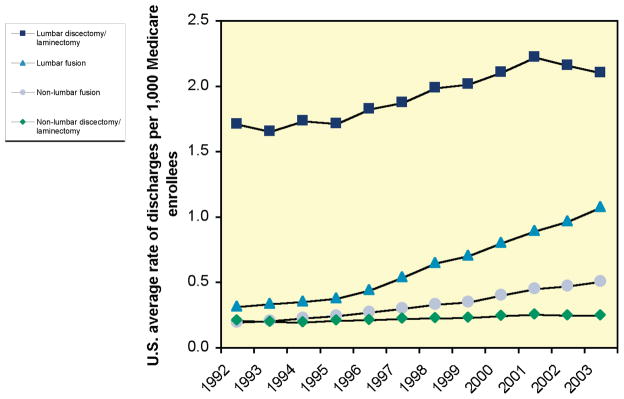
Aggregated rates of lumbar discectomy and laminectomy rose and then fell during the decade 1992–2003. In 1992, the U.S. average rate of lumbar discectomy/laminectomy was 1.7 per 1,000 Medicare enrollees. The rate peaked at 2.2 per 1,000 enrollees in 2001, and then decreased to 2.1 per 1,000 in 2003. By contrast, rates of lumbar fusion rose steadily. In 1992, the U.S. average rate of lumbar fusion was 0.3 per 1,000 Medicare enrollees. The rate increased over the following decade, doubling to 0.6 per 1,000 enrollees in 1998, and reaching 1.1 per 1,000 in 2003.
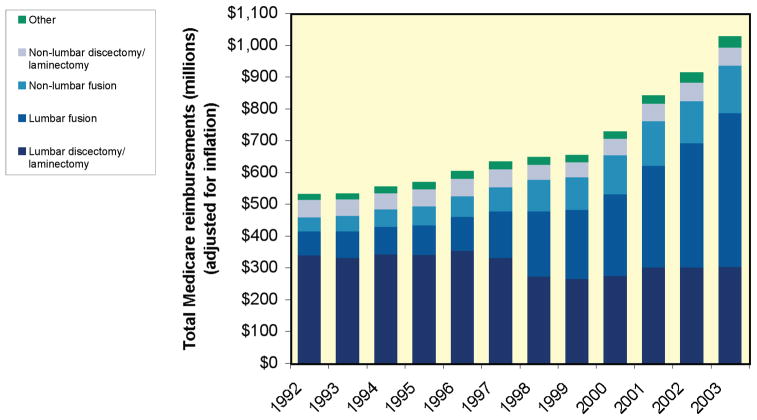
Medicare spending for inpatient back surgery more than doubled over the decade (Figure 2). Inflation-adjusted spending for lumbar discectomy/laminectomy declined by more than 10%, from $342 million in 1992 to $306 million in 2003. Spending for lumbar fusion, by contrast, increased more than 500% during the same period, from $75 million to $482 million. Given the 3-fold increase in procedure rates, this represents both increased volume of fusion as well as increased average cost per case. In 1992, lumbar fusion represented 14% of total spending for back surgery; by 2003, lumbar fusion accounted for 47% of spending.
Figure 2.
Inpatient Medicare Reimbursements (in millions of dollars) for Back Surgery, 1992–2003
The rates of lumbar fusion and lumbar discectomy/laminectomy were positively correlated among hospital referral regions in 2002–03 (Figure 3). There was no association between the changes in lumbar discectomy/laminectomy rates and the change in lumbar fusion rates from 1992–93 to 2002–03 (Figure 4). While in some regions a decline in lumbar discectomy and laminectomy was associated with an increase in lumbar fusion, overall the measures were unrelated (R2 = .00).
Figure 3.
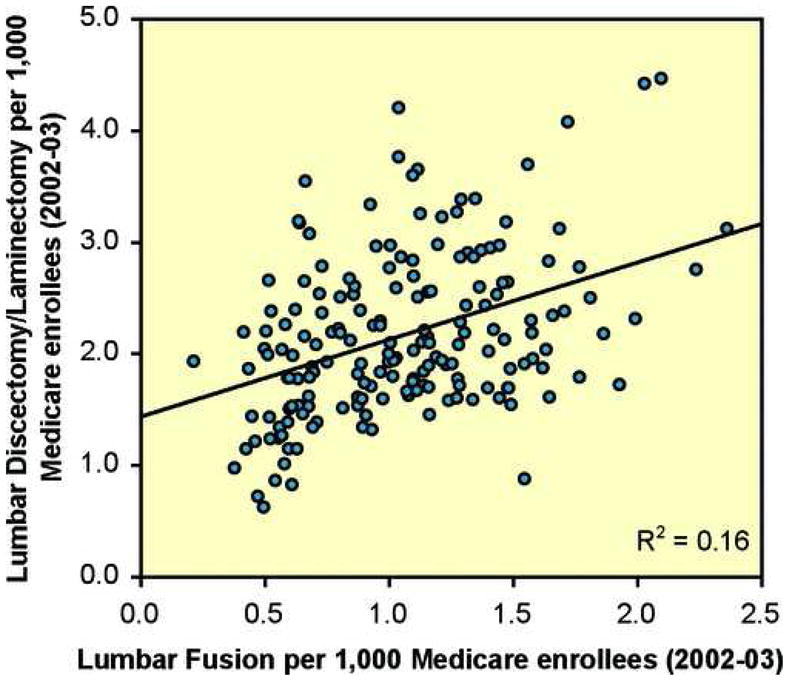
The Relationship between Rates of Lumbar Discectomy/Laminectomy and Lumbar Fusion, 2002–03
Figure 4.
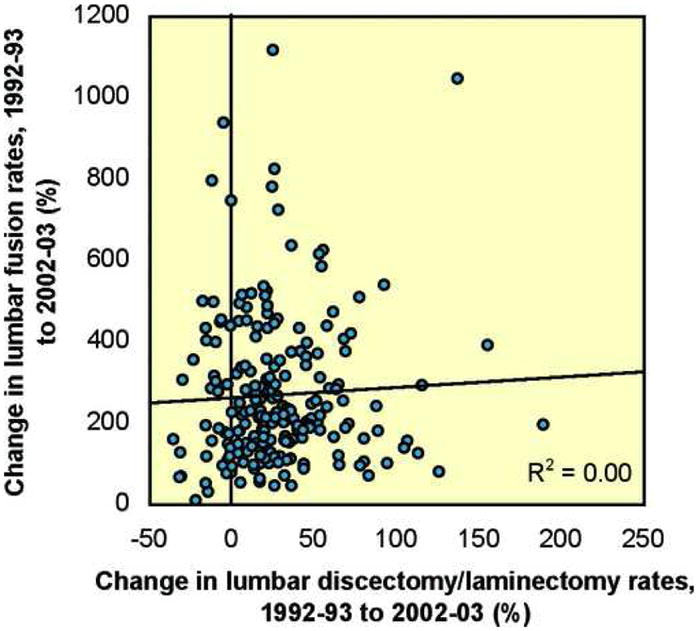
The Relationship between Changes in Rates of Lumbar Discectomy/Laminectomy and Lumbar Fusion, 1992–93 to 2002–03.
Though lumbar fusion increased much more sharply than lumbar discectomy/laminectomy, rates of both procedures in 1992–93 were predictive of rates in 2002–03 (Figures 5 and 6). 44% of the variation in lumbar discectomy/laminectomy rates among HRRs in 2002–03 was explained by the HRR rate in 1992–93, while 28% of the variation in lumbar fusion rates in 2002–03 was explained by the HRR rate in 1992–93.
Figure 5.
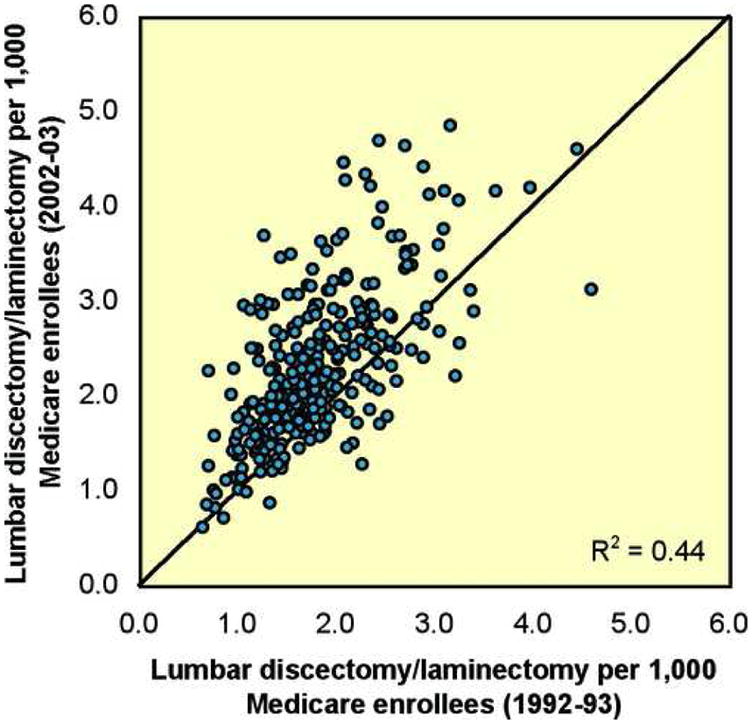
The Relationship Between Rates of Lumbar Discectomy/Laminectomy in 1992–93 and 2002–03
The 45 degree line represents equality between rates; if the dot representing an HRR is located above the line, enrollees in that HRR experienced higher rates of utilization in 2002–03 than in 1992–93.
Figure 6.
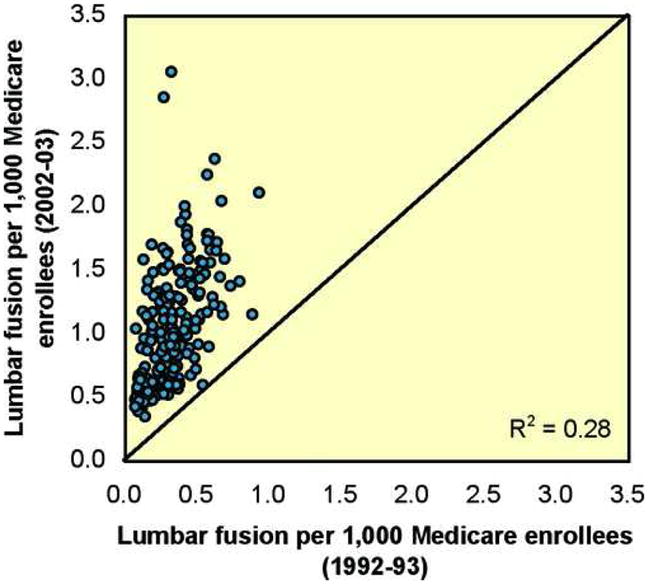
The Relationship Between Rates of Lumbar Fusion in 1992–93 and 2002–03
The 45 degree line represents equality between rates; if the dot representing an HRR is located above the line, enrollees in that HRR experienced higher rates of utilization in 2002–03 than in 1992–93.
Overall rates of back surgery in 1998–99 were not correlated with the per-capita supply of orthopedic and neurosurgeons in hospital referral regions in 1999 (the latest year for which workforce data are available) (Figures 7 and 8), although this data includes all orthopaedic surgeons and neurosurgeons performing many types of surgery and not spine surgeons per se. Rates of lumbar and non-lumbar discectomy/laminectomy and fusion were also not correlated with the supply of either type of surgeon (Table 2). It is possible that procedure rates might be related to the supply of spine surgeons in particular but this has not been evaluated.
Figure 7.
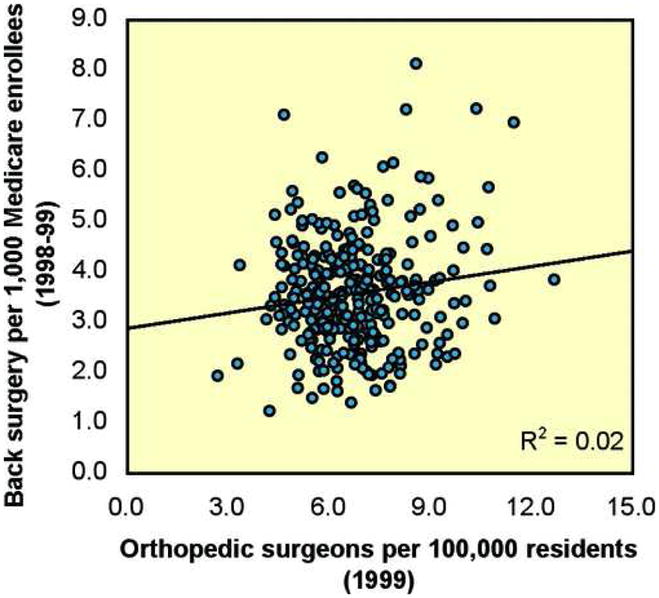
The Relationship Between Orthopedic Surgeons per 100,000 Residents (1999) and Rates of Back Surgery (1998–99)
Figure 8.
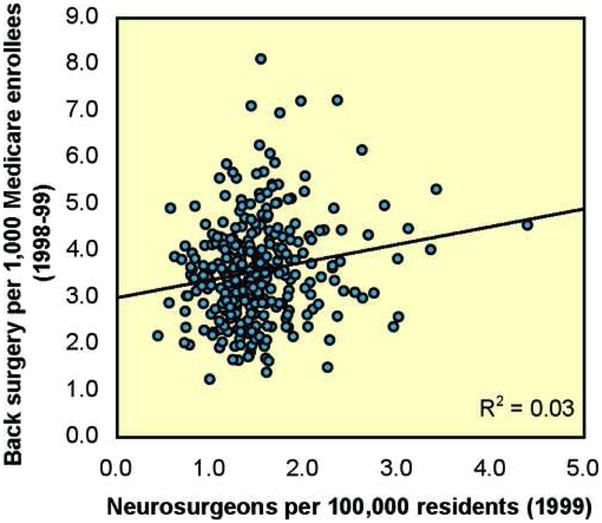
The Relationship Between Neurosurgeons per 100,000 Residents (1999) and Rates of Back Surgery (1998–99)
Table 2.
Associations (R2) Between the Supply of Surgeons (1999) and Rates of Surgery (1998–99)
| Lumbar discectomy/laminectomy | Lumbar fusion | |
|---|---|---|
| Orthopedic surgeons | 0.01 | 0.03 |
| Neurosurgeons | 0.03 | 0.00 |
Rates of lumbar discectomy/laminectomy varied almost eightfold among Medicare enrollees in 2002–03 (Map 1). Among the hospital referral regions where rates were highest were Mason City, Iowa (4.8); Slidell, Louisiana (4.7); Casper, Wyoming (4.6); Bend, Oregon (4.6); and Billings, Montana (4.5). Regions with rates lower than the national average of 2.1 procedures per 1,000 enrollees included the Bronx, New York (0.6); Honolulu (0.7); East Long Island, New York (0.8); Manhattan (0.9); and South Bend, Indiana (0.9).
Map 1. Lumbar Discectomy and Laminectomy.
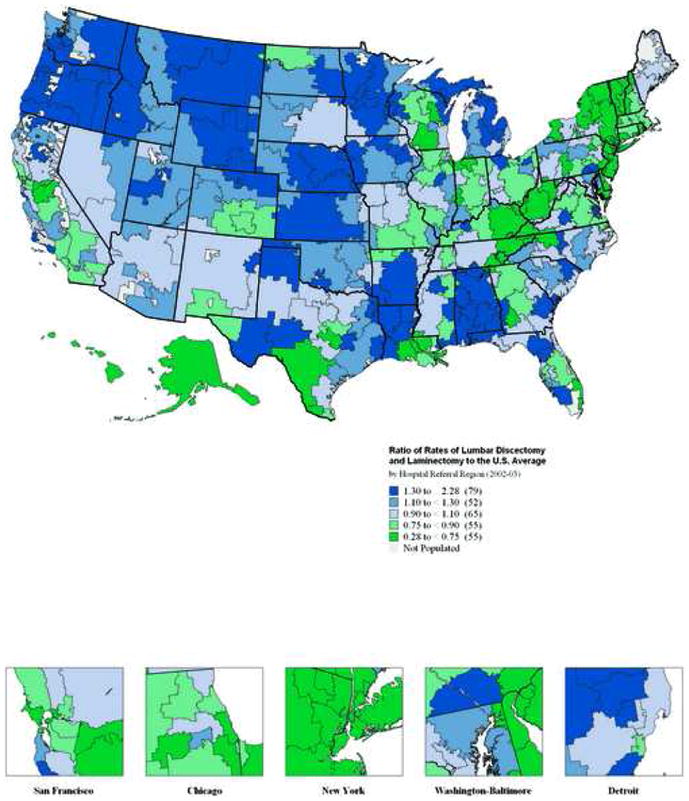
In 79 hospital referral regions, rates of lumbar discectomy and laminectomy were at least 30% higher than the United States average of 2.1 per 1,000 Medicare enrollees. In 55 hospital referral regions, rates were more than 25% lower than the national average.
The regional variation in rates of lumbar fusion among Medicare enrollees in 2002–03 was striking (Map 2). Rates varied by a factor of more than twenty, from 0.2 per 1,000 enrollees to 4.6. Rates of lumbar fusion were highest in the Idaho Falls, Idaho (4.6); Missoula, Montana (3.0); Mason City, Iowa (3.0); Bradenton, Florida (2.9); and Casper, Wyoming (2.7) hospital referral regions. Regions with rates substantially lower than the national average of 1.0 procedure per 1,000 enrollees included Bangor, Maine (0.2); Covington, Kentucky (0.3); Terre Haute, Indiana (0.3); Grand Forks, North Dakota (0.3); and Newark, New Jersey (0.4).
Map 2. Lumbar Fusion.
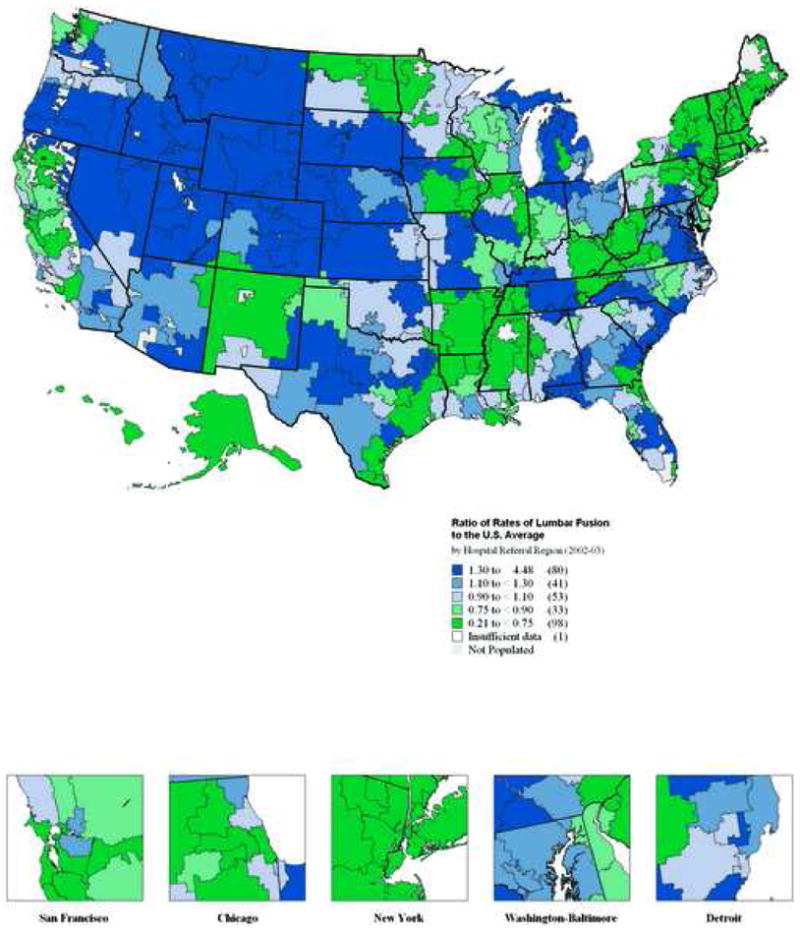
In 80 hospital referral regions, rates of lumbar fusion were at least 30% higher than the United States average of 1.0 per 1,000 Medicare enrollees. In 98 hospital referral regions, rates were more than 25% lower than the national average.
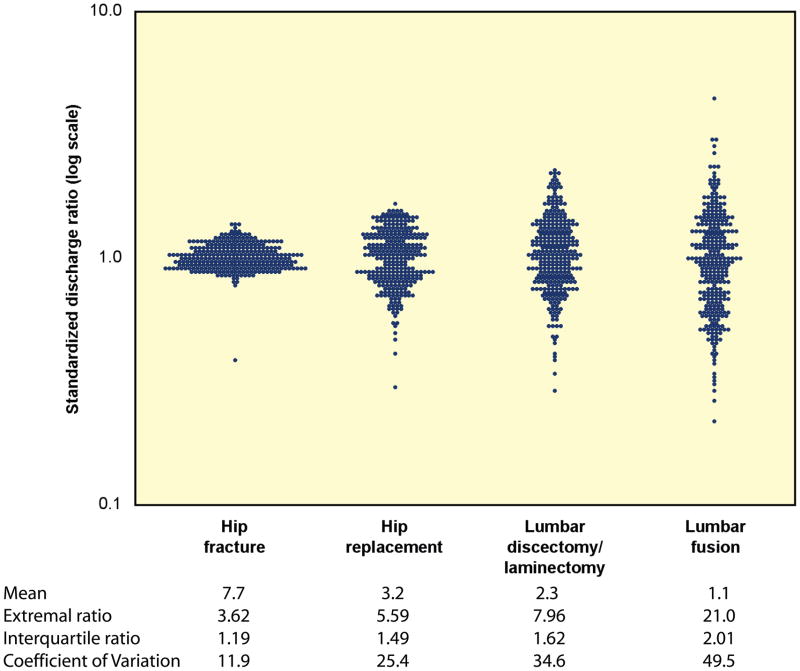
The magnitude of the variability in rates of fusion can be appreciated by directly comparing it to the variability in rates of discetomy/laminectomy and other orthopaedic procedures as seen in Figure 9.
Figure 9.
Comparative magnitude of variability of orthopaedic procedures
DISCUSSION
Rates of spine surgery in the elderly have increased dramatically over the past decade, with the most dramatic increase noted for lumbar fusion. In 2003, Medicare spent over one billion dollars on spine surgery. In 1992, lumbar fusion accounted for only 14% of spending, by 2003, fusion accounted for almost half of total spending on spine surgery. At the same time, rates of lumbar spine fusion varied dramatically across U.S. regions and were substantially more variable than rates of lumbar decompression.
The strengths and limitations of administrative databases for evaluating practice patterns must be kept in mind. We can determine with good precision the rates of different surgeries and procedures across different regions. However, patient characteristics are limited to basic demographic information. Thus, all the rates presented are appropriately adjusted for age, race and gender; however, the clinical indications and proportion of patients operated on for particular pathological conditions is not easily obtainable. Thus we cannot evaluate the appropriateness or inappropriateness of any given procedure. However, we can infer that the rates of fusion cannot all be optimal given the very large variation in rates across regions with demographically similar populations.
Patient preferences are unlikely to explain the dramatic differences in rates observed across U.S. regions. Four sources of evidence support this conclusion. Prior studies have failed to detect systematic differences in patient preferences as the cause of variations in surgical rates.11,12 Striking differences in rates between neighboring geographic regions would appear to be inconsistent with this explanation. Also, an increasing body of experimental research reveals that formal decision aids lead patients to make different decisions than when left to receive routine advice from their clinicians. Finally, the strong correlation of local surgical rates over time – both for lumbar fusion and for lumbar discectomy/laminectomy, is consistent with a model of decision-making in which local physician opinion is an important determinant of local practice.
The evidence base guiding the use of the most variable orthopedic procedure, lumbar back surgery with fusion, is, with few exceptions (e.g., lumbar spondylolisthesis of various etiologies), particularly weak, even though it is the procedure enjoying the most rapid increase in use over the past 10 years. During this period, there has been growing interest in expanding the indications for surgical intervention along with a proliferation of new technologies to address the many causes of low back symptoms. Many have involved fusion additives in the form of devices and more recently biologics, e.g., bone morphogenic proteins. Most all have been brought to market in the absence of randomized trials to test their efficacy and effectiveness. Most have been brought forth based on FDA criteria for safety. Nearly all have demonstrated improved rates of fusion by various methods–clearly an intended outcome–but the effect on patient-based outcomes such as functional health status or quality of life remain uncertain. The real question remains, “Who are the most appropriate candidates for fusion?” How do we make the diagnosis and can we agree?
The scientific evaluation of outcomes for spine surgery has not kept up with the changes in operative techniques.14 Recent reviews of the quality of clinical evidence of surgical treatment of these conditions undertaken by the Cochrane collaboration illustrate the serious weaknesses in the clinical science.15–17 Given the paucity of clinical trials, it is not possible, with few exceptions, to draw conclusions concerning the role of instrumented fusion for a given spinal condition, much less to evaluate the relative efficacy or effectiveness of any particular device on patient outcomes.
Scientific uncertainty contributes to variability in clinical decision-making. Major surgery is often conducted without an adequate scientific basis for making a reasonably accurate estimate of the likely outcomes. This is clearly the case for some degenerative conditions of the back. Left alone, practice variations will not go away. Expansion of the research agenda will require not only the early evaluation of new technologies and new theories about the use of current technologies, but also the ongoing evaluation of existing practices.
Effective technology assessment will therefore require the mobilization of both academic medical centers and physicians in community practice, and will require support from funding and regulatory agencies such as, in the US, the NIH, the FDA and the Centers for Medicare and Medicaid Services (CMS). One of these initiatives is the reengineering of the clinical research enterprise, which, we believe, is inevitably about patient preferences and practice variation. But for such research to be successful there must be broad acceptance by the clinician community and by patients of the need for all patients and physicians to participate in the ongoing evaluation of new and existing technologies. The reengineering required for evaluation research must therefore move beyond the confines of the laboratory or even the wards of single institutions to involve the patients in everyday practice.4
Patients who suffer with lower spine disorders are numerous and unlikely to disappear. The ability to do randomized trials is not the question; the question is, given the necessary resources why aren’t we doing more?
KEY POINTS.
Lumbar surgery rates, especially those for fusion, have increased markedly in the decade between 1992 and 2003.
Rates of spine surgery are among the most variable of all surgeries.
The underlying causes of the international and regional variations found in rates of spine surgery include lack of scientific evidence, financial incentives and disincentives to surgical intervention, and differences in clinical training and professional opinion.
The mobilization of talent and focus of interest required to meet the larger task of improving the scientific basis of everyday practice will require the active participation of the funding agencies and academic medical centers.
Figure 1.
Trends in Rates of Discectomy/Laminectomy and Fusion, 1992–2003
Acknowledgments
The authors wish to acknowledge funding from the following sources: The National Institute of Arthritis and Musculoskeletal and Skin Diseases (U01-AR45444-01A1) and the Office of Research on Women’s Health, the National Institutes of Health, and the National Institute of Occupational Safety and Health, the Centers for Disease Control and Prevention, and the National Institute of Aging (1-P01-AG19783-01). The Multidisciplinary Clinical Research Center in Musculoskeletal Diseases is funded by NIAMS (P60-AR048094-01A1). Dr. Lurie is supported by a Research Career Award from NIAMS (1 K23 AR 048138-01). Dr. Olson is supported by a NRSA Orthopaedic Resident/Researcher program grant from NIAMS (1 T32 AR049710-03).
References
- 1.Boden S, McCowin P, Davis D. Abnormal magnetic-resonance scans of the lumbar spine in asymptomatic subjects: A prospective investigation. Journal of Bone and Joint Surgery. 1990;72A:403–8. [PubMed] [Google Scholar]
- 2.Deyo RA, Weinstein JN. Low back pain. N Engl J Med. 2001;344:363–70. doi: 10.1056/NEJM200102013440508. [DOI] [PubMed] [Google Scholar]
- 3.Jensen M, Brant-Zawadzki M, Obuchowski N. Magnetic resonance imaging of the lumbar spine in people without back pain. New England Journal of Medicine. 1994;331:69–73. doi: 10.1056/NEJM199407143310201. [DOI] [PubMed] [Google Scholar]
- 4.Weinstein JN, Bronner KK, Morgan TS, Wennberg JE. Trends and geographic variations in major surgery for degenerative diseases of the hip, knee, and spine. Health Aff (Millwood) 2004;(Suppl Web Exclusive):VAR81–9. doi: 10.1377/hlthaff.var.81. [DOI] [PubMed] [Google Scholar]
- 5.Cherkin DC, Deyo RA, Loeser JD, Bush T, Waddell G. An International Comparison of Back Surgery Rates. Spine. 1994;19:1201–6. doi: 10.1097/00007632-199405310-00001. [DOI] [PubMed] [Google Scholar]
- 6.Ehrlich GE. Low back pain. Bull World Health Organ. 2003;81:671–6. [PMC free article] [PubMed] [Google Scholar]
- 7.Deyo RA, Gray DT, Kreuter W, Mirza S, Martin BI. United States trends in lumbar fusion surgery for degenerative conditions. Spine. 2005;30:1441–5. doi: 10.1097/01.brs.0000166503.37969.8a. discussion 6–7. [DOI] [PubMed] [Google Scholar]
- 8.Irwin ZN, Hilibrand A, Gustavel M, McLain R, Shaffer W, Myers M, Glaser J, Hart RA. Variation in surgical decision making for degenerative spinal disorders. Part I: lumbar spine Spine. 2005;30:2208–13. doi: 10.1097/01.brs.0000181057.60012.08. [DOI] [PubMed] [Google Scholar]
- 9.Dartmouth Atlas Working Group JW, PI. Dartmouth Atlas of Musculoskeletal Health Careed. Chicago, IL: American Hospital Association Press; 2000. [Google Scholar]
- 10.Wennberg JE, MDMPH, editors. The Dartmouth Atlas of Health Care in the United States. 1. Hanover, NH: The Center for the Evaluative Clinical Sciences at Dartmouth Medical School in association with American Hospital Publishing, Inc; [Google Scholar]
- 11.Hawker GA, Wright JG, Coyte PC, Williams JI, Harvey B, Glazier R, Wilkins A, Badley EM. Determining the need for hip and knee arthroplasty: the role of clinical severity and patients’ preferences. Med Care. 2001;39:206–16. doi: 10.1097/00005650-200103000-00002. [DOI] [PubMed] [Google Scholar]
- 12.Smith DS, Krygiel J, Nease RF, Jr, Sumner W, 2nd, Catalona WJ. Patient preferences for outcomes associated with surgical management of prostate cancer. J Urol. 2002;167:2117–22. [PubMed] [Google Scholar]
- 13.Skinner JS, Staiger DO, Fisher ES. Is technological change in medicine always worth it? The case of acute myocardial infarction. Health Aff (Millwood) 2006;25:w34–47. doi: 10.1377/hlthaff.25.w34. [DOI] [PMC free article] [PubMed] [Google Scholar]
- 14.Gibson JN, Grant IC, Waddell G. The Cochrane review of surgery for lumbar disc prolapse and degenerative lumbar spondylosis. Spine. 1999;24:1820–32. doi: 10.1097/00007632-199909010-00012. [DOI] [PubMed] [Google Scholar]
- 15.Fouyas IP, Statham PF, Sandercock PA. Cochrane review on the role of surgery in cervical spondylotic radiculomyelopathy. Spine. 2002;27:736–47. doi: 10.1097/00007632-200204010-00011. [DOI] [PubMed] [Google Scholar]
- 16.Jellema P, van Tulder MW, van Poppel MN, Nachemson AL, Bouter LM. Lumbar supports for prevention and treatment of low back pain: a systematic review within the framework of the Cochrane Back Review Group. Spine. 2001;26:377–86. doi: 10.1097/00007632-200102150-00014. [DOI] [PubMed] [Google Scholar]
- 17.Ostelo RW, de Vet HC, Waddell G, Kerckhoffs MR, Leffers P, van Tulder M. Rehabilitation following first-time lumbar disc surgery: a systematic review within the framework of the cochrane collaboration. Spine. 2003;28:209–18. doi: 10.1097/01.BRS.0000042520.62951.28. [DOI] [PubMed] [Google Scholar]
- 18.Weinstein JN. An altruistic approach to clinical trials: the national clinical trials consortium (NCTC) Spine. 2006;31:1–3. doi: 10.1097/01.brs.0000195395.69653.3a. [DOI] [PubMed] [Google Scholar]


