

Abstract
Objective
Cerebral edema is a devastating complication of pediatric diabetic ketoacidosis. We aimed to examine blood– brain barrier permeability during treatment of diabetic ketoacidosis in children.
Design
Prospective observational study.
Setting
Seattle Children’s Hospital, Seattle, WA.
Patients
Children admitted with diabetic ketoacidosis (pH <7.3, HCO3 <15 mEq/L, glucose >300 mg/dL, and ketosis).
Interventions
None.
Measurements and Main Results
Subjects underwent two serial paired contrast-enhanced perfusion (gadolinium) and diffusion magnetic resonance imaging scans. Change in whole brain and regional blood– brain barrier permeability (permeability ratio*100 and % permeability ratio change) between illness and recovery were determined. Time 0 reflects start of insulin treatment. Thirteen children (median age 10.0 ± 1.1 yrs; seven female) with diabetic ketoacidosis were enrolled. Permeability ratio increased from time 1 (first magnetic resonance image after time 0) to time 2 (second magnetic resonance image after time 0) in the frontal cortex (ten of 13 subjects), occipital cortex (ten of 13 subjects), and basal ganglia (nine of 13). Whole brain permeability ratio increased from time 1 to time 2 (160%) and regional increase in permeability ratio was greatest in the frontal cortex (148%) compared with the occipital cortex (128%) and basal ganglia (112%).
Conclusions
Overall, whole brain and regional blood– brain barrier permeability increased in most subjects during diabetic ketoacidosis treatment. The frontal region had more blood– brain barrier permeability than other brain regions examined.
Keywords: blood– brain barrier, diabetic ketoacidosis, permeability
Diabetic ketoacidosis (DKA) is a frequent presentation of type I diabetes in children, occurring with an incidence of 15% to 70% worldwide and approximately 25% in the United States (1, 2). DKA also occurs in children with known diabetes with acute illness or poor adherence to the recommended diabetes management. Cerebral edema (CE) is a rare but devastating complication of pediatric DKA, occurring in <1% of cases. With a suggested mortality rate of 20% to 50%, CE represents the leading cause of death in pediatric type 1 diabetes and leaves significant neurologic morbidity in 35% to 40% of survivors (3–7). However, the etiology of CE and the strategies to prevent this complication remain unknown.
Investigations into the pathophysiology of CE in pediatric DKA suggest both cytotoxic and vasogenic pathways (6 – 8). A large retrospective case– control study comparing clinical features of children with DKA with and without CE suggested hyperventilation, elevated blood urea nitrogen, and treatment with bicarbonate were associated with a higher incidence of CE with increases in relative risk as high as 4.2 for the individual risk factors (6). The authors concluded that dehydration and cerebral ischemia cause cytotoxic injury and thus the observed CE. Yet, despite the epidemiologic data associating hypocapnia with clinical CE, markers of cerebral ischemia are not elevated during DKA treatment (6). Alternatively, proponents of a vasogenic mechanism of CE formation note that normal cerebral blood flow velocities have been demonstrated despite hypocapnia in DKA, demonstrating relative cerebral hyperemia and that cerebral autoregulation is abnormal (7). Magnetic resonance imaging (MRI) examinations of children acutely ill with DKA show a decrease in apparent diffusion coefficient from initial to after recovery in most brain areas and shorter mean transit times, both suggesting a vasogenic process, as the predominant mechanism of edema formation rather than osmotic cellular swelling (8).
The etiology of DKA-related CE is likely multifactorial and not simply the result of either cerebral oligemia (low cerebral blood flow) or cerebral hyperemia (high cerebral blood flow) alone, but rather the result of an interplay of complex pathophysiological processes involving the brain (9 –13). The formation of vasogenic edema may have several additive components such that only a small proportion of patients with DKA progresses to clinical CE. We reasoned that vasogenic edema would be worsened when blood– brain barrier (BBB) integrity was compromised. Although microvascular complications are well described in diabetes and BBB dysfunction and increased BBB permeability lead to CE in animal studies (9), no human studies characterize the BBB in DKA. We hypothesized that BBB permeability is high early in the course of DKA. The aim of this study, therefore, was to examine BBB permeability, during illness and recovery, as an indicator of BBB integrity in DKA.
MATERIALS AND METHODS
After institutional approval from the Seattle Children’s Hospital Human Subjects Review Committee, we performed a prospective cohort study in children admitted with DKA. Consent was obtained from parents or legal guardians and assent was obtained from patients per institutional protocol.
Study Participants
After approach by the clinical team, consent/assent, patients to be admitted to Seattle Children’s with the diagnosis of DKA were consented and prospectively enrolled in the emergency department, pediatric intensive care unit, or hospital ward. Eligibility criteria included: age ≤17 yrs, pH <7.3, glucose >00 mg/dL, HCO3 <15 mEq/L, and urinary ketosis. We excluded children with neurologic or hemodynamic instability, allergy to gadolinium, renal insufficiency, and patients with no available parents/guardians at the time of enrollment. We reviewed medical records for eligibility, relevant medical history, and physiological data.
MRI Acquisition During Illness and Recovery
Study participants underwent a MRI if they were considered hemodynamically stable by the treating physician and if they were deemed cooperative for MRI scanning without sedation. No sedation was used to obtain MRI scans because of the confounding effects of sedative agents on cerebrovascular physiology.
Children admitted with DKA underwent two serial paired contrast-enhanced perfusion and diffusion MRI scans: during illness and recovery. Imaging during illness was operationalized and defined in relation to start of insulin therapy (treatment start). The illness period was defined as the first 12 to 24 hrs after treatment start and we aimed to obtain the first MRI during this period of illness (time 1). The recovery period was defined as between 36 and 72 hrs after treatment start and we aimed to obtain the second MRI during this recovery time period (time 2). Additionally, at least 12 hrs must have lapsed between the first and second MRI scans for each patient. Change in whole brain and regional BBB permeability between the two MRI time points (times 1 and 2) were determined.
Contrast-enhanced MRI scans were performed on a Siemens 1.5-T Symphony (software version syngo MR 2004A 4VA25A) or Avanto version syngo B-13 or 15 scanner (Siemens, Erlangen, Germany). An axial, sagittal, and coronal localizer MRI scan was performed with gradient echo (TR/TE = 20/5 msec). Contrast-enhanced imaging was performed with injection of 10 mL of Magnevist gadolinium (Gd-DTPA) using a power injector at 3 mL/sec and the following acquisition parameters: axial spin-echo echoplanar two-dimensional pulse sequence, TR/TE 2400/47 msec, 20 slices, 50 to 60 time volumes, phase-encoded steps 112, reconstructed matrix 128 × 128, slice thickness/gap 5/2 mm, flip angle 90°, field of view 230 mm, and pixel spacing 1.875 × 1.875 mm.
BBB Permeability
For the permeability analysis, the first stage analysis was preformed using software developed at Oxford University called “Functional Magnetic Resonance Imaging of the Brain Software Library” (abbreviated as FSL, FEAT Expert Analysis Tool Version 5.4 in FMRIB’s Software Library, www.fmrib.ox.ac.uk/fsl). This first stage analysis includes: 1) motion correction using FSL software called Motion Corrected FMRIB’s Linear Image Registration Tool (10); 2) non-brain removal using Brain Extraction Tool (11); and 3) spatial smoothing using a Gaussian kernel of full-width half maximum 3 mm (no temporal filtering).
Time-series statistical analysis was then carried out to calculate permeability parametric maps after preprocessing using custom software developed at the University of Washington. Permeability surface area product (PS) maps were calculated based on the algorithm developed by Demsar et al (12), which uses the time activity curves measured from dynamic MRI scanning, in which repeated scans are made with a bolus injection. The fractional leak rate of contrast agent through the BBB is determined from the slope of the line resulting when the concentration of contrast agent in the vasculature is divided by the concentration of contrast agent in. This methodology uses a model that assumes that little or none of the contrast agent that enters the extravascular space returns to the intravascular compartment during the experiment. This technique has been used with small molecular size (Gd-DTPA) as well as macromolecular contrast agents (12) and without albumin (13). Leakage of Gadolinium contrast agent (Gd-DTPA) through a defective BBB is measured quantitatively based on the time activity curve measured from dynamic MRI scanning, in which repeated scans are made with a bolus injection. We acknowledge that PS does not fully correspond to permeability but is related to the permeability surface area product of the capillary bed in the nonflow-limited case.
Larsson and Tofts (14) have shown that the transfer constant (the PS per unit volume of tissue) of the defective BBB in multiple sclerosis is in the range 1 to 12.10 (−4) s−1. These are the same units that are used in this study. We expect the PS values to be <1.0 s−1 for normal brain. For the whole brain, the permeability ratio was calculated by dividing the number of brain voxels exceeding a permeability PS threshold of 0.0007 by the total number of brain voxels to normalize for brain volume (this same threshold was used for all subjects). For regions of interest (frontal, occipital, and basal ganglia), the permeability ratio was calculated by dividing the number of brain voxels exceeding a permeability PS threshold of 0.0007 by the total number of voxels within each region. The concept of a permeability threshold has been used in previously published studies (15, 16). For example, Qiao et al used PS values with a cutoff point to differentiate between adenoma and metastasis (16) and Aviv et al (15) used a permeability threshold for detection of hemorrhagic transformation of ischemic stroke. The threshold of 0.0007 was found by applying a histogram to the whole brain PS values and finding the threshold where the intensity of the histogram was <5% of the peak histogram intensity (which appeared in the histogram bin where the PS value was .0001). A permeability threshold was used because most of the brain had near normal permeability values and only some portions of the brain had elevated values. By using a threshold, our software was able to count the number of voxels that exceeded the threshold. Without a threshold applied, the DKA effect would have been difficult to detect. The threshold was chosen to mask out the low brain permeability regions found in periventricular white matter regions and focus on the part of the brain areas with known elevated permeability. The threshold and permeability technique were quantitatively crossvalidated by comparing the permeability thresholded ratio values calculated with our modified Demsar technique with the permeability values calculated with the T1 map technique as described by Zaharchuk (17). Using 116 brain regions, a significant Pearson’s correlation was found between the two techniques for cross validation (tstat = 8.37, p < .00001). Individual permeability PS maps were calculated for each subject for each time point. This permeability ratio is an indication of amount of brain that had high permeability values. Whole brain and regional analyses of the frontal cortex, occipital cortex, and basal ganglia were performed for each MRI scan. Our technique for assessing permeability used first-pass kinetics similar to Law et al (18) who validated a similar technique using first-pass kinetics to measure permeability in gliomas.
Statistical Analysis
The clinical characteristics of all patients enrolled in this study are presented using descriptive statistics. Permeability data are presented together in the figures and also separately for two groups of patients: 1) 11 of 13 who received MRI scans at predetermined MRI times; and 2) two of 13 children whose MRI scan times were delayed because of clinical CE. The clinical and MRI characteristics of these two patients are described separately.
Treatment start was defined by start of insulin administration (time 0), regardless of transfer status. We operationalized the times of first (time 1) and second MRI (time 2) scan times from time 0 (time postinsulin) and by range because it is not possible to ensure that in each and every case subjects can receive MRI scanning at the exact same time as a result of clinical stability status, MRI availability, and in some cases, transport to Seattle Childrens from an outside facility.
Permeability ratio, representing BBB permeability, was calculated for the whole brain and for the three select regions of interest: frontal cortex (anterior cerebral circulation), occipital cortex (posterior circulation), and basal ganglia (deep structure) for time 1 and time 2. The difference in permeability ratio between time 1 and time 2 was examined to determine the change in permeability between illness and recovery. To compare the increase in permeability ratio by region, we calculated the percent increase for each region of interest and for the whole brain by comparing the medians for the group at time 1 vs. time 2 using a paired Students t test; this approach adjusts for those subjects who contributed low permeability ratios and skewed the data. Data are presented as median ± SEM and p < .05 reflects significance.
RESULTS
Demographic and Baseline Clinical Characteristics
Figure 1 shows the flowchart of screened, approached, consented, and enrolled subjects (Table 1). The median admission pH was higher among screened and not enrolled vs. enrolled subjects (pH 7.41 ± .11 vs. pH 7.11 ± 0.05 mm Hg; p < .001), but there was no difference in median age between the two groups (10 ± 1.1 vs. 9 ± 1.7 yrs; p = .21). All 13 children who were enrolled completed both sets of MRIs; there were no protocol violations. Thirteen children, median age of 10 ± 1.1 yrs (range, 8–17 yrs), completed the study protocol without adverse events. Seven subjects were female and six subjects were newly diagnosed. Seven children were transferred to Seattle Children’s from an outside facility and nine were admitted to the pediatric intensive care unit for treatment. Pretreatment blood gas values showed median values of pH 7.11 ± 0.05 mm Hg, pvCO2 19 ± 2.3 mm Hg, glucose 475 ± 117 g/dL, and HCO3 7.0 ± 1.2 mEq/L with improvement in these parameters after 24 hrs of therapy to pH 7.33 ± 0.03, pvCO2 34 ± 1.9 mm Hg, and HCO3 18.0 ± 1.3 mEq/L. All children were treated with an intravenous insulin infusion (0.1 μm/kg/hr) and hydration with intravenous fluids (10 –20-mL/kg bolus followed by a maintenance infusion of crystalloid) for DKA before MRI scanning. Admission clinical data are given in Table 1.
Figure 1.
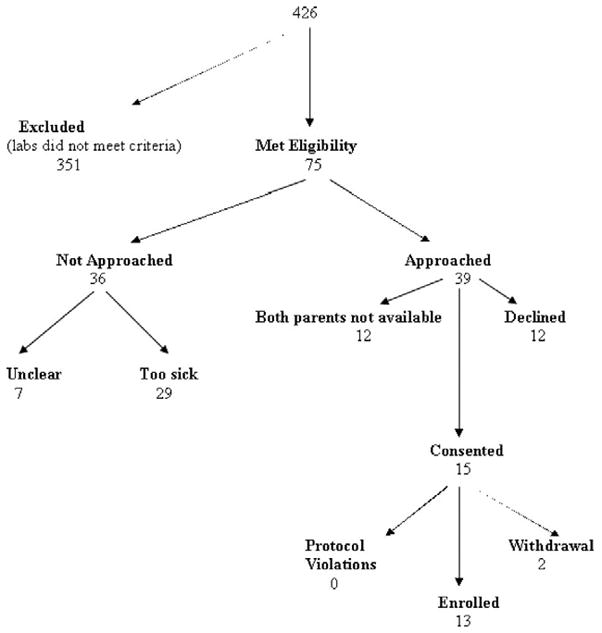
Flowchart for subject screening and enrollment.
Table 1.
Admission characteristics of 13 children with diabetic ketoacidosis
| Subject Number | Age, yrs/Gender | New Onset | Weight, kg | Glucose, g/dL | Blood Gas (pH/pVCO2/HCO3) | Calculated Serum Osmolarity, mOsm/L | Blood Urea Nitrogen, g/dL | Clinical Cerebral Edema |
|---|---|---|---|---|---|---|---|---|
| 3 | 10/M | Y | 60 | 1670 | 7.25/30/14 | 448 | 77 | — |
| 10 | 17/F | N | 100 | 346 | 7.0/20//11 | 319 | 15 | — |
| 12 | 13/F | N | 56 | 698 | 7.19/30/13 | 335 | 16 | — |
| 16a,b | 12/M | N | 58 | 475 | 7.20/19/7 | 301 | 14 | M, HS, MV, ICP, NS |
| 18 | 12/M | N | 34 | 459 | 6.63/6/<5 | 317 | 21 | |
| 21b | 9/F | Y | 44 | 1200 | 6.95/17/<5 | 394 | 21 | M |
| 22 | 8/M | Y | 33 | 1200 | 7.13/—/8 | 379 | 10 | |
| 25a,b | 10/F | Y | 33 | 453 | 6.81/15/1 | 453 | 13 | M, MV, ICP, NS |
| 26 | 9/M | Y | 27 | 459 | 7.14/24/8 | 284 | 29 | |
| 28 | 10/F | Y | 43 | 503 | 6.95/11/2 | 310 | 13 | |
| 29 | 12/F | N | 52 | 250 | 7.28/33/14 | 296 | 19 | |
| 32 | 10/M | N | 32 | 533 | 7.11/16/5 | 310 | 30 | |
| 39 | 17/F | N | 68 | 419 | 7.05/19/5 | 302 | 9 |
M, male; F, female; Y, yes; N, no; M, mannitol; HS, hypertonic saline; MV, mechanical ventilation; ICP, intracranial pressure monitoring; NS, neurologic sequelae.
Subjects 16 and 25 received received ICP monitoring and treatment for clinical cerebral edema;
subjects 16, 21, and 25 received hyperosmolar therapy for suspected cerebral edema.
Three (subjects 16, 21, and 25) of the 13 subjects were treated with either mannitol or hypertonic saline for suspected clinical edema. Two (subjects 16 and 25) patients received head computed tomographic scans and intracranial pressure (ICP) monitoring in the pediatric intensive care unit. Initial ICP values were 5 mm Hg and 8 mm Hg, respectively; both had received hyperosmolar therapy before ICP monitoring.
Neurologic Findings After Discharge From the Intensive Care Unit
Both subjects 16 and 25 required neurology follow-up for persistent neurologic findings after discharge from the pediatric intensive care unit. Subject 16 had an incidental finding of Arnold-Chiari malformation and developed subtle but persistent mental status changes, which resolved by the 1-month visit. Subject 25 was evaluated for left-sided upper and lower extremity weakness with resolution of weakness at one month follow-up but the development of numbness and tingling of her left lower extremity, resembling neuropathic pain.
MRI Acquisition
There were no complications as a result of MRI scanning and there were no adverse reactions to gadolinium. The timing of MRI scans after the start of DKA treatment start (time 0) was not exactly the same for all patients as a result of consent, patient care, and/or logistic issues. However, 13 of 15 children underwent the first and second MRI scans at the desired times: the first scan ranged from 14 to 24 hrs (21 ± 1 hrs) and the second MRI scan ranged from 40 to 58 hrs (45 ± 2 hrs). Time between first and second MRI scans was 12 hrs for all patients (range, 14–38 hrs; 24 ± 2 hrs). The first MRI scan time for the two children who received ICP monitoring (subjects 16 and 25) was delayed until discontinuation of ICP monitoring: The first MRI scan times for these two subjects were 27 and 35 hrs (from time 0) and the second MRI scan times were 58 and 64 hrs, respectively.
The closest time of available data pertaining to median osmolality and acid base to MRI scan was shorter for MRI 1 than MRI 2 (3 ± 4 [range, 1–5] vs. 6 ± 2 (range, 4–8), reflecting recovery at MRI 2 compared with MRI 1. Median calculated serum osmolality was higher closer to the time of the first MRI scan (322 ± 12 vs. 302 ± 4 mOsm/mL; p < .01).
BBB Permeability
Ten of the 13 subjects (subjects 3, 12, 18, 21, 22, 25, 26, 28, 32, and 39) had higher whole brain permeability ratio at time 2 compared with time 1, whereas three of 13 subjects (subjects 10, 16, and 29) had a decrease in whole brain permeability ratio (Table 2; Figs. 2A–D and 3). Overall, permeability ratio increased from time 1 to time 2 in all regions examined: frontal lobe (ten of 13), occipital lobe (ten of 13), and basal ganglia (nine of 13; Fig. 2A–D). Median percentage regional increase in permeability ratio was greatest in the frontal lobe: whole brain (160%), frontal cortex (148%), occipital cortex (128%) and basal ganglia (112%). Figure 2A–D shows the general increase in permeability ratio between time 1 and time 2 during DKA treatment for each of the 13 subjects by whole brain and by region. Figure 3 shows increase in BBB permeability (PS) during DKA treatment in two randomly selected subjects.
Table 2.
Change in whole brain blood– brain barrier permeability (permeability ratio) in 13 children with diabetic ketoacidosisa
| Subject Number | First and Second Magnetic Resonance Imaging Times (hrs) After Treatment Start (Time 0) | Permeability Ratio*100 | Percent Permeability Change |
|---|---|---|---|
| 3 | 24 | 3.51 | |
| 43 | 13.32 | +279 | |
| 10 | 14 | 3.90 | |
| 45 | 2.21 | −43 | |
| 12 | 20 | 0.19 | |
| 58 | 0.76 | +303 | |
| 16b | 27 | 5.05 | |
| 64 | 3.78 | −25 | |
| 18 | 24 | 0.28 | |
| 40 | 6.83 | +2301 | |
| 21c | 22 | 2.40 | |
| 53 | 9.45 | +294 | |
| 22 | 24 | 7.76 | |
| 47 | 15.29 | +97 | |
| 35 | 2.46 | ||
| 25b | 58 | 5.96 | +142 |
| 20 | 2.09 | ||
| 26 | 43 | 7.27 | +248 |
| 24 | 2.27 | ||
| 28 | 46 | 19.9 | +774 |
| 29 | 6.7 | ||
| 29 | 46 | 3.8 | −43 |
| 14 | 0.76 | ||
| 32 | 40 | 1.85 | +143 |
| 23 | 3.4 | ||
| 39 | 47 | 9.3 | +172 |
Overall, the percent increase in permeability ratio was 160%. Time after start of diabetic keratoacidosis treatment start is in hours and time 0 = treatment start (insulin therapy). For the whole brain, permeability ratio is the number of voxels greater than critical threshold (0.0007) divided by the total brain voxels. Individual percent change is calculated by using the difference percentage from time 1 to time 2, whereas overall change was determined by percentage difference of the medians for the cohort;
subjects 16 and 25 received intracranial pressure monitoring monitoring for cerebral edema; hence, their magnetic resonance imaging times varied;
subject 21 received hyperosmolar therapy for suspected cerebral edema.
Figure 2.

Change in whole brain and regional blood– brain barrier permeability in 13 children with diabetic ketoacidosis. Two subjects underwent the first magnetic resonance imaging (MRI) scan outside the a priori specified time periods because of concerns of cerebral edema. The remainder of subjects underwent the first MRI scan 12 to 24 hrs after insulin start and the second MRI scan between 36 and 72 hrs after insulin start. A, Increase in whole brain blood– brain barrier permeability in ten of 3 patients between time 1 (12–35 hrs) and time 2 (40 – 64 hrs) after insulin start. B, Increase in frontal lobe blood– brain barrier permeability in ten of 13 patients between time 1 (12–35 hrs) and time 2 (40 – 64 hrs) after insulin start. C, Increase in occipital lobe blood brain barrier permeability in ten of 13 subjects between time 1 (12–35 hrs) and time 2 (40 – 64 hrs) after insulin start. D, Increase in basal ganglia blood– brain barrier permeability in nine of 13 subjects between time 1 (12–35 hrs after insulin start) and time 2 (40 – 64 hrs after insulin start). please note that the scale on the y-axis ranges from 0 to 0.4.
Figure 3.
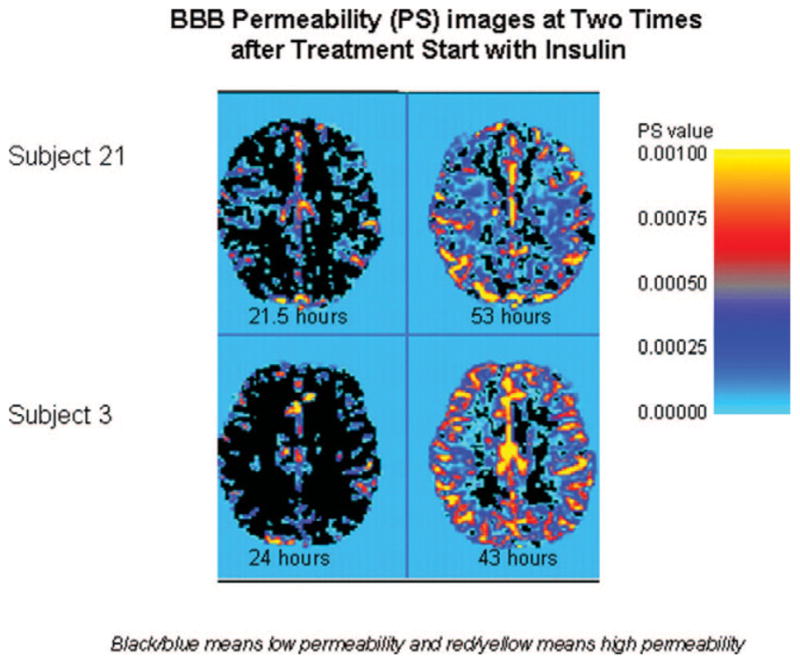
Increase in blood– brain barrier (BBB) permeability (PS) during diabetic ketoacidosis treatment in two randomly selected subjects. Times for each magnetic resonance imaging scan are given below with the figures.
MRI Findings of Two Patients With Persistent Neurologic Findings After Resolution of DKA
The study radiologist (DS) performed a detailed review of the MRI scans of subjects 16 and 25. Subject 16 had normal-appearing brain parenchyma and cerebrospinal fluid spaces on standard imaging sequences with the exception of an incidental mild Chiari 1 malformation. The second MRI showed a minimal increase in the lateral and third ventricular size compared with the MRI scan at time 1. Cerebrospinal fluid flow at the craniocervical junction on a follow-up study demonstrated flow anterior and posterior to the cord at the level of the foramen magnum, and there was no evidence of a syrinx in the cervical cord. Likewise, subject 25 had a normal initial brain MRI without brain parenchymal abnormality and had normal cerebrospinal fluid spaces. The second MRI at time 2 also showed a minimal increase in the third and lateral ventricular size compared with the first MRI at time 1.
Serum Interleukin-6 Levels in Four Subjects
Subjects 26, 28, 29, and 39 had serum interleukin-6 (IL-6) levels drawn near the time (range, 1– 6 hrs) of each MRI scanning, which we obtained as part of a pilot study to examine the relationship between inflammation and BBB permeability. IL-6 levels were <1 pg/mL in subject 28 at both time points, whereas three subjects (subjects 26, 29, and 39) had high IL-6 levels at both MRI scan times and higher IL-6 levels at MRI scan 2 than MRI scan 1. Clinical characteristics could not distinguish subject 28 from the other three subjects with regard to IL-6 levels. Two of the three subjects with higher IL-6 levels at MRI scan 2 also had higher permeability ratio (BBB permeability). These data are included in Table 3.
Table 3.
Relationship between interleukin-6 levels (pg/mL) and blood– brain barrier permeability (permeability ratio)
| Subjects | Interleukin-6 1 | Interleukin-6 2 | Percent Change |
|---|---|---|---|
| 26 | 8.1 | 22.0 | +248 |
| 28 | <1 | <1 | +774 |
| 29 | 9.5 | 40 | −43 |
| 39 | 33 | 51.7 | +172 |
DISCUSSION
The principal aim of this study was to describe the integrity of the BBB in DKA. The main findings are that of the 13 children with DKA: 1) ten (77%) subjects had increase in whole brain BBB permeability ratio at 36 to 72 hrs compared with 12 to 24 hrs; 2) the majority of subjects had regional increases in permeability ratio; 3) compared with the other brain regions examined, the greatest increase in BBB permeability ratio occurred in the frontal cortex; and 4) clinical features did not distinguish between the few subjects who had decreases from the majority of subjects who had increases in permeability ratio. Two of 13 patients received ICP monitoring for computed tomography-evident CE and reported residual neurologic changes at hospital discharge after correction of metabolic derangements in DKA.
What Causes Increased BBB Permeability in DKA?
The reasons for increases in BBB permeability appear to be multifactorial. Animal studies suggest that multiple factors such as hyperglycemia, matrix metalloproteinase activity, insulin administration, and/or inflammation play a role in the mechanism of increased BBB permeability. Diabetes induced by streptozotocin in animals is associated with increased permeability to sucrose and decreased production of tight junction proteins mediated by matrix metalloproteinase (19). In this study, acute normalization of glucose did not attenuate BBB permeability ratio, suggesting that hyperglycemia alone did not cause degradation of tight junction proteins. Although none of our patients received large bolus doses of insulin, all our patients received a continuous infusion of 0.1 μm/kg/hr for DKA and data show that insulin transport across the BBB is increased in diabetes unrelated to acute changes in serum glucose, insulin, altered vascular space, or catabolic events (20). Additionally, insulin, which when administered peripherally can cross the BBB and through increased sodium transport or increase in aquaporin levels can also cause CE (21–23). Because statin therapy has been shown to improve BBB permeability in diabetic rats, HMG CoA reductase has been implicated in the pathogenesis of DKA-related CE (24).
Inflammatory cytokines are also implicated in mediating BBB permeability and neuronal loss in ischemic brain damage (25, 26). The degree of inflammation and its effect on insulin sensitivity, however, may depend on genetic polymorphisms of the cytokine (i.e., IL-6 gene) (27, 28). Our data are similar to that of Hoffman et al (29) who described high pretreatment IL-6 compared with normal (5 pg/mL) and a further transient increase from pretreatment 6 to 8 hrs after treatment. In one patient, however, IL-6 peaked at 24 hrs and remained high at 120 hrs from admission (29). Previously published data also show increases in inflammation (IL-2) after 24 hrs of treatment of DKA (29). Therefore, it appears that DKA results in a heterogeneous systemic inflammatory response, which can persist or worsen during DKA treatment. Although results of this study do not explain the reason for increased BBB permeability, our data from three subjects suggest that persistent inflammation might be related increase in BBB permeability. These data are a starting point to examine the factors associated with changes in BBB permeability in pediatric DKA.
Is Increased BBB Permeability Associated with CE in DKA?
To understand the impact of altered BBB permeability as a potential contributor to the pathophysiology of CE in DKA, consideration of time course of change in BBB permeability is of importance. Clinical CE is typically diagnosed 2 to 10 hrs after the start of DKA therapy, but there are reports of children with CE before receiving either hydration or insulin treatment (1– 6). Although we did not examine apparent diffusion coefficient, in a previous and similar study, Glaser and colleagues compared apparent diffusion coefficient and mean transit times between DKA and recovery from DKA in 14 children (8). Although cerebral ischemia before DKA treatment start could not be excluded, the elevated apparent diffusion coefficient values early (2–10 hrs in Glaser’s [8] study) in the course of DKA treatment suggest a vasogenic etiology of CE during the early treatment phase of DKA. Vasogenic CE may result from either increased cerebral blood flow or increased BBB permeability or both. Cerebral blood flow in DKA has been examined both by MRI and estimated by transcranial Doppler ultrasonography. Both methods suggest normal to elevated cerebral blood flow early in the course of DKA. In this study, one of the two subjects with clinical CE had both high BBB permeability ratio and increased ICP between 12 and 24 hrs after time 0. Given the small number of subjects with ICP monitoring and the different time points of MRI scans in these children compared with the remainder, the variability in BBB permeability ratio in these patients is not surprising, making it difficult to draw conclusions regarding the relationship between their clinical course and BBB permeability.
Regional Differences in BBB Permeability in DKA
The observed regional differences in BBB permeability ratio during DKA treatment suggest more BBB dysfunction in some areas (frontal cortex) of the brain compared with others. Similar to traumatic brain injury and acute hypertension, heterogeneity in cerebral vascular characteristics has been observed in both experimental and human diabetes (8, 30, 31). For example, the occipital cortex has been shown to have lower apparent diffusion coefficient values early during DKA compared with other brain regions (8). Additionally, serum serotonin, which enters the brain parenchyma through serotonin-2 receptors, induces short-term breakdown of the BBB in the frontal and parietal cortices (31). Although Huber et al (32) reported that hyperglycemia produced and insulin attenuated a progressive increase in BBB permeability, the effect of diabetes on microvascular damage was most pronounced in the midbrain region. What remains unclear is the reason for the selective BBB vulnerability in DKA, the relationship between regional CE and persistent neurologic deficits, and the relationship between acute and chronic regional BBB permeability changes and long-term outcome in DKA.
Persistent Neurologic Deficits in DKA
In this report, we document in-hospital neurologic sequelae from DKA. Limb weakness and decreased mental status after start of treatment of DKA were observed in two subjects with early clinical CE without evidence of thrombosis or infarction on MRI. These findings suggest that neurologic sequelae may persist well after correction of metabolic derangements in DKA and may be related to increase in BBB permeability.
What Are the Limitations of This Study?
This study has some limitations worth discussing. First, the sample size is small, the age range is wide, and the true prevalence of high BBB permeability during DKA treatment may be overestimated or underestimated. However, it is important to recognize that the task of obtaining MRI data in the acute care setting where consent from both parents is required and from critically ill children without sedation is challenging. Furthermore, some children, especially young ones, are not able to complete the MRI scanning process during recovery from DKA because somnolence is replaced by agitation and developmentally appropriate behaviors that include separation anxiety and fear and lack of cooperation with MRI. Second, we only have MRI data from two time points. Therefore, it is possible that interim changes in permeability were missed or that earlier changes were not captured. However, obtaining more than two MRI scans in this population poses certain logistic challenges, especially because we aimed to have a 12-hr interval between serial MRI scans and obtaining two parent consents before the 12-hr point was challenging. At our institution, most children with an established diagnosis of type I diabetes admitted in DKA have a 2- to 3-day length of stay, sometimes precluding more frequent imaging. Third, we did not obtain data on permeability from time points earlier than 12 hrs after insulin start and may have missed very early and pretreatment changes in permeability. Fourth, our time estimates may not be completely accurate given that some patients were transferred from outside facilities. However, we abstracted documented times from transfer records, suggesting that our estimates may approximate treatment time. Finally, these data are observational and at this juncture, we cannot explain the genesis or permeability during insulin treatment nor can we comment on tits role in the development of cerebral edema in pediatric DKA. Nevertheless, the fact that permeability changes occurred during insulin despite these limitations, our data are new and for the first time describe changes in BBB permeability in children with DKA, thereby providing preliminary data for further examination of cerebrovascular and cerebral hemodynamic changes in pediatric DKA.
In summary, this is the first human study to characterize whole brain and regional BBB permeability during DKA treatment and to document persistent neurologic deficits at hospital discharge in the absence of venous thrombosis or hemorrhagic infarction. We found that whole brain and regional permeability typically increased between 12 to 24 hrs and 36 to 72 hrs after insulin start. The greatest increase in BBB permeability ratio occurred in the frontal cortex, suggesting that BBB changes in DKA are not uniform. Further characterization of changes in BBB permeability is needed to better understand the clinical significance in the development of DKA-related CE.
Acknowledgments
Supported, in part, by NIHR21-HD044632 (MSV).
Footnotes
See also p. 421.
For information regarding this article, Vavilala@u.washington.edu
The authors have not disclosed any potential conflicts of interest.
References
- 1.Rewers A, Klingensmith G, Davis C, et al. Presence of diabetic ketoacidosis at diagnosis of diabetes mellitus in youth: the Search for Diabetes in Youth Study. Pediatrics. 2008;121:e1258–e1266. doi: 10.1542/peds.2007-1105. [DOI] [PubMed] [Google Scholar]
- 2.Rewers A, Chase HP, Mackenzie T, et al. Predictors of acute complications in children with type 1 diabetes. JAMA. 2002;287:2511–2518. doi: 10.1001/jama.287.19.2511. [DOI] [PubMed] [Google Scholar]
- 3.Hanas R, Lindblad B, Lindgren F. Diabetic ketoacidosis and cerebral edema in Sweden, a 2-year population study. Abstr Diabetes. 2004;53(Suppl 2):A421. doi: 10.1111/j.1464-5491.2007.02200.x. [DOI] [PubMed] [Google Scholar]
- 4.Roche EF, Menon A, Gill D, et al. Clinical presentation of type 1 diabetes. Pediatr Diabetes. 2005;6:75–78. doi: 10.1111/j.1399-543X.2005.00110.x. [DOI] [PubMed] [Google Scholar]
- 5.Edge JA. Cerebral oedema during treatment of diabetic ketoacidosis: Are we any nearer finding a cause? Diabetes Metab Res Rev. 2000;16:316–324. doi: 10.1002/1520-7560(2000)9999:9999<::aid-dmrr143>3.0.co;2-r. [DOI] [PubMed] [Google Scholar]
- 6.Glaser NS, Barnett P, McCaslin I, et al. Risk factors for cerebral edema in children with diabetic ketoacidosis. N Engl J Med. 2001;344:264–269. doi: 10.1056/NEJM200101253440404. [DOI] [PubMed] [Google Scholar]
- 7.Roberts JS, Vavilala MS, Schenkman KA, et al. Cerebral hyperemia and impaired cerebral autoregulation associated with diabetic ketoacidosis in critically ill children. Crit Care Med. 2006;34:2258–2259. doi: 10.1097/01.CCM.0000227182.51591.21. [DOI] [PubMed] [Google Scholar]
- 8.Glaser NS, Wootton-Gorges SL, Marcin JP, et al. Mechanism of cerebral edema in children with diabetic ketoacidosis. J Pediatr. 2004;145:164–171. doi: 10.1016/j.jpeds.2004.03.045. [DOI] [PubMed] [Google Scholar]
- 9.Dietrich WD. Inflammatory factors regulating the blood–brain barrier. In: Feuerstein GZ, editor. Inflammatory cells and mediators in CNS disease. Amsterdam: Harwood Academic; 1999. pp. 137–155. [Google Scholar]
- 10.Jenkinson M, Bannister P, Brady M, et al. Improved optimization for the robust and accurate linear registration and motion correction of brain images. Neruoimage. 2002;17:825–841. doi: 10.1016/s1053-8119(02)91132-8. [DOI] [PubMed] [Google Scholar]
- 11.Smith S. Fast Robust Automated Brain Extraction. Human Brain Mapping. 2002;17:143–155. doi: 10.1002/hbm.10062. [DOI] [PMC free article] [PubMed] [Google Scholar]
- 12.Demsar F, Roberts TP, Schwickert HC, et al. A MRI spatial mapping technique for microvascular permeability and tissue blood volume based on macromolecular contrast agent distribution. Magn Reson Med. 1997;37:236–242. doi: 10.1002/mrm.1910370216. [DOI] [PubMed] [Google Scholar]
- 13.Ivanusa T, Katarina B, Medic J, et al. Dynamic contrast enhanced MRI of mouse fibrosarcoma using small-molecular and novel macromolecular contrast agents. Physica Medica. 2007;23:85–90. doi: 10.1016/j.ejmp.2007.05.001. [DOI] [PubMed] [Google Scholar]
- 14.Larsson HB, Tofts PS. Measurement of blood–brain barrier permeability using dynamic Gd-DTPA scanning—A comparison of methods. Magn Reson Med. 1992;24:174–176. doi: 10.1002/mrm.1910240119. [DOI] [PubMed] [Google Scholar]
- 15.Aviv RI, d’Esterre CD, Murphy BD, et al. Hemorrhagic transformation of ischemic stroke: Prediction with CT perfusion. Radiology. 2009;250:867–877. doi: 10.1148/radiol.2503080257. [DOI] [PubMed] [Google Scholar]
- 16.Qiao ZW, Xia CM, Zhu YB, et al. First-pass perfusion computed tomography: Initial experience in differentiating adrenal adenoma from metastasis. Eur J Radiol. 2009 Feb 4; doi: 10.1016/j.ejrad.2009.01.007. [Epub ahead of print] [DOI] [PubMed] [Google Scholar]
- 17.Zaharchuk G. Theoretical basis of hemodynamic MR imaging techniques to measure cerebral blood volume, cerebral blood flow, and permeability. AJNR Am J Neuroradiol. 2007;28:1850–1858. doi: 10.3174/ajnr.A0831. [DOI] [PMC free article] [PubMed] [Google Scholar]
- 18.Law M, Yang S, Babb JS, et al. Comparison of cerebral blood volume and vascular permeability from dynamic susceptibility contrast-enhanced perfusion MR imaging with glioma grade. AJNR Am J Neuroradiol. 2004;25:746–755. [PMC free article] [PubMed] [Google Scholar]
- 19.Hawkins BT, Lundeen TF, Norwood KM, et al. Increased blood–brain barrier permeability and altered tight junctions in experimental diabetes in the rat: Contribution of hyperglycaemia and matrix metalloproteinases. Diabetologia. 2007;50:202–211. doi: 10.1007/s00125-006-0485-z. [DOI] [PubMed] [Google Scholar]
- 20.Banks WA, Jaspan JB, Kastin AJ. Effect of diabetes mellitus on the permeability of the blood-brain barrier to insulin. Peptides. 1997;18:1577–1584. doi: 10.1016/s0196-9781(97)00238-6. [DOI] [PubMed] [Google Scholar]
- 21.Badaut J, Brunet JF, Regli L. Aquaporins in the brain: From aqueduct to ‘multi-duct. ’ Metab Brain Dis. 2007;22:251–263. doi: 10.1007/s11011-007-9057-2. [DOI] [PubMed] [Google Scholar]
- 22.Badaut J, Lasbennes F, Magistretti PJ, et al. Aquaporins in brain: Distribution, physiology, and pathophysiology. J Cereb Blood Flow Metab. 2002;22:367–378. doi: 10.1097/00004647-200204000-00001. [DOI] [PubMed] [Google Scholar]
- 23.Arieff AI, Dorener T, Zelig H, et al. Mechanisms of seizures and coma in hypoglycemia. Evidence for direct effect of insulin on electrolyte transport in brain. J Clin Invest. 1974;54:654–663. doi: 10.1172/JCI107803. [DOI] [PMC free article] [PubMed] [Google Scholar]
- 24.Mooradian AD, Haas MJ, Batejko O, et al. Statins ameliorate endothelial barrier permeability changes in the cerebral tissue of streptozotocin-induced diabetic rats. Diabetes. 2005;54:2977–2982. doi: 10.2337/diabetes.54.10.2977. [DOI] [PubMed] [Google Scholar]
- 25.Stroemer RP, Rothwell NJ. Exacerbation of ischemic brain damage by localized striatal injection of interleukin-1beta in the rat. J Cereb Blood Flow Metab. 1998;18:833–839. doi: 10.1097/00004647-199808000-00003. [DOI] [PubMed] [Google Scholar]
- 26.Blamire AM, Anthony DC, Rajagopalan B, et al. Interleukin-1beta-induced changes in blood–brain barrier permeability, apparent diffusion coefficient, and cerebral blood volume in the rat brain: A magnetic resonance study. J Neurosci. 2000;20:8153–8159. doi: 10.1523/JNEUROSCI.20-21-08153.2000. [DOI] [PMC free article] [PubMed] [Google Scholar]
- 27.Kubaszek A, Pihlajamäki J, Punnonen K, et al. The C-174G promoter polymorphism of the IL-6 gene affects energy expenditure and insulin sensitivity. Diabetes. 2003;52:558–561. doi: 10.2337/diabetes.52.2.558. [DOI] [PubMed] [Google Scholar]
- 28.Cooper JD, Smyth DJ, Bailey R, et al. The candidate genes TAF5L, TCF7, PDCD1, IL6 and ICAM1 cannot be excluded from having effects in type 1 diabetes. BMC Med Genet. 2007;8:71. doi: 10.1186/1471-2350-8-71. [DOI] [PMC free article] [PubMed] [Google Scholar]
- 29.Hoffman WH, Burek CL, Waller JL, et al. Cytokine response to diabetic ketoacidosis and its treatment. Clin Immunol. 2003;108:175–181. doi: 10.1016/s1521-6616(03)00144-x. [DOI] [PubMed] [Google Scholar]
- 30.Lin JJ, Lin KL, Wang HS, et al. Occult infarct with acute hemorrhagic stroke in juvenile diabetic ketoacidosis. Brain Dev. 2008;30:91–93. doi: 10.1016/j.braindev.2007.06.001. [DOI] [PubMed] [Google Scholar]
- 31.Winkler T, Sharma HS, Stalberg E, et al. Impairment of blood–brain barrier function by serotonin induces desynchronization of spontaneous cerebral cortical activity: Experimental observations in the anaesthetized rat. Neuroscience. 1995;68:1097–1104. doi: 10.1016/0306-4522(95)00194-n. [DOI] [PubMed] [Google Scholar]
- 32.Huber JD, VanGilder RL, Houser KA. Streptozotocin-induced diabetes progressively increases blood–brain barrier permeability in specific brain regions in rats. Am J Physiol Heart Circ Physiol. 2006;291:H2660–H2668. doi: 10.1152/ajpheart.00489.2006. [DOI] [PubMed] [Google Scholar]