

Abstract
Although HMGA1 (high-mobility group A1; formerly HMG-I/Y) is an oncogene that is widely overexpressed in aggressive cancers, the molecular mechanisms underlying transformation by HMGA1 are only beginning to emerge. HMGA1 encodes the HMGA1a and HMGA1b protein isoforms, which function in regulating gene expression. To determine how HMGA1 leads to neoplastic transformation, we looked for genes regulated by HMGA1 using gene expression profile analysis. Here, we show that the STAT3 gene, which encodes the signaling molecule signal transducer and activator of transcription 3 (STAT3), is a critical downstream target of HMGA1a. STAT3 mRNA and protein are up-regulated in fibroblasts overexpressing HMGA1a and activated STAT3 recapitulates the transforming activity of HMGA1a in fibroblasts. HMGA1a also binds directly to a conserved region of the STAT3 promoter in vivo in human leukemia cells by chromatin immunoprecipitation and activates transcription of the STAT3 promoter in transfection experiments. To determine if this pathway contributes to HMGA1-mediated transformation, we investigated STAT3 expression in our HMGA1a transgenic mice, all of which developed aggressive lymphoid malignancy. STAT3 expression was increased in the leukemia cells from our transgenics but not in control cells. Blocking STAT3 function induced apoptosis in the transgenic leukemia cells but not in controls. In primary human leukemia samples, there was a positive correlation between HMGA1a and STAT3 mRNA. Moreover, blocking STAT3 function in human leukemia or lymphoma cells led to decreased cellular motility and foci formation. Our results show that the HMGA1a–STAT3 axis is a potential Achilles heel that could be exploited therapeutically in hematopoietic and other malignancies overexpressing HMGA1a.
Introduction
Because the HMGA1 (formerly HMG-I/Y) gene is widely overex-pressed in human cancer and overexpression portends a poor prognosis in some tumors, understanding the mechanisms that lead to transformation by HMGA1 should lead to the identification of therapeutic targets for these malignancies. The HMGA1 gene encodes the HMGA1a and HMGA1b protein isoforms, which were originally identified as abundant chromatin binding proteins (reviewed in refs. 1, 2). HMGA1a and HMGA1b also have oncogenic properties in cultured cells derived from different embryologic tissues (1–6), and inhibiting HMGA1 expression in human cancer cell lines blocks the transformed phenotype (3, 5, 7). Transgenic mice overexpressing HMGA1a develop aggressive lymphoid malignancy (8, 9), uterine cancer (10), and pituitary tumors (9). These findings show that HMGA1a functions as an oncogene in vivo and suggest that it directly contributes to oncogenic transformation in human cancer.
Because these proteins function in transcription, it has been postulated that they promote malignant transformation by altering expression of specific target genes. IFN-β gene is the best-characterized gene target (reviewed in ref. 11), and previous studies show that HMGA1 is essential for its efficient transcription. Other candidate targets include genes that function in cell signaling, motility, and inflammation (1, 2, 5, 6, 10–13). How these genes contribute to the role of HMGA1 in malignancy is not yet clear.
To define the molecular pathways induced by HMGA1 in transformation, we looked for genes regulated by HMGA1 using gene expression profile analysis. We focused on the signal transducer and activator of transcription-3 (STAT3) gene because of its prominent role in human malignancy (14–17). Our studies suggest that the HMGA1a–STAT3 axis is a rational therapeutic target for hematopoietic malignancies and potentially other cancers with activation of this pathway.
Materials and Methods
Microarray analysis
Microarray analysis was done with the Clontech Atlas cDNA Rat 1.2 Array (Clontech PT3564-3) according to the manufacturer’s instructions. Briefly, mRNA (1 μg) from each polyclonal cell line (Rat1a-HMGA1a, Rat1a-HMGA1b, Rat1a-pSG5 control; ref. 3) was labeled in a reverse transcriptase reaction in the presence of 35 μCi of [α-32P]dATP. The hybridization signals were scanned with a Phosphor-Imager (Molecular Dynamics) and analyzed according to the Clontech instruction manual. The intensity of signal for reference genes was adjusted so that the mean intensities for each membrane were equal as recommended in the instructions. All signals were compared with the control housekeeping genes, β-actin and myosin, according to the manufacturer’s recommendations.
Quantitative reverse transcription-PCR analysis
Reverse transcription-PCR (RT-PCR) was done with SYBR Green PCR Master kit and TaqMan One-Step RT-PCR kit (Applied Biosystems) as described (10). The sequences for the forward and reverse primers that amplify STAT3α are 5′-CTGAC-CCAGGTAGCGCTGCCCCATACC and 5′-TCACAATGGGGGAGGTAGCG-CACTCCG, respectively. Reaction conditions were as reported (8, 10).
Western blot analysis
Western blots were done with an anti-HMGA1a antibody (3) diluted 1:200, an anti-STAT3 antibody diluted 1:200 (New England Biolabs), an anti-pSTAT antibody (New England Biolabs) diluted 1:100, and an anti–topoisomerase I antibody (BD Biosciences) diluted 1:1,000.
Immunohistochemistry
The commercially available antibodies for STAT3 were used according to the manufacturer’s instructions (New England Biolabs). Briefly, slides from paraffin-embedded tissues were made as described (10). Slides were heated in antigen retrieval solution (DAKO) and immunohistochemically stained for STAT3 following the manufacturer’s directions (New England Biolabs, #9132).
Nuclear extract preparation
Nuclear extracts were prepared as previously described (17).
Chromatin immunoprecipitation experiments
Chromatin immunoprecipitations were done with HEL-HMGA1a or Ramos cells as described (10). Briefly, proteins cross-linked to chromatin were immunoprecipitated with the following antibodies (10): HMGA1, polymerase II, histone H3 (both polymerase II and histone H3 served as positive controls), and IgG (as a negative control). The STAT3 promoter region with the consensus HMGA1a DNA binding site was amplified by quantitative RT-PCR from the immunoprecipitated protein-DNA complexes using the forward and reverse primers 5′-GCCAATGGGCTAGCTGGT-3′ and 5′-CTTCAGTTTCTGCGT-GAGCA-3′, respectively. The control primers for histone H3 and polymerase II have been previously described (10). The HPRT1 promoter was amplified as a negative control promoter with no HMGA1a binding sites as described (12).
Electrophoretic mobility shift assay
Electrophoretic mobility shift assays were done as previously described (12, 17). To determine if HMGA1a binds to the STAT3 promoter at the putative HMGA1a binding site, a probe containing this site was generated by annealing equimolar amounts of two 37-nucleotide complementary oligonucleotides from the STAT3 promoter, CACTCTAGTAATTACTCTATTTCCACGTCATGTTTCC and GGAAA-CATGACGTGGAAATAGAGTAATTACTAGAGTG, and designated STAT3 wild-type. The probe containing the mutated site has the sequence CACTCTAGTAAggACTCTAggTCCACGTCATGTTTCC and GGAAACAT-GACGTGGAccTAGAGTccTTACTAGAGTG; the mutations are shown in lowercase letters. The control probe for the Kit ligand promoter has been described (12). The double-stranded probe was end-labeled with [γ-32P]ATP and purified. Binding reactions were done as described (12).
Preparation of splenocytes
Spleens were placed in PBS supplemented with 5% fetal bovine serum (FBS) on ice and mechanically fragmented with the Stomacher 80 (Seward). Single-cell suspensions were isolated after passage through a cell strainer (70-μm pores), treated with red cell lysis buffer, and resuspended in RPMI 1640.
Plasmids, transfections, and lentiviral infections
The pSG5-STAT3-C vector was made by excision of constitutively activated STAT3 (STAT3-C) from STAT3 pcDNA3.1 vector (14) with Pme1 and BamH1. The STAT3-C fragment was cloned into pSG5 after restriction with EcoR1 and Klenow treatment. The PA-HMGA1a vector was made by excision of the full-length murine HMGA1a cDNA from the vector pHEBoNeo-HMG-I3 with HindIII, Klenow treatment, and subsequent NotI digestion. The HMGA1a fragment was subsequently cloned into the EF1α expression vector (18) after restriction with BamHI and Klenow treatment. The STAT promoter vectors were described (kindly provided by K. Kohno, Department of Molecular Biology, School of Medicine, University of Occupational and Environmental Health, Kitakyushu, Fukuoka, Japan; ref. 19).
Transfections were done using Lipofectamine 2000 (Invitrogen) according to the manufacturer’s instructions as we previously described (10). In the experiments with HEL control or HEL-HMGA1 cells, the STAT3 promoter reporter plasmid (1 μg) was cotransfected with the control pRL-TK vector (100 ng) containing Renilla luciferase (Promega) to control for transfection efficiency (3 × 10⁵ cells/500 μL per transfection). The DNA was mixed with Lipofectamine 2000 at a ratio of 1 μg:1.5 μL (in Opti-MEM, Invitrogen) and incubated with cells for 6 h. Cells were harvested for luciferase activity 24 h after transfection and experiments were done twice in triplicate. In the titration experiment, reporter plasmid (100 ng), control Renilla luciferase plasmid (50 ng), and 0 to 150 ng of HMGA1a expression plasmid (pSG5-HMG-I) were cotransfected as described above. The pSG5 plasmid was added (0–150 ng) to keep the total DNA constant in the titration experiments (1 × 10⁵ cells/100 μL per transfection). The DNA was mixed with Lipofectamine 2000 at a ratio of 1 μg:1.67 μL (in Opti-MEM, Invitrogen) and cells were harvested as described above.
The lentiviral construct expressing dominant-negative STAT3 (Lenti-DN-STAT3) was made from the pcDNA3.1-STAT3DN (provided by J-I. Park, the Johns Hopkins University School of Medicine, Baltimore, MD; ref. 14). The cytomegalovirus promoter was replaced by the human EF1α promoter from pEF1/Myc-His-A (Invitrogen) and the EF-DN-STAT3 cassette was cloned into the cFUGW lentivirus (provided by D. Baltimore, Division of Biology, California Institute of Technology, Pasadena, CA) at the PacI site and lentiviral supernatants were made as described (20).
Cell lines and cultures
The polyclonal Rat1a-HMGA1a (HMG-I) and control cells were described (3, 4). The Rat1a-activated STAT3 cells were made by transfecting with pSG5-STAT3-C as described (3, 4). Polyclonal stable cell lines were selected in puromycin and expression of activated STAT3 was confirmed by Western blot analysis.
The parental HEL cells are human erythroleukemia cells from the American Type Culture Collection (ATCC). HEL-HMGA1a cells were made by transfection of PA-HMGA1a with DMRIE-C (Invitrogen) according to the manufacturer’s instructions. Stable clones were selected in G418 (800 μg/mL). The Burkitt’s cells (Ramos RA 1) were derived from a 3-y-old male Caucasian patient with Burkitt’s lymphoid malignancy and grown as suggested (ATCC).
Growth curves
Cellular growth rates were determined as previously described (21) using the CellTiter Cell Proliferation Assay (Promega). Briefly, cell proliferation was evaluated at 24-h intervals by measuring the mitochondrial-dependent conversion of the tetrazolium salt, 3-(4,5-dimethyl-thiazol-2yl)-5-(3-carboxymethoxyphenyl)-2-(4-sulfophenyl)-2H-tetrazolium, to a colored formazan product using a CellTiter 96 AQueous Non-Radioactive Cell Proliferation Assay (Promega) according to the manufacturer instructions. Cells were seeded in 96-well plates at a density of 1,000 per well and grown for 1 wk. A volume of 20 μL of CellTiter 96 AQueous One Solution Reagent was pipetted directly into each well of the 96-well assay plate containing cells in 100 μL of culture medium, and cells were incubated for 2 h at 37°C in a humidified 5% CO2 atmosphere. Absorbance was read at 490 nm using a 96-well microplate reader (model 680, Bio-Rad).
Migration and soft agar transformation assays
Migration assays were done in 24-well plates containing 0.8-μm-pore cell culture inserts with polyethylene terephthalate membranes according to the manufacturer’s instructions (BioCoat Cell Culture Inserts, BD Biosciences) as described (22). Briefly, filters were coated on ice with 100 μL of growth factor–reduced Matrigel at 0.5 to 0.8 mg/mL protein. The cells were seeded in 500 μL of 10% FBS-RPMI at 30,000 per well into the upper chamber. The lower chamber was filled with 750 μL of the same medium. After 48 h, migration was assessed by counting cells on the underside after fixation with 70% ethanol and staining with hematoxylin. Soft agar assays were done as described with minor modifications (3). Cells (103–104) were mixed with 0.4% agar in growth media and added as a top layer over 0.8% agar. Growth medium (1 mL) was added after 1 h at room temperature. Colonies were counted after 4 wk.
Results
STAT3 is up-regulated in cells overexpressing HMGA1a
To identify HMGA1 target genes, we performed gene expression profile analysis comparing RNA from Rat1a fibroblasts over-expressing HMGA1a or HMGA1b to control Rat1a cells transfected with vector alone. From a microarray (Clontech Atlas Rat 1.2 Array) with unique cDNA fragments representing 1,176 genes, we identified genes that were differentially expressed by at least 2-fold compared with control cells after normalization to both β-actin and myosin (Supplementary Fig. S1; Supplementary Tables S1 and S2). Ninety-seven genes from the total of 1,176 genes (8.2%) were differentially regulated in cells overexpressing HMGA1a, and 103 genes (8.8%) were differentially regulated in cells overexpressing HMGA1b (Supplementary Fig. S1; Supplementary Tables S1 and S2). Fifty-five of these genes were common to both the HMGA1a and HMGA1b cells (Supplementary Fig. S1; Supplementary Tables S1 and S2). The following classes of genes involved in cell growth and transformation were highly represented in this study: (a) general metabolism (HMGA1a: 16 genes, HMGA1b: 23 genes, both: 11 genes); (b) ribosomal proteins (HMGA1a: 10, HMGA1b: 11, both: 8); (c) growth factors, cytokines, and chemokines (HMGA1a: 10, HMGA1b: 6, both: 4); and (d) oncogenes and proto-oncogenes (HMGA1a: 8, HMGA1b: 4, both: 4). Only two genes were down-regulated by at least 2-fold in this study (CD3 γ subunit and γ-aminobutyric acid receptor, subunit ρ1) and both were down-regulated by HMGA1a and HMGA1b.
From the group of 53 genes up-regulated in cells overexpressing HMGA1a and HMGA1b, the gene encoding STAT3 was studied further because of its prominent role in diverse human malignancies (14–17). Microarray analysis showed that STAT3 mRNA was increased 2.5- to 3.1-fold in cells overexpressing HMGA1a and 2.9-to 3.0-fold in fibroblasts overexpressing HMGA1b (Supplementary Table S2). This increase was confirmed by RT-PCR from the fibroblasts overexpressing HMGA1a (Fig. 1A-i). STAT3 protein was also increased in the cells overexpressing HMGA1a (Fig. 1A-ii).
Figure 1.

HMGA1a directly up-regulates STAT3 expression. A-i, RT-PCR shows that Rat 1a fibroblasts overexpressing HMGA1a have increased STAT3 mRNA compared with control Rat1a cells. A-ii, Western blot analysis shows increased STAT3 protein in the Rat1a-HMGA1a cells. A-iii, splenocytes from the HMGA1a transgenic mice also have increased STAT3 protein compared with splenocytes from control mice by immunohistochemical staining. Bar, 20 μm. A-iv, Western blot shows that splenocytes from the HMGA1a transgenics have increased phosphorylated STAT3 (pSTAT3) protein compared with control splenocytes. B-i, HMGA1a binds directly to the STAT3 promoter region containing a conserved HMGA1a DNA binding site in HEL-HMGA1a cells. Chromatin immunoprecipitation experiments with sheared chromatin from HEL-HMGA1a cells after cross-linking proteins bound to DNA with formaldehyde (10). The bar graph shows the percent of total input DNA as assessed by quantitative RT-PCR after immunoprecipitation with HMGA1a (12) and positive control histone H3 or polymerase II (Pol II) antibodies (all from Upstate, excluding the HMGA1a antibody). The HPRT promoter sequence with the HMGA1a antibody was used as a negative control because there are no HMGA1 DNA binding sites in the region amplified and previous chromatin immunoprecipitation experiments showed no binding by HMGA1 to the amplified region (12). Additional negative controls included no chromatin and no DNA. The total input is considered to be 100% (not shown in the bar graph). Chromatin immunoprecipitation and quantitative RT-PCR experiments were done at least twice. Columns, mean from the repeat experiments; bars, SD. B-ii, HMGA1a also binds directly to the STAT3 promoter in Burkitt’s lymphoma cells. Chromatin immunoprecipitation experiments were done as described above in the HEL-HMGA1a cells. The graph shows the percent of total input DNA immunoprecipitated with the same antibodies from repeat quantitative RT-PCR experiments as described above. C-i, recombinant HMGA1a binds directly to the predicted consensus HMGA1a site in the STAT3 promoter by electrophoretic gel shift analysis. There was no binding to the mutated site. Experiments were done with the following protein/DNA molar ratios, as indicated in the figure: 0, 0.1, 0.2, 0.3, and 0.4. For the wild-type probe, 500 nmol/L DNA was used with 0, 50, 100, 150, or 200 nmol/L protein to give the indicated protein/DNA molar ratios. For the mutated probe, 125 nmol/L DNA was used with 0, 12.5, 25, 37.5, or 50 nmol/L protein to give the indicated protein/DNA molar ratios. C-ii, in transfection experiments, HMGA1a activates the STAT3 promoter containing the HMGA1 binding site (labeled STAT3 Promoter; 1 in ref. 19) but not the control reporter vector without the STAT3 promoter containing the HMGA1a binding site (labeled Control Reporter Construct; B2 in ref. 19). Black columns, luciferase reporter activity in HEL control cells; hatched columns, luciferase reporter activity in HEL-HMGA1a cells. Experiments were done in triplicate at least twice. There was >2-fold activation (P = 0.0000298, Student’s t test.) C-iii, increasing HMGA1a plasmid results in increasing activation of the STAT3 promoter in a dose-dependent fashion (hatched columns). The luciferase activity with control plasmid (0 ng input HMGA1a) was arbitrarily assigned a value of 1. There was no activation of the control plasmid lacking the HMGA1 binding site (solid columns). Experiments were done in triplicate at least twice. Activation at 150 ng of input HMGA1a plasmid was significant (P = 0.028, Student’s t test).
STAT3 is up-regulated in lymphoid tumors from HMGA1a transgenic mice
To determine if this pathway is dysregulated in malignancies induced by HMGA1a, we first evaluated STAT3 expression in lymphoid tumors from our HMGA1a transgenic mice (8). These mice overexpress HMGA1a in lymphoid tissue and develop aggressive leukemia or lymphoma with complete penetrance (8). STAT3 protein is also increased in the lymphoid tumors from the transgenics compared with lymphoid cells from control mice by immunohistochemical analysis (Fig. 1A-iii). Because STAT3 proteins require activation by phosphorylation at Tyr705 for oncogenic function (14–17), we also assessed activated STAT3 protein levels by Western blot analysis and found that they are increased in the transgenic spleens compared with controls (Fig. 1A-iv). These studies indicate that HMGA1a up-regulates STAT3 proteins in vivo in the transgenic tumors.
HMGA1a binds to the STAT3 promoter and directly up-regulates STAT3 expression in malignant human hematopoietic cells
Next, we sought to determine if HMGA1 directly activates expression of the STAT3 promoter. Of note, the human, mouse, and rat STAT3 promoters contain a conserved consensus DNA binding site for HMGA1 (ATTACTCTATTTCCAC) about 650 bp upstream from the transcription start site (19). By chromatin immunoprecipitation, HMGA1 binds directly to the STAT3 promoter sequence containing the consensus binding site in human erythroleukemia cells transfected to overexpress HMGA1a (HEL-HMGA1a cells; Fig. 1B-i). To expand our findings to other human hematopoietic malignancies, we also investigated Burkitt’s leukemia/lymphoma cells (Ramos RA 1). In previous studies, we showed that these Burkitt’s cells express high levels of the HMGA1 protein and are dependent on HMGA1 for their transformed phenotype in soft agar (3). Here, we show that HMGA1 also binds to the STAT3 promoter in vivo in Burkitt’s cells (Fig. 1B-ii).
To determine if HMGA1 is binding to the consensus DNA binding site in the STAT3 promoter, we performed electrophoretic mobility shift assays with an oligonucleotide containing this site. We found that HMGA1a protein binds to this site in the STAT3 promoter in vitro, but not to an oligonucleotide containing a mutation in the site that abrogates STAT3 DNA binding (Fig. 1C-i).
To determine if HMGA1 activates STAT3 expression, we performed transfection experiments. We found that HMGA1 activates STAT3 promoter expression by >2-fold (Fig. 1C-ii) in HEL-HMGA1a cells compared with HEL control cells. There was no activation of the control promoter construct lacking the HMGA1 binding site. We also showed that cotransfection of a plasmid expressing HMGA1a led to transactivation of the STAT3 promoter in a dose-dependent fashion in HEL cells (Fig. 1C-iii). Specifically, there was increasing trans-activation of the STAT3 promoter with increasing quantity of HMGA1a input plasmid (Fig. 1C-iii). There was no activation of the control promoter construct lacking the HMGA1a binding site. Taken together, these results indicate that HMGA1 binds directly to the STAT3 promoter to activate its transcription.
Activated STAT3 transforms like HMGA1a in rat fibroblasts
Because STAT3 has oncogenic properties and is constitutively activated in diverse human malignancies (14–17), we hypothesized that it plays a role in HMGA1a-mediated transformation. To compare its transforming activity to that of HMGA1a, we generated Rat1a cells overexpressing a constitutively activated STAT3 protein (STAT3-C) and found that STAT3-C induces foci formation like HMGA1a (Fig. 2A-i and A-ii). Fibroblasts that overexpress HMGA1a or activated STAT3 exhibit anchorage-independent cell growth in soft agar with similar colony numbers and size (Fig. 2A-i and A-ii). These results indicate that activated STAT3 is sufficient for transformation in the rat fibroblasts.
Figure 2.
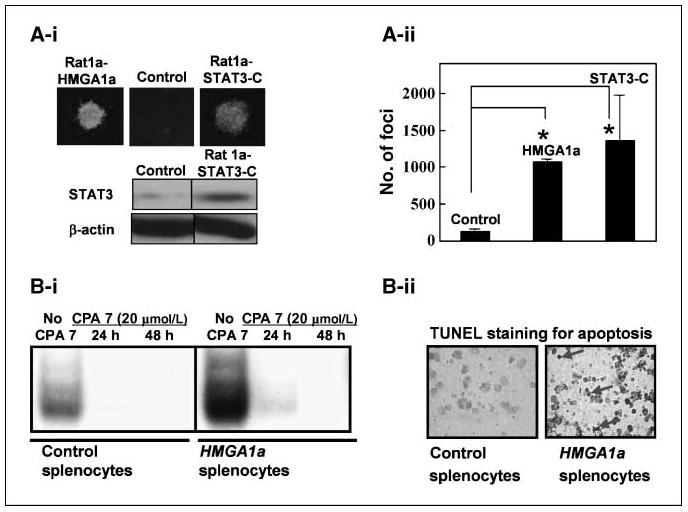
Activated STAT3 transforms like HMGA1a in fibroblasts and blocking STAT3 function induces apoptosis in leukemic cells from HMGA1a transgenic mice. A-i, fibroblasts overexpressing STAT3-C exhibit anchorage-independent cell growth in soft agar. Top, foci from cells overexpressing STAT3-C are similar in number and morphology to cells overexpressing HMGA1a. Bottom, Western blot analysis from the Rat fibroblasts overexpressing vector alone (control) or STAT3-C (Rat 1a STAT3C). The Rat 1a HMGA1a cells have been described and published (3). A-ii, foci number from two experiments done in duplicate. Rat1a cells overexpressing HMGA1a or STAT3-C exhibit significantly increased foci formation compared with controls (P = 0.000000244 for HMGA1a and P = 0.038 for STAT3-C, Student’s t test). B-i, gel shift analysis shows increased STAT3 binding activity in splenocytes from HMGA1a mice compared with control splenocytes. The CPA-7 inhibitor blocks binding of STAT3 to its cognate binding site in both transgenic and control splenocytes. B-ii, blocking STAT3 induces apoptosis in leukemia cells from HMGA1a transgenic mice. Terminal deoxyribonucleotidyl transferase–mediated dUTP nick end labeling (TUNEL) assay shows apoptosis in the transformed splenocytes from the HMGA1a mice (right, see arrows) compared with the control splenocytes.
Blocking STAT3 function induces apoptosis in leukemia cells from the HMGA1a mice
To define the role of STAT3 in HMGA1a-mediated transformation, we blocked STAT3 function in leukemia cells from our HMGA1a transgenic mice with the inhibitor CPA-7 (17). CPA-7 specifically prevents activated STAT3 from dimerizing and thereby blocks binding to the target DNA (17). Because STAT3 up-regulates its own expression, CPA-7 also reduces activated STAT3 levels. In gel shift experiments, we found that STAT3 binding activity was increased in the splenocytes from the HMGA1a mice compared with control mice (Fig. 2B-i; see also Supplementary Fig. S2A for full gel and probe in repeat experiment). CPA-7 treatment for 48 hours effectively blocked binding of activated STAT3 to an oligonucleotide containing a consensus STAT3 binding site in splenocytes from the HMGA1a and control mice (Fig. 2B-i; Supplementary Fig. S2A). Moreover, blocking STAT3 activity induces apoptosis in the transformed HMGA1a splenocytes, but not in control splenocytes (Fig. 2B-ii), suggesting that STAT3 is required for viability in HMGA1a transformed lymphocytes.
STAT3 and HMGA1a expression are positively correlated in primary human acute lymphoblastic leukemia samples
To determine if STAT3 is up-regulated in primary human leukemia, we measured STAT3 mRNA in bone marrow samples from 27 patients with acute lymphoblastic leukemia. STAT3 mRNA was increased in 5 of 6 T-cell leukemia samples (range, 1.7- to 198-fold) and 17 of 21 B cell leukemia samples (range, 2.0- to 207-fold) compared with control lymphocytes (Fig. 3A). These leukemia samples also over-express HMGA1a by >2- to 8-fold above that of normal lymphocytes as we previously described (8). Spearman’s rank correlation coefficient showed a significant positive correlation (P = 0.049) between HMGA1a and STAT3 in the leukemia samples, indicating that the HMGA1a–STAT3 axis is up-regulated in these cases (Fig. 3B).
Figure 3.

STAT3 and HMGA1a expression are positively correlated in primary human acute lymphoblastic leukemia samples. A, STAT3 mRNA is increased in most human leukemia samples (22 of 27) already shown to overexpress HMGA1a (8) by 2- to 200-fold compared with the control cells (C) by quantitative RT-PCR. Experiments were done in triplicate and performed at least twice. (HMGA1a mRNA levels were previously published; see ref. 8.) B, there is a positive correlation between STAT3 mRNA and HMGA1a mRNA (P = 0.049, Spearman’s rank correlation coefficient).
The HMGA1a–STAT3 axis is a potential Achilles heel in human hematopoietic malignancy
Next, we determined if STAT3 is required for the transformed phenotype in human leukemia cells. To this end, we blocked STAT3 function in HEL-HMGA1a cells and evaluated transformation phenotypes, including cellular motility and foci formation in soft agar. To block STAT3 function, we infected these cells with a lentiviral construct (20) expressing a dominant-negative STAT3 (DN-STAT3; ref. 14) linked to green fluorescent protein or with a control lentivirus linked to green fluorescent protein alone. The DN-STAT3 blocks STAT3 binding (Supplementary Fig. S2A–C). We found that HEL-HMGA1a cells with DN-STAT3 had decreased motility (P = 0.000645, Student’s t test) and foci formation (P = 0.00139, Student’s t test) in soft agar compared with controls (Fig. 4A-i to A-iii). In contrast, DN-STAT3 had a minimal effect on foci formation or motility in the control HEL cells (Fig. 4A-i to A-iii).
Figure 4.

Blocking STAT3 function interferes with cell motility and anchorage-independent cell growth in human leukemia and lymphoma cells that overexpress HMGA1. A-i, parental human erythroleukemia HEL-Control or HEL-HMGA1a cells were transduced with a control green fluorescent protein lentivirus (Control) or a lentivirus expressing dominant-negative STAT3 linked to green fluorescent protein (DN-STAT3). DN-STAT3 significantly decreases motility in the HEL-HMGA1a cells, causing fewer cells to migrate through the membrane (P = 0.000645, Student’s t test). There is no effect of DN-STAT3 on the HEL-Control cells. Experiments were done in triplicate and repeated twice. Columns, mean percent cells migrated from repeat experiments; bars, SD. HEL-Control cells transduced with the control vector were arbitrarily assigned a value of 100%. A-ii, DN-STAT3 decreases foci formation in HEL-HMGA1a cells (P = 0.000248) but has no significant effect on transformation in the HEL-Control cells. Columns, foci number from repeat experiments; bars, SD. (As above, HEL-Control transduced with control vector were assigned a value of 100%.) A-iii, foci from the HEL control or HEL-HMGA1a cells with or without DN-STAT3 under fluorescence microscopy. B-i, DN-STAT3 also decreases motility in Burkitt’s lymphoma cells causing significantly fewer cells to migrate through the membrane (P = 0.0000126). Experiments were done in triplicate and done twice. Columns, mean from repeat experiments; bars, SD. The Burkitt’s cells transduced with control vector were assigned a value of 100%. B-ii, DN-STAT3 also blocks foci formation in human Burkitt’s leukemia cells (P = 0.00000546). As above, experiments were done in triplicate and performed twice. Columns, foci number from repeat experiments; bars, SD. B-iii, foci from Burkitt’s cells with or without DN-STAT3 under fluorescence microscopy.
To further assess the role of the HMGA1a–STAT3 axis in human hematopoietic malignancy, we repeated these studies in a Burkitt’s cell line (RA 1 Ramos; ATCC), derived from an aggressive B-cell childhood lymphoma/leukemia. Using an RNA interference approach, we previously showed that these cells are dependent on HMGA1a for the transformed phenotype in soft agar (3). Here, we find that the Burkitt’s cells with DN-STAT3 exhibited markedly decreased motility (P = 0.0000126, Student’s t test) and foci formation (P = 0.00000546, Student’s t test; Fig. 4B-i to B-iii). DN-STAT3 did not affect cellular proliferation in cultured HEL-HMGA1a or Burkitt’s cells (Supplementary Fig. S3A and B), showing that the DN-STAT3 vector was not toxic to cell growth in these cell lines. Taken together, these functional studies indicate that STAT3 is a critical downstream target of HMGA1 in hematopoietic malignancy.
Discussion
We show that HMGA1 directly up-regulates STAT3 in hematopoietic malignancy. This is the first demonstration of an oncogene (other than STAT3) that directly activates STAT3 expression. Because activated STAT3 plays a pivotal role in malignant transformation (14–17), identifying the molecular pathways that lead to increases in STAT3 expression and protein levels will be critical to better understand how cancer develops. STAT3 is a member of the STAT proteins that communicate signals from the cell membrane to the nucleus and thereby mediate diverse biological processes including cell growth, differentiation, apoptosis, fetal development, inflammation, and immune responses. Like HMGA1 (1, 2), activated STAT3 is up-regulated in human tumors arising from diverse tissues (14–17).
Our studies identify the HMGA1a–STAT3 axis as a potential Achilles heel that could be targeted therapeutically in hematopoietic malignancies. We show that the STAT3 inhibitor CPA-7 leads to apoptosis in leukemia cells from the HMGA1a transgenic mice but not in normal lymphoid cells. We also show that blocking STAT3 function in human leukemia or lymphoma cells overexpressing HMGA1a interferes with transformation by decreasing both cellular motility and foci formation. Because some cancer cells seem to be dependent on an oncogene for survival (oncogene addiction), targeting the relevant oncogenic pathways should preferentially induce cell death in these cancer cells. We found that the HMGA1a–STAT3 axis is required in some hematopoietic malignancies, and this dependence could be exploited therapeutically. The results with primary human leukemia samples also indicate that this pathway is active in both T-cell and B-cell acute lymphoblastic leukemias.
Our studies also predict a model for hematopoietic malignancy whereby overexpression of HMGA1a leads to direct induction of the STAT3 mRNA followed by increases in activated STAT3 protein. How STAT3 becomes activated by phosphorylation in this setting is not yet clear. Because cytokines known to activate T cells also lead to STAT3 phosphorylation, T-cell activation in vivo should lead to STAT3 activation in these cells. Activated STAT3 protein could then contribute to neoplastic transformation. In non–T-cell leukemia, constitutive tyrosine kinase activity or alternative, undefined pathways may lead to STAT3 activation. Results from other gene expression studies with cells overexpressing HMGA1a also show up-regulation of cytokine receptors, cytokines, and/or their pathways that can activate STAT3 (5). Similar to other pivotal signaling molecules, there are likely to be multiple cellular pathways, including HMGA1a-dependent and HMGA1a-independent signals, that up-regulate and activate STAT3.
In summary, we show that STAT3 is a direct HMGA1a target gene that is necessary for HMGA1a-mediated transformation in hematopoietic cells. These findings implicate the HMGA1a–STAT3 axis as a rational therapeutic target in hematopoietic malignancy.
Supplementary Material
Acknowledgments
Grant support: The American Cancer Society Research Scholar Award LIB-101196, R01 CA092339, NCI Lymphoma SPORE grant P50 CA96888, and Leukemia and Lymphoma Scholar Award 1694-06 (L.M.S. Resar); Alex’s Lemonade Stand Foundation Awards (L. M. S. Resar and J. Hillion); NIH grant T32 CA60441 (M. Mukherjee and partial support for T. F. Sumter, R. Bhattacharya, and O. Elbahloul); and NIHT32 CA, the Intramural Research Program of the NIH, National Cancer Institute (P. Aplan and Y-W. Lin).
We thank Dr. Barbara Migeon for inspiration, insightful discussions, and a thoughtful review of the manuscript; The Sidney Kimmel Comprehensive Cancer Center Tumor and Cell Procurement Bank for providing the leukemia samples; and the numerous authors whose work could not be cited due to space limitations.
Footnotes
Note: Supplementary data for this article are available at Cancer Research Online (http://cancerres.aacrjournals.org/).
Disclosure of Potential Conflicts of Interest
No potential conflicts of interest were disclosed.
References
- 1.Fusco A, Fedele M. Roles of HMGA proteins in cancer. Nat Rev Cancer. 2007;7:899–910. doi: 10.1038/nrc2271. [DOI] [PubMed] [Google Scholar]
- 2.Reeves R. Molecular biology of HMGA proteins: hubs of nuclear function. Gene. 2001;277:63–81. doi: 10.1016/s0378-1119(01)00689-8. [DOI] [PubMed] [Google Scholar]
- 3.Wood LJ, Mukherjee M, Dolde CE, et al. HMG-I/Y: a new c-Myc target gene and potential oncogene. Mol Cell Biol. 2000;20:5490–502. doi: 10.1128/mcb.20.15.5490-5502.2000. [DOI] [PMC free article] [PubMed] [Google Scholar]
- 4.Wood LJ, Maher JF, Bunton TE, Resar LMS. The oncogenic properties of the HMG-I gene family. Cancer Res. 2000;60:4256–61. [PubMed] [Google Scholar]
- 5.Reeves R, Edberg DD, Ying L. Architectural transcription factor HMGI(Y) promotes tumor progression and mesenchymal transition of human epithelial cells. Mol Cell Biol. 2001;21:575–94. doi: 10.1128/MCB.21.2.575-594.2001. [DOI] [PMC free article] [PubMed] [Google Scholar]
- 6.Takaha N, Resar LM, Vindivich D, Coffey DS. High mobility group protein HMGI(Y) enhances tumor cell growth, invasion, and matrix metalloproteinase-2 expression in prostate cancer cells. Prostate. 2004;60:160–7. doi: 10.1002/pros.20049. [DOI] [PubMed] [Google Scholar]
- 7.Scala S, Portella G, Fedele M, Chiapetta G, Fusco A. Adenovirus-mediated suppression of HMGI(Y) protein synthesis as potential therapy of human malignant neoplasias. Proc Natl Acad Sci U S A. 2000;85:6047–51. doi: 10.1073/pnas.070029997. [DOI] [PMC free article] [PubMed] [Google Scholar]
- 8.Xu Y, Sumter Felder T, Bhattacharya R, et al. The HMG-I oncogene causes highly penetrant, metastatic lymphoid malignancy in transgenic mice and is overex-pressed in human lymphoid malignancy. Cancer Res. 2004;64:3371–75. doi: 10.1158/0008-5472.CAN-04-0044. [DOI] [PubMed] [Google Scholar]
- 9.Fedele M, Pentimalli F, Baldassarre G, et al. Transgenic mice overexpressing the wild-type form of the HMGA1 gene develop mixed growth hormone/prolactin cell pituitary adenomas and natural killer cell lymphomas. Oncogene. 2005;24:3427–35. doi: 10.1038/sj.onc.1208501. [DOI] [PubMed] [Google Scholar]
- 10.Tesfaye A, Di Cello F, Hillion J, et al. The high-mobility group A1 gene up-regulates cyclooxygenase 2 expression in uterine tumorigenesis. Cancer Res. 2007;67:3998–4004. doi: 10.1158/0008-5472.CAN-05-1684. [DOI] [PubMed] [Google Scholar]
- 11.Munshi N, Yie Y, Merika M, et al. The IFN-β enhancer: a paradigm for understanding activation and repression of inducible gene expression. Cold Spring Harb Symp Quant Biol. 1999;64:149–59. doi: 10.1101/sqb.1999.64.149. [DOI] [PubMed] [Google Scholar]
- 12.Treff NR, Dement GA, Adair JE, et al. Human KIT ligand promoter is positively regulated by HMGA1 in breast and ovarian cancer cells. Oncogene. 2004;23:8557–62. doi: 10.1038/sj.onc.1207926. [DOI] [PubMed] [Google Scholar]
- 13.Treff NR, Pouchnik D, Dement GA, Britt RL, Reeves R. High-mobility group A1a protein regulates Ras/ERK signaling in MCF-7 human breast cancer cells. Oncogene. 2004;23:777–85. doi: 10.1038/sj.onc.1207167. [DOI] [PubMed] [Google Scholar]
- 14.Bromberg JF, Horvath CM, Besser D, Lathem WW, Darnell JE. Stat3 activation is required for cellular transformation by v-src. Mol Cell Biol. 1998;18:2553–58. doi: 10.1128/mcb.18.5.2553. [DOI] [PMC free article] [PubMed] [Google Scholar]
- 15.Bromberg JF, Wrzeszczynska MH, Devgan G, et al. Stat3 as an oncogene. Cell. 1999;98:295–303. doi: 10.1016/s0092-8674(00)81959-5. [DOI] [PubMed] [Google Scholar]
- 16.Yu H, Jove R. The STATs of cancer—new molecular targets come of age. Nat Rev Cancer. 2004;4:97–105. doi: 10.1038/nrc1275. [DOI] [PubMed] [Google Scholar]
- 17.Turkson J, Zhang S, Palmer J, et al. Inhibition of constitutive signal transducer and activator of transcription 3 activation by novel platinum complexes with potent antitumor activity. Mol Cancer Ther. 2004;3:1533–42. [PubMed] [Google Scholar]
- 18.Varga T, Aplan PD. Chromosomal aberrations induced by double strand DNA breaks. DNA Repair. 2005;4:1038–46. doi: 10.1016/j.dnarep.2005.05.004. [DOI] [PMC free article] [PubMed] [Google Scholar]
- 19.Kato K, Nomoto M, Izumi H, et al. Structure and functional analysis of the human STAT3 gene promoter: alteration of chromatin structure as a possible mechanism for the up-regulation in cisplatin-resistant cells. Biochem Biophys Acta. 2000;1493:91–100. doi: 10.1016/s0167-4781(00)00168-8. [DOI] [PubMed] [Google Scholar]
- 20.Lois C, Hong EJ, Pease S, Brown EJ, Baltimore D. Germline transmission and tissue-specific expression of transgenes delivered by lentivirus vectors. Science. 2002;295:868–72. doi: 10.1126/science.1067081. [DOI] [PubMed] [Google Scholar]
- 21.Di Cello F, Hillion J, Kowalski J, et al. Cyclooxygenase inhibitors block uterine tumorigenesis in HMGA1a transgenic mice and human xenografts. Mol Cancer Ther. 2008;7:2090–5. doi: 10.1158/1535-7163.MCT-07-2282. [DOI] [PMC free article] [PubMed] [Google Scholar]
- 22.Karhadkar SS, Bova SG, Abdallah N, et al. Hedgehog signaling in prostate regeneration, neoplasia, and metastasis. Nature. 2004;431:701–12. doi: 10.1038/nature02962. [DOI] [PubMed] [Google Scholar]
Associated Data
This section collects any data citations, data availability statements, or supplementary materials included in this article.