Abstract
The members of the ionotropic glutamate receptor family, namely, a-amino-3-hydroxy-S-methyl-4-isoxazole propionate (AMPA), kainate, and N-methyl-D-aspartate (NMDA) receptors, are important mediators of the rapid synaptic transmission in the central nervous system. We have investigated the splicing pattern and expression of the kainate receptor subunit GluR6 in human fibroblast cell lines and brain tissue. We demonstrate the expression of GluR6A variant specifically in brain, and four variants, namely, GluR6B, GluR6C, GluR6D and GluR6E in fibroblast cell lines. The variants GluR6D and GluR6E have not been described before, and appear to be specific for non-neuronal cells. Genomic analysis and cloning of the sequence preceding the transcribed region led to the identification of two tissue specific promoters designated as neuronal promoter PN and non-neuronal promoter PNN. We have used RNA ligase mediated RACE and in silico analyses to locate two sets of transcription start sites, and confirmed specific transcripts initiated by PN and PNN in brain cells and fibroblasts, respectively. The domain structure of variants GluR6D and GluR6E revealed the absence of three transmembrane domains. The lack of these domains suggests that the mature receptors arising from these variant subunits may not function as active channels. Based on these structural features in GluR6D and GluR6E, and the observations that GluR6B, GluR6C, GluR6D and GluR6E are exclusively expressed in non-neuronal cells, it is likely that these receptor subunits function as non-channel signaling proteins.
Keywords: Neuronal promoter, Nonneuronal promoter, Alternative spliocing, non-channel glutamate receptor, Tissue specific splicing
INTRODUCTION
A variety of physiological functions in the central nervous system are mediated by binding of the major excitatory neurotransmitter L-glutamate to its receptor (Myers et al., 1999). The ligand-receptor interaction initiates a cascade of downstream changes in the cell. The molecular investigations of glutamate receptors have mainly been focused on neuronal tissues because of the primary excitatory role of the neurotransmitter in brain. However, the expression and function of these receptors in non-neuronal cells have not been addressed adequately. Such investigations are important for understanding their tissue specific roles.
There are two classes of glutamate receptors, namely, metabotropic glutamate receptors (mGluRs) and ionotropic glutamate receptors (iGluRs). While the mGluRs are a subset of G-protein coupled receptors (Tanabe et al., 1992), the multimeric ligand-gated iGluR channels control the flux of sodium and calcium ions across the membrane (Dingledine et al., 1999). The three subtypes of iGluRs (Hollman and Heinemann, 1994) are classified based on their binding to agonists such as N-methyl-D-aspartate (NMDA), a-amino-3-hydroxy-5-methyl-4-isoazolepropionic acid (AMPA) and 2-carboxy-3-carboxymethyl-4-isopropenylpyrrolidine (kainate). The kainate group includes five receptors designated as GluR5-7 and KA1-2. The GluR5g receptors are functional both as homomers and heteromers (Fogarty et al., 2000). However, the KA1-2 receptors require heteromerization with the GluR5-7 receptors for the assembly of functional channels ([Lerma, 1999] and [Herb et al., 1992]).
The complete coding sequence of GluR6 (Paschen et al., 1994) has revealed the intron-exon structure of the gene spanning ~700 Kb of genomic DNA located at chromosomal interval 6q21. The various members of the iGluR family have been cloned ([Myers et al., 1999] and [Dingledine et al., 1999]) and the promoter sequences from some ionotropic receptors have also been characterized ([Myers et al., 1999],[Bai and Kusaik, 1995], [Sasner and Buonanno, 1996], [Suchanek et al., 1995], [Borges and Dingledine, 1998], [Kohler et al., 1994], [Myers et al., 1998] and [Huang and Gallo, 1997]). The genomic organization of GluR6 and expression patterns of its A, B and C splice variants in neuronal tissues and non-neuronal cell lines have already been described ([Barbon et al., 2001] and [Barbon et al., 2008]). Among these three variants, GluR6A was the main isoform expressed in the central nervous system, while barely detectable levels of GluR6B and extremely low levels of GluR6C were present in spinal cord and corpus callosum. However, GluR6C was the only variant expressed in non-neuronal cell lines.
We reverse transcribed mRNAs from human brain tissue and fibroblast cells and cloned full-length cDNAs. The analysis of cloned cDNAs led to the identification of four alternatively spliced variants (GluR6B, C, D and E) expressed in fibroblast cells. The variants B, C, D and E differ from GluR6A, which is expressed in brain tissue. We further characterized the transcription start sites for GluR6 in brain tissue and fibroblast cells. The 5′ ends of cDNAs cloned from brain and fibroblasts revealed the presence of two distinct promoters. We describe the characteristic features of these two promoters designated as PN and PNN that are functional in neuronal and non-neuronal cells, respectively. The tissue specific expression of GluR6 variants is discussed in the light of their role in non-channel specific signaling pathways.
1. MATERIALS AND METHODS
1.1. In silico characterization of GluR6 gene
The genomic sequence of GluR was analyzed for promoter characteristics, transcription start sites, transcription factor binding sites and exon-intron organization by using a variety of web-based bioinformatic tools. The promoter regions were predicted using CpG Plot/CpG Report (http://www.ebi.ac.uk/cpg/) and GrailEXP v3.31 (http://compbio.ornl.gov/grailexp/). The binding site motifs for a variety of transcription factors were located in the promoter region by using TESS (http://www.ebil.upenn.edu/tess/) and TFSEARCH (htpp://www.ebrc.jp/research/db/TFSEARCH.html). Transcription start sites were predicted using Eponine transcription start site finder (http://servlet.sanger.ac.uk.8080/eponine/). The genomic organization on a 1 Mb sequence of chromosomal interval 6q21 was determined by comparing the cDNA sequence (accession # U16126) against non-redundant database using blastn and bl2seq programs.
1.2. Cell lines and culture conditions
We used normal human diploid fibroblasts (HDF) GM03468A (Human Genetic Mutant Repository, Camden NJ) and FS2 (cultured from foreskins), monkey kidney cells COS7, human astrocytoma cells U87MG (ATCC) and ovarian cancer cell line SKOV3 (ATCC). The cells were cultured in DMEM medium supplemented with 10% fetal bovine serum, 10 mg/ml of streptomycin and 10 units of penicillin at 37° C in 7% CO2/air atmosphere. The cells were harvested from logarithmic phase and processed for RNA isolation.
1.3. RNA Extraction and Reverse Transcription-Polymerase Chain Reaction (RT-PCR)
Total RNA was isolated using Trizol Reagent (Invitrogen) following the manufacturer’s protocol. The RNA was precipitated with isopropyl alcohol, the pellet washed with 75% ethanol and the precipitate dissolved in RNase free water. The primers for RT-PCR are presented in Table 1. Approximately 0.5–2 mg of total RNA was mixed with 50–100 pmol of oligodT and denatured at 72°C for 5 min. The denatured mixture was incubated for one hour at 42°C with 500 mM of each dNTP, 10 mM dithiothreitol, 1U/ml of RNasin, 200 U of Superscript II RT (Invitrogen) and 1X transcription buffer in a 20 ml reaction volume. The reaction mixture was further incubated for 15 min at 55°C after adding 30 U of RNase H. PCR was performed under standard conditions (35 cycles of 30 sec at 94°C/40 sec at 55°C/1 to 2 min at 72°C/final extension of 10 min) in 25 ml with 1X buffer containing 200 mM dNTPs, 25 pmole of each primer, 1.5 mM MgCl2 and 2.5U of Taq polymerase (Promega).
Table 1.
Designation, sequence and location of various primers*
A. Primers designed from cDNAs
B. Primers designed from genomic DNA sequence
| Accession # | Primer name: Primer sequence | Position on cDNA (Relative to A of ATG) |
|---|---|---|
| U16126 | F1: 5′ATGAAGATTATTTTCCCGATTC3′ | +1 to +22 |
| F2: 5′TTCCAAGCCCTTTATGACAC3′ | +1587 to +1606 | |
| F3: 5′GAACTAATTGATCATAAATCAAAAATC3′ | +1510 to +1536 | |
| R1: 5′TTATGCCATGGTTTCTTTACC3′ | +2727 to +2707 | |
| R2: 5′CTACAGAAGGACCTCTTTTCCAATTG3′ | +2576 to +2551 | |
| R3: 5′GACAACACTGTAGAAATGGAA3′ | +2639 to +2619 | |
| R4: 5′CTGGATGGTTATGGTGGCACT3′ | +2599 to +2580 | |
| R5: 5′TCATATTCAGGCCACTGGCT3′ | +1240 to +1221 | |
| R6: 5′GTGGTTCCTTGAGAATATCC3′ | +98 to +78 | |
| Accession # | Primer Name: Primer sequence | Position on genomic DNA (relative to A of ATG) |
| AP002528 | F4: 5′ CAAGAGGCGAGGAACCCCCGC3′ | −5984 to −5964 |
| F5: 5′ TTCTCTCGCTCTAGCTCCT3′ | −5772 to −5754 | |
| F6: 5′ AAAGCCATCACCCAGAAGCAA3′ | −5664 to −5644 | |
| F7: 5′ ACCAAGGCTGGGTTTCCTAC3′ | −341 to −322 | |
| F8: 5′ CGAGGGCCCATTAGGCTGCA3′ | −7500 to −7480 | |
| F9: 5′ ATCTTGGAGTCTGCGACCT3′ | −6443 to −6425 | |
| F10: 5 AAAGCCATCACCCAGAAGCAA3′ | −5984 to −5966 | |
| F11: 5′ CTTAGTCTCCCCATCCCAGGA3′ | −5863 to −5842 | |
| F12: 5′ GGGAGCGAAGTCCAGCCGGAGGC3′ | −5827 to −5805 | |
| F13: 5′ ATTCTCTCGCTCTAGCTCCTGTG3′ | −5773 to −5751 | |
| F14: 5′ CTCCTCGGTCACCGTCTTCGCC3′ | −5601 to −5580 | |
| F15: 5′ TTCCGCCCGACCTCCTCCG3′ | −5518 to −5500 | |
| F16: 5′ TAAGGTGCTCGAACAGTCG3′ | −1839 to −1821 | |
| F17: 5′ GAATAAACTCCTAACGAAAGCC3′ | −1257 to −1236 | |
| F18: 5′ AAACTGACTTTGATTTAGCTAG3′ | −710 to −688 | |
| F19: 5′ ACCAAGGCTGGGTTTCCTAC3′ | −341 to −322 | |
| F20: 5′ ATGAAGATTATTTTCCCGAT3′ | −1 to +20 | |
| R7: 5′TGACGGCAGCGGCGAAGTC3′ | −5571 to −5589 | |
| R8: 5′AGCTAGAGCGAGAGAATTC3′ | −5757 to −5775 | |
| R9: 5′ AAGACTCGCAGTGAATCCGT3′ | −5253 to −5272 | |
| R10: 5′ GGTAAAGAAACTCTATCTCCT3′ | −4820 to −4840 | |
| R11: 5′ AGAGCGAACCGCCTGTTTA3′ | +170 to +188 | |
The nucleotide A of ATG codon is designated as +1, and bases upstream of +1 in the genomic sequence are given negative numbers.
1.4. Cloning of 5′-untranslated region (UTR) of GluR6 gene
First strand cDNA, obtained from GM03468A RNA, was amplified with primer F5 and R5 (Table 1 and Figure 4A). An aliquot of the product was re-amplified with an internal antisense primer R6, located in the first exon of the ORF. The transcription start sites (TSS) were identified by using three sense oligonucleotides, F4, F5 and F6 in combination with antisense oligonucleotide R6 (Table 1 and Figure 4A). PCR was performed as described above. The amplified products were cloned in pGEMTeasy vector (Promega) and sequenced.
Figure 4.
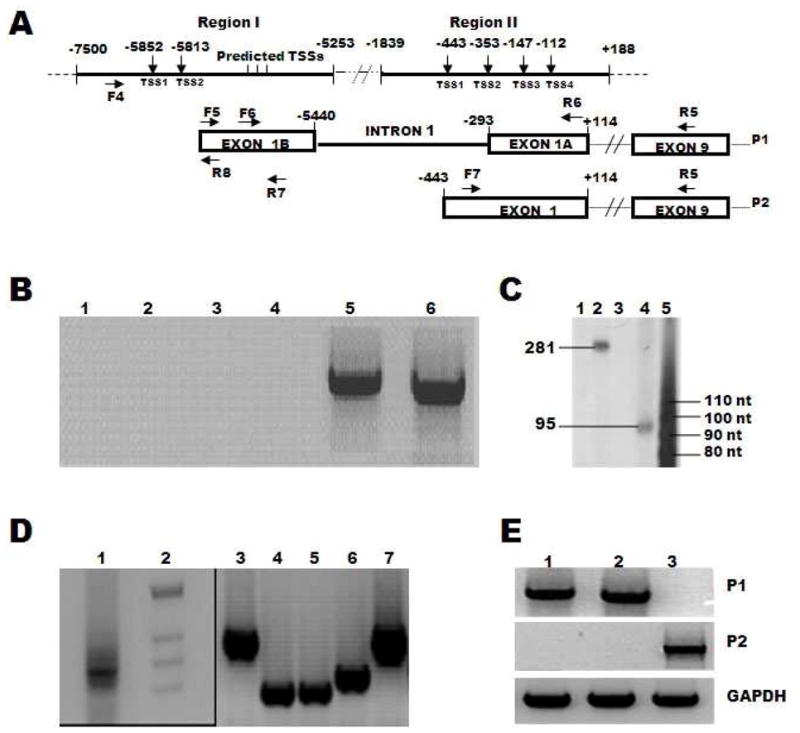
Promoter regions, transcription start sites and transcripts specific to two promoters of GluR6 gene. A. Map of GluR6 promoter regions I and II with respect to +1 A of ATG on genomic DNA sequence. The location of transcription start sites, 5′UTR and primers for amplifying promoter specific transcripts are indicated. B. Photograph of ethidium stained agarose gel contain - PCR amplified products of fibroblast cDNA with F4 and R6 (lane 1), brain cDNA with F5 and R6 (lane 2), brain cDNA with F6 and R6 (lane 3), fibroblast cDNA with F4 and R6 (lane 4), fibroblast cDNA with F5 and R6 (lane 5) and fibroblast cDNA with F6 and R6 (lane 6). Note the lack of amplification in lanes 1–4. C. Transcription start sites were mapped by extending the primers R7 and R8 annealed to RNA isolated from HDF cells. The extended products of R7 without RNA (lane 1), R7 with RNA (lane 2), R8 without RNA (lane 3), R8 with RNA (lane 4) were electrophoresed and sizes determined by comparison with a 10-base ladder of single stranded DNA (lane 5). D. 5′RLM RACE Ready cDNA from human brain was amplified with 5′RACE primer and gene specific inner primer R6 (lane 1) and the products were cloned. The cDNA inserts from individual clones were amplified by using 5′ RACE inner primer and gene specific primer R6 (lanes 3–6). The sizes of cDNA inserts in individual clones were determined by comparing with size markers (lane 2). E: The transcripts initiating from promoters 1 and 2 were specifically amplified by RT-PCR of FS2 RNA (lane 1), GM03468A RNA (lane 2) and human brain RNA (lane 3). Top and middle panels represent P1 and P2 specific transcripts, and the bottom panel shows amplification of GAPDH transcript as an internal control.
1.5. Primer extension assay to characterize transcription start sites (TSS)
The antisense primers R7 and R8, located in 5′untranslated exon 1, were used for primer extension assay to define TSS (Table 1 and Figure 5A). The primers were end-labeled with γ-32P ATP using T4 polynucleotide kinase (NEB) and incubated individually with total RNA (10 mg) at 65°C for 20 min and then at room temperature for 15 min. The extension was carried out with MMLV-reverse transcriptase (Promega) at 37°C for 40 min, the products were separated in an 8% polyacrylamide/7M urea gel and the gel was exposed to X-ray film.
Fig 5.
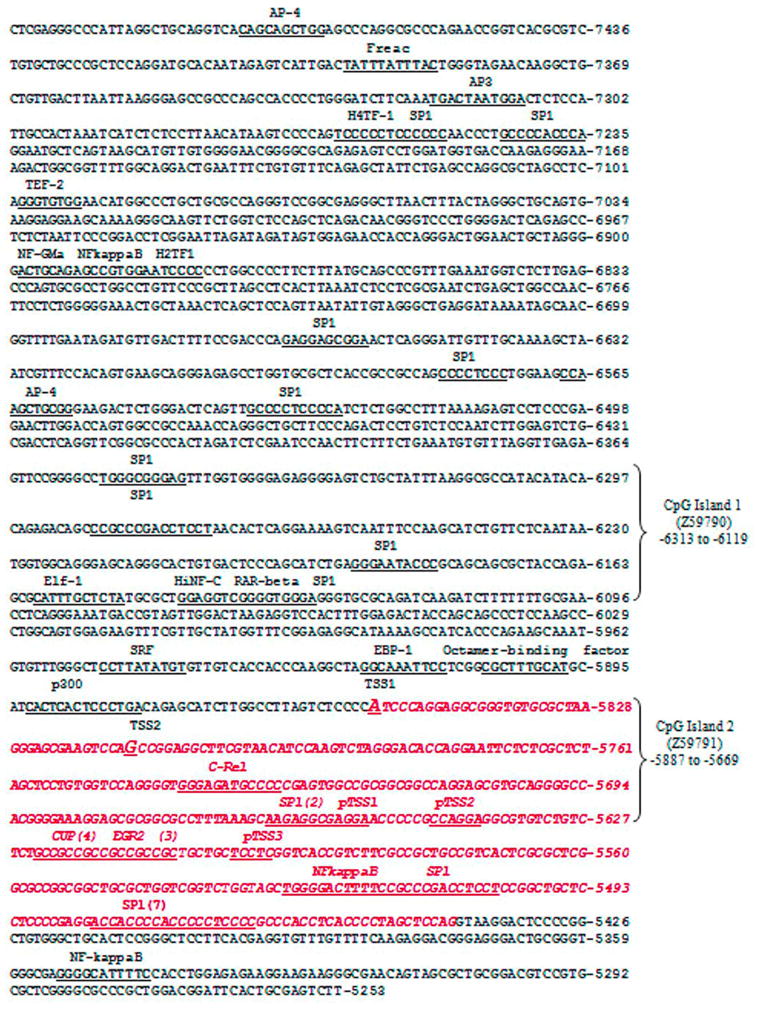
Nucleotide sequence of promoter 1. The experimentally determined transcription start sites (TSS1 and TSS2) and predicted TSS (pTSS1, pTSS2 and pTSS3) are underlined and written above the sequence. Untranslated exons are italicized and CpG islands are marked. The base A of the codon ATG of the second exon is numbered as +1.
2.6. 5′ RNA Ligase Mediated (RLM) - RACE
RACE Ready cDNA (2 ml) from human brain (Ambion) was amplified using 5′RACE outer sense primer (provided by the supplier) and gene specific antisense primer R5, designed from exon 9 of ORF of the gene, in a 20 ml reaction mix containing 1X buffer (Promega), 200 mM dNTPs, 25 pmole of each primer, 1.5 mM MgCl2 and 2.5U of Taq polymerase (Promega). PCR conditions consisted of initial denaturation at 94°C for 4 min followed by 35 cycles of 94°C (30s)/55°C (30s)/72°C (2 min). The product was re-amplified using 5′RACE inner sense primer and the gene specific antisense primer R6 (Table 1 and Figure 4A). The amplified DNA was cloned in pGEMTeasy vector (Promega) and sequenced.
2.7. Identification of GluR6 promoter regions
Two suspected regions from genomic DNA were amplified either using primer pairs F8 and R9 or F16 and R11 (Table 1, Figures 7A and 8A). The forward primers F8 and F16 both contained a Kpn I restriction site at the 5′ end, and the reverse primers R9 and R11 had phosphate groups at their 5′ ends. PCR was performed as above, the products were digested with KpnI and cloned in KpnI and Sma I sites of pGL3 basic luciferase reporter vector (Promega). The clones were sequenced and designated as -7500 pGL3 (P1) and -1839 pGL3 (P2) (Figs 7 and 8). The purified plasmid DNAs (20 mg) were transfected individually into COS7 cells (monkey kidney cells) along with pRL-CMV vector (0.2 mg) as control reporter vector. After 48h of transfection, cells were lysed and assayed for firefly and renilla luciferase using Dual Luciferase Reporter Assay System (Promega). Ratio of firefly and renilla luciferase activity was taken as a measure of the relative luciferase activity (RLA).
Fig 7.
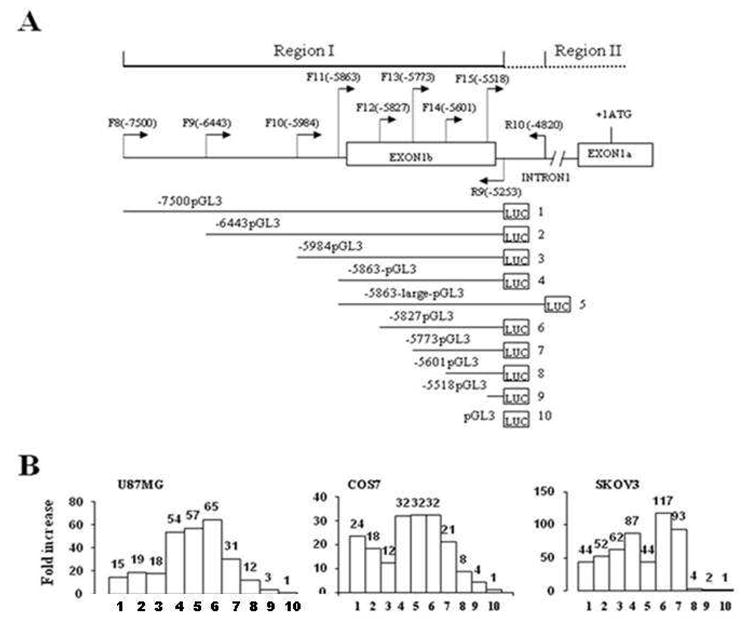
Characterization of GluR6 promoter 1. A. Eight constructs of promoter 1 with different deletions at the 5′end were made in pGL3 vector by amplifying human normal fibroblast DNA using different sense primers F8, F9, F10, F11, F12, F13, F14, F15 in combination with antisense primer R9. Construct #5 was made after amplifying with sense primer F11 and antisense primer R10. Construct #10, an empty vector, was used as a control. The location of the primers is indicated with respect to the base A of the codon ATG. B. Transcriptional activity of different constructs of promoter region cloned in pGL3 and designated as 1–10 was determined by co-transfecting each construct with pRL-CMV (pCMV-derived renilla luciferase with enhancer elements) as an internal control. Relative luciferase activity (RLA) is presented as mean of percent of ratio of firefly to renilla luciferase activity obtained in three independent experiments. Fold increase in RLA over the empty vector was calculated for each construct.
Fig 8.
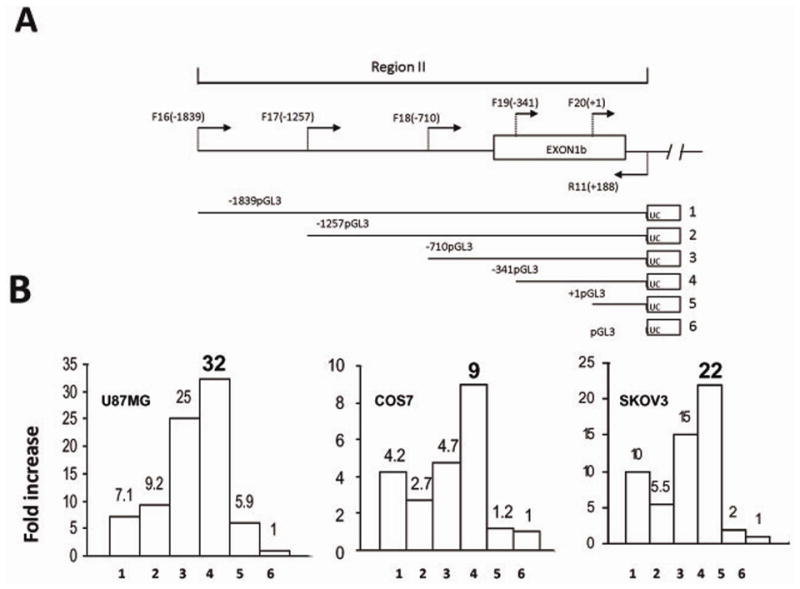
Characterization of GluR6 promoter 2. A. Five constructs of promoter 2 with different extents of deletions at the 5′ end were made in pGL3 by amplifying human normal fibroblast DNA using sense primers F16, F17, F18, F19, F20 in combination with R11. Construct #6, an empty vector, was used as a control. B. Transcriptional activity of different constructs of promoter 2 cloned in pGL3 and designated as 1–6 was determined by cotransfecting each construct with pRL-CMV (pCMV-derived renilla luciferase with enhancer elements) as an internal control. Relative luciferase activity (RLA) is presented as mean of percent of ratio of firefly to renilla luciferase activity obtained in three independent experiments. Fold increase in RLA over the empty vector was calculated for each construct.
2.8. Generation and analysis of 5′ deletion constructs of GluR6 promoters P1 and P2
All constructs were prepared by considering CG-rich regions of individual promoter and transcription start sites determined from RNA of fibroblast cells and human brain. The 5′-deletion constructs -7500 pGL3, -6443 pGL3, -5984 pGL3, -5863 pGL3, -5827 pGL3, -5773 pGL3, -5601 pGL3, and -5518 pGL3 for P1 promoter region were generated by PCR using eight forward primers F8, F9, F10, F11, F12, F13, F14 and F15 in combination with phosphorylated reverse primer R9 (Table 1 and Figure 7A). A ninth construct, 5863-large-pGL3 containing an extended 3′-end, was prepared using F11 and R10 (Table 1 and Figure 7A) as forward and reverse primers, respectively. Similarly, the 5′-deletion constructs 1839-pGL3, 1257-pGL3, 710-pGL3, 341-pGL3, +1-pGL3 for promoter P2 were made by PCR using five forward primers F16, F17, F18, F19 and F20 in combination with the reverse primer R11 (Table 1 and Figure 8A). The amplified products were digested with Kpn I and cloned in KpnI and SmaI sites of pGL3 basic reporter vector (Promega). The promoter activity was tested in COS7 (monkey kidney cell line), U87MG (astrocytoma cell line) and SKOV3 (ovarian carcinoma cell line).
3. RESULTS
3.1. Genomic Organization of Gene
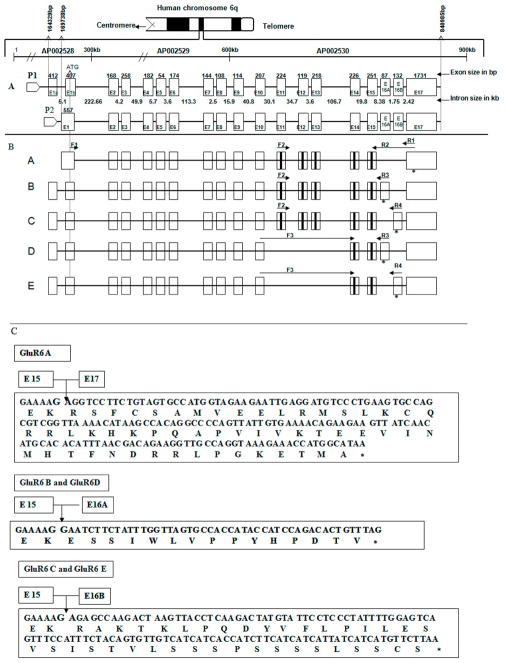
The cDNAs were amplified from total RNA of GM03468A cells (Figure 1) by using primers F1 and R1 (Table 1), corresponding to the known mRNA sequence (Genbank accession # U16126] and [Hoo et al., 1994]), and cloned into pCDNA3.1(+) vector (Invitrogen) to generate a library. Analysis of independent clones from the library revealed four different groups of cDNA inserts sizes (Figure 1). Several clones from each group were sequenced to determine similarities among the cDNAs within same group and differences between different groups. The sequences of clones from specific groups were identical. However, there were differences at the 3′- end, when sequences of clones from different groups were compared. The sequence of the brain GluR6 cDNA was aligned to a ~700 Kb genomic sequence at 6q21 to illustrate the exon–intron organization of GluR6A (Figure 2A). In silico comparative analysis of the cDNA (U16126) and genomic contigs in the database revealed that the 2.7 Kb mRNA consists of 17 exons spanning ~700 Kb of genomic DNA located at the chromosomal interval 6q21. The exons in the gene are interrupted by large introns varying in sizes between 2.5 Kb and 222.66 Kb (Figure 2A).
Figure 1.
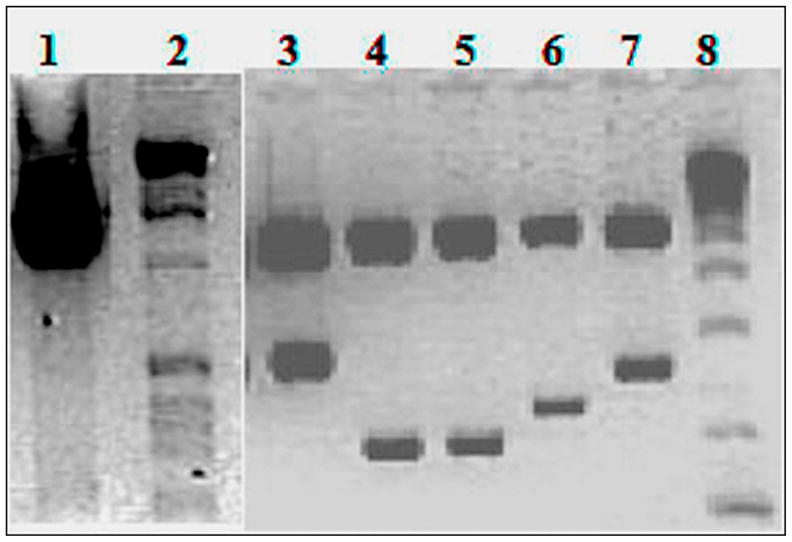
RT-PCR products of GluR6 transcripts and cDNAs. Total RNA was amplified with primers F1 and R1 and cloned into pCDNA3.1+ vector. The PCR products of total RNA from GM03468A cells (lane 1), inserts from representative clones (lanes 3–7) from cDNA library prepared from cDNA in lane 1, and size markers (lanes 2 and 8) were run on agarose gels and the ethidium bromide stained gels were photographed. The photograph shows 2.859kb variant C (lane 3), 2.156 kb variant D (lane 4), 2.298 kb variant E (lane 5), 2.814kb variant B (lane 7). Lane 6 contains a ~ 2.5 kb clone with editing of base A to G at position 236 creating a Kpn1 site. Digestion with the Kpn1, the enzyme used to release the cloned insert, removes 236 bases from the end of the clone.
Figure 2.
Gene structure and five different splice variants of GluR6. A. Genomic organization of 700 kb GluR6 gene located at 6q21. The exons are represented by boxes and numbered as 1–15, 16A, 16 B and 17. The number on the top of each box represents the exon size in base pairs and the number under each line represents intron size in Kb. The location of promoters P1 and P2 are shown relative to ATG on the genomic DNA sequence, the transcription start sites and 5′UTR corresponding to each promoter are indicated. The translation start site, ATG, is identical in all variants. Exon E1a is absent in GluR6A and it is present in variants B, C, D, and E. The exons 11–15 represent transmembrane domains.
B. Alternatively spliced variants GluR6A (cloned from human brain) and GluR6B-E (cloned from normal fibroblasts). The boxes representing exons in variants A, B, C, D and E correspond to the exons designated in panel A. The locations of primers to identify specific variants are marked by arrows, and the asterisk under the box indicates the location of the stop codon. C. Nucleotide sequence of exons 16A, 16B and 17 with corresponding amino acid sequence at the C-termini of various GluR6 variants. The stop codon is indicated by an asterisk.
The mature GluR6 mRNAs in fibroblasts are comprised of 14–17 exons. The comparison of the cDNA sequences from fibroblasts, with known cDNA sequence (accession # U16126), revealed four alternatively spliced variants of GluR6 cDNA, designated as B, C, D and E (Figure 2B). The predicted proteins for all these variants share an identical N-terminus, but differ at their carboxy termini (Figure 2C). Specifically, exons 15 and 17 join together in GluR6A to create 54 amino acids at the C-terminus. The carboxyl termini in GluR6B and GluR6D truncate in exon 16A, thus producing shorter ends containing 15 amino acids. However, the C-termini of GluR6C and GluR6E are contributed by exon 16B, which does not share its sequence and location with exon 16A (Figure 2). The carboxyl ends of these variants are rich in serine residues and contain 38 amino acids. GluR6D and GluR6E are distinguishable from GluR6B and GluR6C by the absence of exons 11, 12 and 13, which code for three transmembrane domains of GluR6 (Figure 2B). The lack of transmembrane domains in variants D and E, and truncation of the translated protein either in exon 16A or exon 16B lead to distinct mature proteins corresponding to variants B, C, D and E.
3.2. Differential expression of GluR6 variants in HDF and human brain
As described in the methods section, we used the forward primer F2 in combination with one of the three reverse primers R2, R3 and R4 (Table 1 and Figure 2B) to distinguish GluR6 variants A, B and C. Similarly, the forward primer F3 was used in combination with reverse primers R3 and R4 to detect variants D and E. All five variants of GluR6 were confirmed by determining the nucleotide sequences of the RT-PCR products of mRNA isolated from HDF (Figure 1) and brain cells. Interestingly, variant A of GluR6, amplified from human brain, was absent in cultured fibroblasts (Figure 3). The variants B, C, D and E were specific for human fibroblast cells. It warrants mention that GluR6 variants A and B have been previously described [Barbon et al., 2001] and variant C was published [Barbon et al., 2008] while this manuscript was in preparation. There are no reports of any other variants of GluR6 in the literature. We present here the first report describing the sequence, splicing arrangement and expression of variants D and E.
Figure 3.
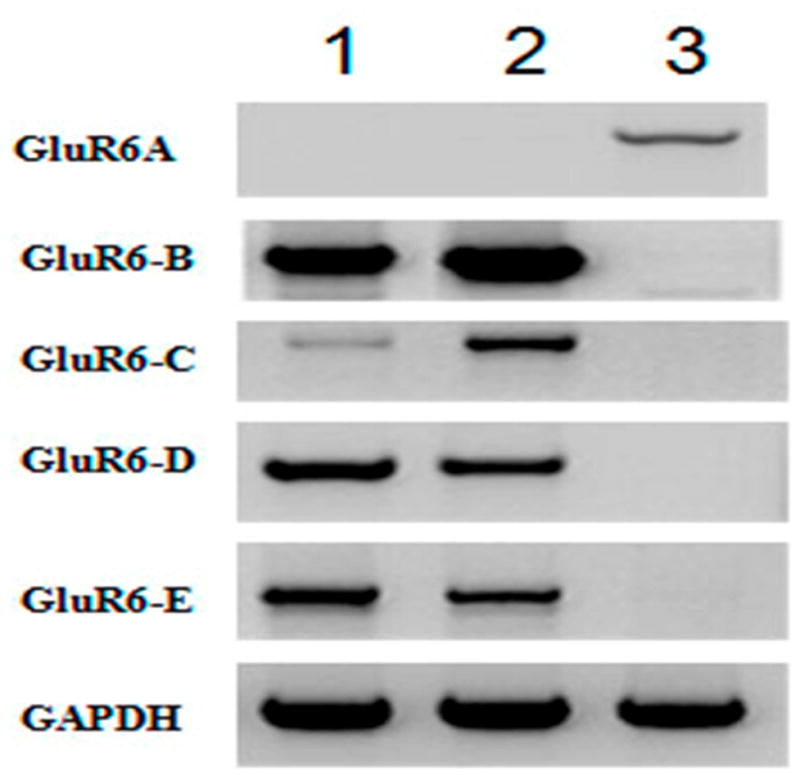
PCR amplification of alternatively spliced variants. Total RNA from FS2 cells (lane 1), GM03468A (lane 2) and human brain (lane 3) were amplified by using exon specific primers as described in the Methods’ section and the products were electrophoresed in an agarose gel. GluR6 variants are marked to indicate the specific primers used for amplification. GAPDH was amplified with corresponding primers as a control.
3.3. Computational analysis of genomic sequence for promoter predictions
In silico analysis of genomic sequence, upstream of ATG, led to the identification of two GC-rich clusters designated as regions I and II (Figure 4A). The GC content of region I (−5253 to −7500) was ~80%, and contained two CpG islands, located at positions −6313 to −6119 and −5887 to −5669 (accession numbers Z59790 and Z59791), three predicted transcription start sites (pTSS1, pTSS2 and pTSS3) and a predicted promoter (Figure 5). However, no promoter and transcription start sites could be predicted in region II (−1839 to +188) that has ~70% GC content (Figure 6).
Fig 6.
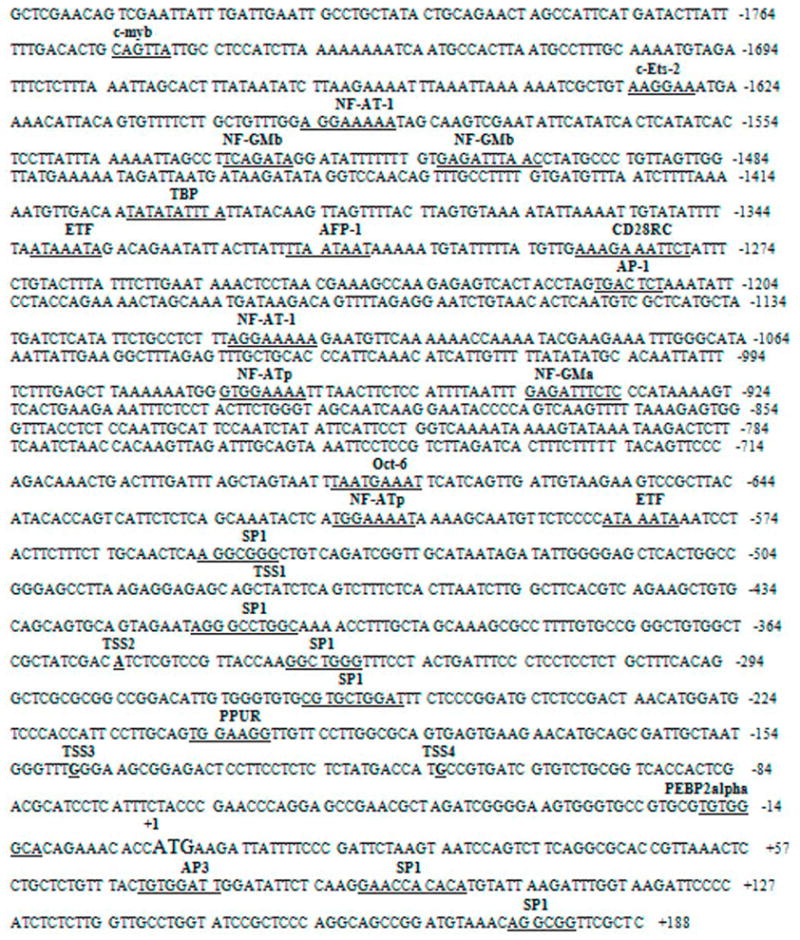
Nucleotide sequence of promoter 2. The experimentally determined transcription start sites (TSS1, TSS2, TSS3 and TSS4) are underlined and written above the sequence. The numbers indicate the position relative to the base A of ATG codon as +1.
3.4. Cloning of 5′UTR of GluR6 and identification of transcription start sites (TSS) in fibroblast cells
Three forward primers F4, F5 or F 6, designed from the predicted transcription start sites, in combination with reverse primer R6 (Table 1 and Figure 4A), were used for RT-PCR amplification of RNA from HDF and human brain. Primer pairs F5/R6 and F6/R6 yielded PCR products from HDF RNA, but not from the human brain RNA (Figure 4B). However, F4/R6 primer pair did not generate any amplicon from HDF or brain RNA. These results demonstrate that F5 and F6 primer sequences are transcribed in HDF but not in brain RNA (Figure 4B). The product of F5/R6 amplification was cloned and sequenced. The sequence of this fragment revealed the untranslated exon 1B and partially translated exon 1A at positions −5440 to −5772 and −293 to +98, respectively (Figure 4). Furthermore, these results confirm the location of intron 1 between nucleotides −293 and −5440 (Fig. 4).
The lack of RT-PCR amplification with primers F4/R6 suggested that TSS are located between nucleotides −5772 and −5984 (Figure 4A). These locations were further defined by primer extension assay using total RNA from HDF and two antisense primers R7 (−5571 to −5589) and R8 (−5757 to −5775) (Figures 4A and C). The single stranded DNA products of 95 nucleotides and 281 nucleotides recovered with R8 and R7 primers indicated a transcription start site (TSS1) surrounded by C nucleotides at −5852 (Figures 4A and C). These results demonstrate TSS1 as the primary transcription start site in HDF, but do not allow us to rule out other minor TSS corresponding to a faint band at position −5813, visible in longer exposure of the gel to X-ray film.
3.5. Cloning of 5′UTR of GluR6A and identification of TSS in human brain
The lack of RT-PCR amplification of RNA from human brain with primer pairs F5/R5 and F6/R5 suggested differences in TSS and 5′ UTR of GluR6 mRNAs between brain and HDF (Figure 4). We, therefore, performed RACE using 5′RLM-RACE Ready cDNA from human brain (Ambion) with 5′RACE outer primer and a gene specific primer R5. An aliquot of the amplicon was re-amplified using 5′RACE inner primer and an internal gene specific primer R6, the products were cloned in pGEMTeasy and inserts from individual clones were characterized by electrophoresis (Figure 4D) and DNA sequence analysis. These data indicated four transcription start sites TSS1, TSS2, TSS3, and TSS4 located at nucleotide positions −443, −353, −147 and −112 (Figure 4A).
3.6. Differential usage of two GluR6 promoters in HDF and human brain cells
To determine if transcription in brain occurs from a promoter distinguishable from the HDF promoter, RT-PCR was performed using forward primers F6 and F7 in combination with the reverse primer R5. The forward primers were designed from TSS identified in RNAs from HDF and human brain, respectively. RT-PCR with primer pair F6/R5 produced an amplicon from HDF RNA, but not from the human brain RNA (Figure 4E). Primer pair F7/R5, on the other hand, yielded an amplicon from the brain RNA, but not from HDF RNA (Figure 4E). These results suggest that promoter P1 actively transcribes the gene in HDF, while promoter P2 is functional in human brain.
3.7. Characterization of promoter elements
The genomic region I located at −5273 to −7503 bp and region II located at −1839 to +188 were analyzed in silico for potential transcription factors (TF) binding sites using TESS and TFSEARCH programs. There were numerous binding sites for TF in region I, but relatively fewer sites in region II (Figures 5 and 6). Both these regions lacked TATA or CAAT boxes as described for promoters of other glutamate receptor genes (Myers et al., 1999).
The candidate promoter regions I and II were cloned into pGL3 vector (Promega) upstream of a promoterless luciferase reporter gene, and the constructs were tested for the expression of luciferase gene in COS7, SKOV3 and U87MG cell lines. The region I promoter construct showed a robust luciferase activity in COS7, SKOV3 and U87MG cells. The comparison of the transcriptional activity of construct #1 with the parent pGL3 plasmid revealed an increase of 24 fold in COS7 cells, 44 fold in SKOV3 and 15 fold in U87MG cells (Figure 7). Similarly, the luciferase activity in cells transfected with the region II promoter construct (construct #1) relative to the parent vector transfectants increased by 4 fold, 10 fold and 17 fold in COS7, SKOV3 and U87MG cells, respectively (Figure 8). It is interesting to note that promoter 1 activity was relatively higher in COS7 and SKOV3 cells as compared to U87MG cells, while the reverse was observed for promoter 2. These data suggest that cell-type specific transcription factors and differences in promoter methylation may likely account for differential activities of these promoters.
3.8. Minimal promoter sequences in regions I and II
To identify minimal promoter sequence and the location of probable enhancer and repressor sequences, segments of promoter P1 were cloned in pGL3 and tested for promoter activity (Figure 7). The truncated fragments were created by PCR using forward primers F8, F9, F10, F11, F12, F13, F14 and F15 and a common reverse primer, R9 (Table 1 and Figure 7). The activity of luciferase gene appeared to be the highest in SKOV3 cells, intermediate in U87MG and the least in COS7 cells (Figure 7B).
The increase in luciferase activity due to deletion of 1637 nucleotides at −7500 to −5863 suggested the presence of negative regulatory elements in this region. The maximum activity was observed with construct #6 that contains one of the two transcription start sites. Although construct #7 lacked both TSS, yet it showed a significant transcriptional activity in all cell lines (Figure 7B). A significant loss of activity was observed with construct # 8, suggesting that promoter P1 is located between positions −5601 and −5827, while the binding sites for regulatory factors reside between positions −5827 and −7500.
The deletion of sequences from P2 segment were created by PCR using forward primers F16, F17, F18, F19 and F20, and the reverse primer R11, located at +188 (Figure 8). A measurable promoter activity was detected in all constructs used for the reporter assay. However, the deletion of the segment from −1839 to −341 led to a significant increase in the activity, indicating the presence of repressor sequences. These data suggest the location of the minimal promoter between nucleotides −341 and +188 (Figure 8).
3.9. Similarity of 5′ genomic DNA sequence of human GluR6 with rat and mouse
The human sequence shares 96.05% and 95.86% identity with rat and mouse GluR6 mRNA, respectively. While the human gene maps to chromosome 6q16.3-q21, the mouse and rat sequences localize to chromosomes 10 and 8, respectively. The sequence of the human promoter P2 spanning from −889 to +203 was found in rat and its shorter version from −771 to +203 was similar to the mouse sequence. However, the human DNA sequence from −7266 to −7722, which lacks most of the promoter region and regulatory elements, was homologous to corresponding sequences in rat and mouse. The region of the human DNA from −5691 to −5107, encompassing a part of exon 1 and the junction of this exon with its cognate intron, has similarity with only the rat sequence. These results suggest that mouse and rat exclusively use promoter P2, which functions in human brain.
4. DISCUSSION
We present here the first report of two novel spliced variants GluR6D and GluR6E of kainate glutamate receptor subunit GluR6 in human fibroblast cells. Among the five variants, GluR6A is specifically expressed in brain cells, while B, C, D and E variants of GluR6 were abundantly transcribed in the fibroblasts. While variants A, B and C have been previously described ([Barbon et al., 2001] and [Barbon et al., 2008]), we have demonstrated GluR6D and GluR6E as two additional novel variants expressed in non-neuronal cells. All five variants share an identical N-terminus, but they have distinct C-termini of varying lengths. In addition, variants D and E lack three transmembrane domains.
The interaction of GluR6A with PSD95 protein (Savinainen et al., 2001) and the reported regulation of GluR6 trafficking by its C-terminus (Yan et al., 2004) suggest that intracellular trafficking leading up to the deposition of GluR6 on the cell surface and their interactions with other proteins may be quite different for various forms of this membrane protein. In fact, low levels of plasma membrane GluR6B may be attributed to its inefficient trafficking (Coussen and Mulle, 2006). Additional biological importance of the C-terminus is illustrated by the presence of SUMOylation motif YKXE at the carboxyl end of GluR6A and its ability to regulate endocytosis and synaptic transmission (Martin et al., 2007). The presence of serine residues in the C-termini of GluR6 variants may likely serve as targets of kinases. Although the absence of three transmembrane domains is unique for variants D and E, the lack of some transmembrane domain(s) for chick GluR4 (Ravindranathan et al., 1997) and GluR6 of NT2 cells (Coussen et al., 2002) has also been reported.
The expression of B, C, D and E variants of GluR6 in fibroblasts, wherein the channel function of GluR6 is not obvious, suggests non-channel role of this protein in these cells. This non-channel role is further strengthened by the observation that D and E variants lack the three channel forming transmembrane domains. The co-localization of GluR6 with cadherin and catenin complexes in non-neuronal cells (Coussen et al., 2002) supports the role of GluR6 in cell adhesion. It has also been considered a candidate tumor suppressor gene based on an amino acid substitution in GluR6 gene in an acute lymphocytic leukemia patient (Sinclair et al., 2004). A complex interplay of GluR6 in non-channel functions is also suggested by its involvement in signal transduction events. It has been linked to the activation of JNK pathway and neuronal apoptosis ([Yang et al., 1997] and [Mulle et al., 1998]), induction of c-Jun and c-Fos (Yang et al., 1997), interaction with PSD95 ([Savinainen et al., 2001] and [Garcia et al., 1998]) leading to its anchoring with the mixed lineage kinases MLK2 and MLK3 (Savinainen et al., 2001), and association with SAP family of proteins (Mehta et al., 2001).
We have addressed the differential expression of GluR6 variants in neuronal and non-neuronal cells by in silico and experimental characterization of a genomic sequence of ~8Kb as gene promoter. In silico analyses allowed us to classify this genomic fragment into two regions distinguished by the presence of CpG islands. These regions also contain sequence motifs predicted to bind factors such as SP1, NFκB, C-Rel, Elf-1, p300, AP4/AP3, HiNF-C and RAR-α (region I) and SP1, NFkB, C/EBP, GCF, RARα1 and IRF1 (region II). The absence of TATA and CAAT sequences, the hallmarks of a generic promoter, in both these regions is similar to the characteristic TATA-less promoters found in other kainate receptors (Myers et al., 1999). The predicted motifs for SP1 binding and the lack of silencer sequences RE1/NRSE in regions I and II are similar to features observed in KA2 promoter (Myers et al., 1999). These two regions were independently capable of initiating the transcription of luciferase gene in a reporter assay, and we initially designated them as P1 and P2, respectively.
Our results clearly demonstrate that these two promoters function in a tissue specific manner. While P1 is active in fibroblasts, its activity is turned off in brain. P2 promoter, on the other hand, actively transcribes the gene in brain only. Based on these results, we have designated P1 and P2 as non-neuronal promoter PNN and neuronal promoter PN, respectively. It is noteworthy that the reporter assay revealed remarkably high activity of the neuronal promoter PN in astrocytoma cell line U87MG, suggesting the presence of relevant transcription factor(s) in these cells. The alignment of human promoter with mouse and rat genomes revealed similarity of PN sequences in rat and mouse genomes. However, the sequence of human PNN was significantly different from the mouse and rat sequences. Furthermore, none of the mouse and rat GluR6 cDNA entries in databases appeared to be transcribed by PNN promoter, suggesting species-specific and non-neural utilization of this promoter.
Despite the importance of GluR6 channels in neuronal cells and its involvement in signal transduction pathways, we know very little about its expression and function in non-neural cells. The characterization of two cell-type specific promoters and expression of novel splice variants in fibroblasts have set the stage for further investigations on transcriptional regulation of GluR6 gene. These results can now be confirmed by performing chromatin immunoprecipitation (ChIP) experiments for the binding of specific transcription factors and/or other regulatory proteins to PN and PNN promoters in brain and fibroblast cells. We speculate that repressor and activator proteins in specific cell/tissue types regulate the expression of GluR6 variants via PN and PNN promoters. The presence of two GluR6 promoters with tissue specific activities is in conformity with the role of glutamate as a neurotransmitter in the central nervous system and as a signal modulator in peripheral tissues.
Acknowledgments
This work was supported in part by grants from National Institute of Health (CA74983), US Army Breast Cancer Research Program (DAMD17-99-1-9393 and DAMD17-02-1-0574), Susan G. Komen Breast Cancer Foundation (BCTR9830 and BCTR1092) to RSA and Department of Defense (DAMD17-99-9394) to RPK.
Footnotes
Publisher's Disclaimer: This is a PDF file of an unedited manuscript that has been accepted for publication. As a service to our customers we are providing this early version of the manuscript. The manuscript will undergo copyediting, typesetting, and review of the resulting proof before it is published in its final citable form. Please note that during the production process errors may be discovered which could affect the content, and all legal disclaimers that apply to the journal pertain.
References
- Bai G, Kusaik JW. Functional analysis of the proximal 5′-flanking region of the N-methyl-D-aspartate receptor subunit gene, NMDAR1. J Biol Chem. 1995;270:7737–7744. doi: 10.1074/jbc.270.13.7737. [DOI] [PubMed] [Google Scholar]
- Barbon A, Vallini I, Barlati S. Genomic organization of the human GRIK2 gene and evidence for multiple splicing variants. Gene. 2001;274:187–197. doi: 10.1016/s0378-1119(01)00611-4. [DOI] [PubMed] [Google Scholar]
- Barbon A, Gervasoni A, LaVia L, Orlandi C, Jaskolski F, Perrais D, Barlati S. Human GluR6c, a functional splicing variants of GluR6, is mainly expressed in non-nervous cells. Neurosci Lett. 2008;434:77–82. doi: 10.1016/j.neulet.2008.01.049. [DOI] [PubMed] [Google Scholar]
- Borges K, Dingledine R. AMPA receptors: molecular and functional diversity. Prog Brain Res. 1998;116:140–157. doi: 10.1016/s0079-6123(08)60436-7. [DOI] [PubMed] [Google Scholar]
- Coussen F, Mulle C. Kainate receptor-interacting proteins and membrane trafficking. Biochem Soc Trans. 2006;34:927–930. doi: 10.1042/BST0340927. [DOI] [PubMed] [Google Scholar]
- Coussen F, Normand E, Marchal C, Costet P, Choquet D, et al. Recruitment of the kainate receptor subunit glutamate receptor 6 by cadherin/catenin complexes. J Neurosci. 2002;22:6426–6436. doi: 10.1523/JNEUROSCI.22-15-06426.2002. [DOI] [PMC free article] [PubMed] [Google Scholar]
- Dingledine R, Borges K, Bowie D, Traynelis SF. The glutamate receptor ion channels. (1999) Pharmacological Reviews. 1999;51:7–61. [PubMed] [Google Scholar]
- Fogarty DJ, Perez-Cerda F, Matute C. KA1-like kainate receptor subunit immunoreactivity in neurons and glia using a novel anti-peptide antibody. Mol Brain Res. 2000;81:164–176. doi: 10.1016/s0169-328x(00)00179-0. [DOI] [PubMed] [Google Scholar]
- Garcia EP, Mehta S, Blair LA, Wells DG, Shang J, Fukushima T, Fallon JR, Garner CC, Marshall J. SAP90 binds and clusters kainate receptors causing incomplete desensitization (1998) Neuron. 1998;21:727–739. doi: 10.1016/s0896-6273(00)80590-5. [DOI] [PubMed] [Google Scholar]
- Herb A, Burnashev N, Werner P, Sakmann B, Wisden W, Seeburg PH. The KA-2 subunit of excitatory aminoacid receptor shows widespread expression in brain and forms ion channels with distantly related subunits. Neuron. 1992;8:775–785. doi: 10.1016/0896-6273(92)90098-x. [DOI] [PubMed] [Google Scholar]
- Hollmann M, Heinemann S. Cloned glutamate receptors. Ann Rev Neurosci. 1994;17:31–108. doi: 10.1146/annurev.ne.17.030194.000335. [DOI] [PubMed] [Google Scholar]
- Hoo KH, Nutt SL, Flecher EJ, Elliott CE, Korczak B, Deverill RM, Rampersad V, Fantaske RP, Kamboz RK. Functional expression and pharmacological characterization of the human EAA4 (GluR6) glutamate receptor: a kainate selective channel subunit. Recept Channels. 1994;2:327–337. [PubMed] [Google Scholar]
- Huang F, Gallo V. Gene structure of the rat kainate receptor subunit KA2 and characterization of an intronic negative regulatory region. J Biol Chem. 1997;272:8618–8627. doi: 10.1074/jbc.272.13.8618. [DOI] [PubMed] [Google Scholar]
- Kohler M, Kornau HC, Seeburg PH. The organization of the gene for the functionally dominant a-amino-3-hydroxy-5-methyl-isoxazole-4-propionic acid receptor subunit GluR-B. J Biol Chem. 1994;269:17367–17370. [PubMed] [Google Scholar]
- Lerma J. Ionotropic glutamate receptors in the CNS. In: Jonas P, Monyer H, editors. Handbook of Experimental Pharmacology. Vol. 141. Berlin: Springer; 1999. pp. 275–307. [Google Scholar]
- Martin S, Nishimune A, Mellor JR, Henley JM. SUMOylation regulates kainate-receptor-mediated synaptic transmission. Nature. 2007;447:321–325. doi: 10.1038/nature05736. [DOI] [PMC free article] [PubMed] [Google Scholar]
- Mehta S, Wu H, Garners CC, Marshall J. Molecular mechanism regulating the differential association of kainate receptor subunits with SAP90/PSD95 and SAP97. J Biol Chem. 2001;276:16092–16099. doi: 10.1074/jbc.M100643200. [DOI] [PubMed] [Google Scholar]
- Mulle C, Sailer A, Pérez-Otaño I, Dickinson-Anson H, Castillo PE, Bureau I, Maron C, Gage FH, Mann JR, Bettler B, Heinemann SF. Altered synaptic physiology and reduced susceptibility to kainate-induced seizures in GluR6-deficient mice. Nature. 1998;392:601–5. doi: 10.1038/33408. [DOI] [PubMed] [Google Scholar]
- Myers SJ, Peters J, Huang Y, Comer MB, Barthel F, Dingledine R. Transcriptional regulation of the GluR2 gene: Neural-specific expression, multiple promoters, and regulatory elements. J Neurosci. 1998;18:6723–6739. doi: 10.1523/JNEUROSCI.18-17-06723.1998. [DOI] [PMC free article] [PubMed] [Google Scholar]
- Myers SJ, Dingledine R, Borges K. Genetic regulation of glutamate receptor ion channels. Annu Rev Pharmacol Toxicol. 1999;39:221–241. doi: 10.1146/annurev.pharmtox.39.1.221. [DOI] [PubMed] [Google Scholar]
- Paschen W, Blackstone CD, Huganir RL, Ross CA. Human GluR6 kainate receptor (GRIK2): Molecular cloning, expression, polymorphism, and chromosomal assignment. Genomics. 1994;20:435–440. doi: 10.1006/geno.1994.1198. [DOI] [PubMed] [Google Scholar]
- Ravindranathan A, Parks TN, Rao SM. New isoforms of the chick glutamate receptor subunit GluR4: molecular cloning, regional expression and developmental analysis. Mol Brain Res. 1997;50:143–153. doi: 10.1016/s0169-328x(97)00179-4. [DOI] [PubMed] [Google Scholar]
- Sasner M, Buonanno A. Distinct N-methyl-D-aspartate receptor 2B subunit gene sequences confer neural and developmental specific expression. J Biol Chem. 1996;271:21316–21332. doi: 10.1074/jbc.271.35.21316. [DOI] [PubMed] [Google Scholar]
- Savinainen A, Garcia EP, Dorow D, Marshall J, Lin YF. Kainate receptor activation induces mixed lineage kinase-mediated cellular signaling cascades via Post-synaptic Density Protein 95. J Biol Chem. 2001;276:11382–11386. doi: 10.1074/jbc.M100190200. [DOI] [PubMed] [Google Scholar]
- Sinclair PB, Sorour A, Martineau M, Harrison CJ, Mitchell WA, O’Neill E, Foroni L. A fluorescence in situ hybridization map of 6q deletions in acute lymphocytic leukemia: identification and analysis of a candidate tumor suppressor gene. Cancer Res. 2004;64:4089–4098. doi: 10.1158/0008-5472.CAN-03-1871. [DOI] [PubMed] [Google Scholar]
- Suchanek B, Seeburg PH, Sprengel R. Gene structure of the murine N-methyl-D-aspartate receptor subunit NR2C. J Biol Chem. 1995;270:41–44. doi: 10.1074/jbc.270.1.41. [DOI] [PubMed] [Google Scholar]
- Tanabe Y, Masu M, Ishii T, Shigemoto R, Nakanishi S. A family of metabotropic glutamate receptors. Neuron. 1992;8:169–179. doi: 10.1016/0896-6273(92)90118-w. [DOI] [PubMed] [Google Scholar]
- Yan S, Sanders JM, Xu J, Zhu Y, Contractor A, Swanson GT. A C-terminal determinant of GluR6 kainate receptor trafficking. J Neurosci. 2004;24:679–691. doi: 10.1523/JNEUROSCI.4985-03.2004. [DOI] [PMC free article] [PubMed] [Google Scholar]
- Yang DD, Kuan CY, Whitmarsh AJ, Rincon M, Zheng TS, Davis RJ, Rakic P, Flavell RA. Absence of excitotoxicity-induced apoptosis in the hippocampus of mice lacking the jnk3 gene. Nature. 1997;389:865–870. doi: 10.1038/39899. [DOI] [PubMed] [Google Scholar]


