

Abstract
Tasks that demand externalized attention reliably suppress default network activity while activating the dorsal attention network. These networks have an intrinsic competitive relationship; activation of one suppresses activity of the other. Consequently, many assume that default network activity is suppressed during goal-directed cognition. We challenge this assumption in an fMRI study of planning. Recent studies link default network activity with internally focused cognition, such as imagining personal future events, suggesting a role in autobiographical planning. However, it is unclear how goal-directed cognition with an internal focus is mediated by these opposing networks. A third anatomically interposed ‘frontoparietal control network’ might mediate planning across domains, flexibly coupling with either the default or dorsal attention network in support of internally versus externally focused goal-directed cognition, respectively. We tested this hypothesis by comparing brain activity during autobiographical versus visuospatial planning. Autobiographical planning engaged the default network, whereas visuospatial planning engaged the dorsal attention network, consistent with the anti-correlated domains of internalized and externalized cognition. Critically, both planning tasks engaged the frontoparietal control network. Task-related activation of these three networks was anatomically consistent with independently defined resting-state functional connectivity MRI maps. Together, our findings suggest that the default network can be involved in goal-directed cognition when its activity is coupled with the frontoparietal control network. Additionally, the frontoparietal control network may flexibly couple with the default and dorsal attention networks according to task domain, serving as a cortical mediator linking the two networks in support of goal-directed cognitive processes.
Keywords: Default mode, cognitive control, planning, autobiographical, fMRI, Tower of London, functional connectivity
The default network comprises a set of interconnected brain regions, including medial prefrontal cortex (MPFC), posterior cingulate cortex (PCC), lateral and medial temporal lobes, and posterior inferior parietal lobule (pIPL), that are suppressed during tasks that demand externalized attention (Buckner et al., 2008; Gusnard and Raichle, 2001; Laird et al., 2009; Shulman et al., 1997). When the concept of the default mode of brain function was introduced (Raichle, et al., 2001), decreases in brain activity were observed relative to specific attention-demanding visual tasks (Shulman et al., 1997) that were broadly defined as “goal-directed”. Subsequent interpretations have asserted that the default network is deactivated by, uninvolved in, or even antithetical to, goal-directed behavior (c.f. Carhart-Harris and Friston, 2010; Kelly et al., 2008; Park et al., 2010; Shipman and Astur, 2008; Sigman et al., 2005; Sonuga-Barke and Castellanos, 2007; Thomason et al., 2008; Tosoni et al., 2008; see Supplemental Material). However, the default network is not solely characterized by patterns of deactivation; it is also activated by cognitive processes that are internally focused, such as “mind wandering” (Christoff et al., 2009; Mason et al., 2007), self-reference, (D'Argembeau et al., 2005; Gusnard et al., 2001), and recollecting one’s past or imagining one’s personal future (Schacter et al., 2007; Spreng et al., 2009). These cognitive processes, however, are often spontaneous, unconstrained, and not goal-directed, and therefore the observation that they are associated with increased default network activity is still generally consistent with the widely shared view that the default network does not contribute to goal-directed cognitive processes.
Externally focused attention reliably engages the ‘dorsal attention network’, consisting of dorsolateral prefrontal cortex (DLPFC), frontal eye fields (FEF), inferior precentral sulcus (iPCS), middle temporal motion complex (MT+) and superior parietal lobule (SPL) (Fox et al., 2005). Default and dorsal attention network activity are robust and ubiquitous across cognitive neuroimaging studies (Toro et al., 2008). These two networks have an intrinsic competitive relationship (Kelly et al., 2008) described as “anticorrelated” (Fox et al., 2005): engagement of one network suppresses activity of the other (McKiernan et al., 2003). Consequently, many assume that default network activity is suppressed during goal-directed cognition. This view, however, confounds externalized attention with goal-directed cognition.
Planning for one’s personal future involves both internally-focused cognition (i.e., imagining future experiences) and goal-directed cognition (i.e., problem-solving to attain personal goals; Schacter et al., 2008). In view of the preceding discussion, it is unclear how goal-directed cognition with an internal or self-relevant focus could be mediated by two anticorrelated networks. One possibility is that a third ‘frontoparietal control network’ facilitates functional interplay between them. Components of this network have been studied in the context of cognitive control (Badre and D'Esposito, 2009; Koechlin et al., 1999; Cabeza et al., 2008; Corbetta et al., 2008), and it has been anatomically characterized using resting-state functional connectivity analyses of MRI data (rsfcMRI) (Vincent et al., 2008). The frontoparietal control network, composed of rostrolateral prefrontal cortex (RLPFC), middle frontal gyrus (MFG), anterior insula/frontal operculum (aIfO), dorsal anterior cingulate cortex (dACC), precuneus (PCu), and anterior inferior parietal lobule (aIPL), is anatomically interposed between the default and dorsal attention networks (Vincent et al., 2008). By virtue of its involvement in memory and attention, and its anatomical location, we hypothesized that the frontoparietal control network would coactivate with either the default or the dorsal attention network during goal-oriented cognition.
To test this hypothesis, we examined patterns of brain activation during performance of a novel autobiographical planning paradigm versus during a well-characterized test of visuospatial planning. We expected, based on studies of imagining future events (Addis et al., 2009; Addis et al., 2007; Okuda et al., 2003; Szpunar et al., 2007), that autobiographical planning would engage the default network. We also expected based on prior studies, that visuospatial planning would engage the dorsal attention network (Baker et al., 1996; Morris et al., 1993; Newman et al., 2003). Critically, we predicted that the frontoparietal control network would be engaged for all goal-directed planning, independent of task domain.
Material and Methods
Participants
Participants were 20 healthy, right-handed, young adults (mean age = 21.3, SD = 3.2; range = 18–29; 17 women), with normal or corrected-to-normal visual acuity, and no history of psychiatric, neurological, or other medical illness that could compromise cognitive functions. All participants were paid for, and gave written informed consent prior to, participation, in accordance with the guidelines of the Committee on the Use of Human Subjects in Research at Harvard University and the Human Subjects Research Committee at Massachusetts General Hospital.
Tasks
The Tower of London task is a neuropsychological measure of planning, originally devised as a measure of frontal lobe dysfunction (Shallice, 1982). It has since been modified for use in neuroimaging studies (Baker et al., 1996) to examine the neural correlates of visuospatial planning in vivo. Like many cognitive tasks that require focused attention on the external environment, solving a Tower of London puzzle engages a set of regions known as the dorsal attention network (Baker et al., 1996; Morris et al., 1993; Newman et al., 2003). Participants were presented with two configurations on a single screen: the “initial” and “goal” positions. Both configurations consisted of three colored discs (labeled “Disc A”, “Disc B” and “Disc C”) placed on three vertical rods of different heights. See Figure 1. The first rod can hold all three discs, the second two, and the third rod only one. The objective is to determine the minimum number of moves it takes to match the configuration of the goal. Only one disc can be moved at a time when there are no other discs on top of it. Sometimes counterintuitive moves are necessary to reach the goal. Participants pressed a button once they determined the lowest number of moves. Participants were presented with five 3-move, six 4-move, nine 5-move, seven 6-move and three 7-move puzzles.
Figure 1.

Task Stimuli. For the visuospatial planning condition, participants performed the Tower of London task. In this condition participants saw the goal configuration for 5 seconds, then the start configuration for a maximum of 15 seconds, and determined the minimum number of moves to match the start with the goal configuration. Participants then indicated the minimum number of moves to solve the puzzle. In the autobiographical planning task condition, participants were presented with a goal state, followed by a combination of two steps and an obstacle related to that goal printed in the discs. Participants integrated the steps and obstacle into an authentic and coherent personal plan to reach that goal. In this example, participants interpreted the goal state “Freedom from Debt” for 5 seconds. For up to 15 seconds, participants integrated the steps “Good job”, “Save Money” as well as the obstacle “Have Fun” into a plan to be free of debt. Next, participants rated the level of detail in their plan. In the Count condition, participants were informed they would count vowels, then random letter sequences appeared in the discs. Next, participants indicated the number of vowels counted. If participants completed any of the tasks prior to 15 seconds, a button was pressed and the screen advanced to the rating screen. Remaining time was added to the inter-trial interval.
The second task of planning was designed to engage the default network, which has been observed to be active when participants engage in self-referential thought (D'Argembeau et al., 2005; Gusnard et al., 2001) and imagine their personal futures (Addis et al., 2009; Addis et al., 2007; Okuda et al., 2003; Spreng and Grady, 2010; Szpunar et al., 2007). For this reason, we designed the autobiographical planning task to be as experimentally matched as possible to the Tower of London, both of which involve the goal-directed integration of information over time. However, whereas the Tower of London involves externalized attention to a visually presented stimulus, the autobiographical planning task involves externally cued attention to internalized self-referential processes.
Performing the autobiographical planning task involves planning for real-world personal goals. To establish the validity of the target goals and cued planning stages, we collected behavioral data from an independent sample of 20 adults matched in age and education (t’s < 1) to the scanned group. These participants generated an exhaustive list of life goals, indicated up to five steps necessary to complete each goal, and up to five foreseeable obstacles to fulfilling them. For example, all participants indicated academic success in the current term as a goal. Participants reliably reported three steps to complete this goal: a) study, b) do well on tests, and c) attend class. Reported obstacles were a) poor previous performance and b) limited time. Forty goals with the necessary steps and potential obstacles were determined to be reliable from our initial sample (e.g., freedom from debt, traveling, getting married). These goals were then adapted to serve as stimulus sets for autobiographical planning task goal states and planning cues (10 practice, 30 fMRI scanning).
In the experiment, participants saw the goal on the bottom of the screen followed by a display of the “initial” position in the planning sequence on the top of the screen. The initial position was a presentation of cue words within the Tower of London discs representing the steps and obstacles involved in accomplishing the goal. See Figure 1. Participants engaged in autobiographical plan formation by sequencing the information in the “initial” position into a coherent narrative (i.e., devising a means to personally achieve the goal), and pressed a button upon generation of an authentic personal plan to reach the goal that incorporated the steps and obstacles. Next, participants were directed to rate the level of detail in their plan on a scale of 1-to-4 (none, some, moderate, high). Unlike the Tower of London, there is no single objectively correct solution for the autobiographical planning task problems. Therefore, reliable performance was developed through a) piloting instructions and monitoring verbal protocols of pilot participants, b) pre-scan training and c) post-scan verification of compliance.
In both the autobiographical planning and Tower of London tasks, the goal state was provided. To complete the task, participants formed a plan while mentally manipulating and ordering information online. Organization of information to attain the goal in both tasks involves recognition of the current state and planning the intervening stages (“movement” of the discs/sequencing of steps). However, the Tower of London involves non-personal visuospatial planning, whereas the autobiographical planning task involves planning of one’s personal future.
For a comparison condition, we used a counting task adapted from previous studies of both autobiographical memory (Maguire and Frith, 2003; Maguire and Mummery, 1999; Maguire et al., 2000) and the Tower of London (van den Huevel et al., 2003; Wagner et al., 2006). In this condition, the goal state was replaced with the instruction to count vowels, followed by the appearance of random letter sequences in the discs during the execution phase. Six letters filled each of the 6 discs, with a 40% probability of any one letter being a vowel. See Figure 1.
Prior to scanning, the rules and procedure of the Tower of London, autobiographical planning, and counting tasks were learned through practice sessions. Participants were scanned in an event-related design during the pseudo-random presentation of autobiographical planning, Tower of London, and counting trials in 5 experimental runs (run duration = 8m 45s). Each run consisted of 18 trials, 6 from each condition. For each trial, the start position was presented by itself for 5s to orient the participant to the goal. The goal position and the initial position were then paired in the self-paced execution phase of the trial for a maximum of 15s. Participants then had 5s to make a button press response indicating a multiple choice selection for the extent of detail to their autobiographical plan, the minimum number of moves to solve the Tower of London task, or the number of vowels counted. After the scan, participants were interviewed about their autobiographical goals to establish compliance with the task. Estimated time to goal completion (i.e. approximate calendar date) was determined for each goal. Additionally each goal was rated on a scale of 1–4 for novelty (I have thought about this goal a lot/I have never thought about this goal before now), difficulty in making a plan (It was easy to plan this goal/It was very hard to plan this goal) and difficulty to actually fulfill the goal (This goal will be easy to fulfill/This goal will be very hard to fulfill).
MRI Data Collection and Preprocessing
Brain imaging data were acquired with a 3.0T Siemens TimTrio MRI scanner with a 12-channel phased-array whole-head coil. Anatomical scans were acquired using a T1-weighted volumetric MRI (TR = 2530ms; TE = 3.44ms; 7° flip angle; 1.33 mm isotropic voxels). One fixation and five experimental runs of blood-oxygen-level-dependent (BOLD) functional scans were acquired with a T2*-weighted EPI pulse sequence (TR = 2500 ms; TE = 30 ms; 90° flip angle; 36 axial slices parallel to plane of the anterior commissure–posterior commissure; 3.0 mm isotropic voxels with a 0.48 mm gap between slices). Cushions and clamps were used to minimize head movement during scanning.
All fMRI data were preprocessed using SPM2 (Wellcome Department of Cognitive Neurology, London, UK). The first 4 volumes in each run were excluded from analyses to allow for T1-equilibration effects. Data were corrected for slice-dependent time shifts and for head motion within and across runs using a rigid body correction. Images were then spatially normalized to the standard space of the Montreal Neurological Institute (MNI) atlas, yielding a volumetric time series resampled at 2mm cubic voxels.
We used spatiotemporal Partial Least Squares (PLS; McIntosh et al., 1996; McIntosh et al., 2004a) to analyze task-related brain activation (see below). For the PLS analysis, neuroimages from the 5 experimental runs were then spatially smoothed with a Gaussian kernel with a full width at half maximum (FWHM) of 6 mm. For the rsfcMRI analysis, the fixation run (duration = 5m 40s) scanned prior to the experimental runs was subjected to additional processing steps, as described previously (Fox et al., 2005; Vincent et al., 2006). First, a temporal band-pass filter was applied to the atlas-aligned BOLD data, retaining signal within the frequency range of 0.009 – 0.08 Hz. Data were then spatially smoothed with a Gaussian kernel, FWHM = 6 mm. Then, sources of variance of non-interest were removed from the data by regression of nuisance variables (in addition to first temporal derivatives of each), including: the six motion parameters obtained during the motion correction procedure; the mean signal from the lateral ventricles; the mean signal from a region within the deep cerebral white matter; and the mean whole-brain signal. The ventricles and white matter contain a relatively high proportion of noise caused by the cardiac and respiratory cycles; furthermore, physiological sources of noise are assumed to cause the same pattern of activity over time in affected voxels of the brain (see Van Dijk et al., 2010). Regressing out cerebral spinal fluid, white matter, and whole brain signal thus reduces the potential influence of these nuisance signals.
fMRI analysis
The analysis was conducted in five stages. In the first stage, task-based analyses were performed using the multivariate technique partial least squares (PLS), which is highly sensitive to distributed network activity (McIntosh et al., 2004b). PLS determines a set of orthogonal latent variables that optimally relate BOLD signal and the experimental design. The statistical significance of the detected patterns is assessed through permutation testing while the reliability is determined in an independent step by iterative bootstrap resampling with replacement. In the second stage, to assess whether the pattern of network activity during task performance was consistent with prior characterizations of relevant resting-state networks, we replicated the default, dorsal attention and frontoparietal control networks from a resting scan. These networks were identified using rsfcMRI, which detects patterns of low-frequency neural activity during rest. Correlation of spontaneous BOLD fluctuations in a given seed voxel or region with all other brain voxels reveals distinct and dissociable functional-anatomic networks (Biswal et al., 1995; Fox and Raichle, 2007; Vincent et al., 2008).
In the third stage, an a priori network ROI analysis, using independently defined network ROIs based on rsfcMRI analyses of independent data, was employed to determine the strength, reliability, and specificity of the task-based activation of the three networks from the PLS analysis; a complementary univariate ROI analysis of task-related percent BOLD signal change within these resting-state network ROIs was conducted as well. In the fourth stage, we assessed whether the activity of the default and dorsal attention networks were coupled with frontoparietal control network activity during the planning tasks in three analyses: (a) the correspondence of the temporal brain scores from the PLS analysis was examined; (b) we calculated the correlation of the BOLD signal time course between the default and dorsal attention networks with the frontoparietal control networks, as defined by the rsfcMRI maps, during the planning tasks; and (c) we performed a dedicated analysis of task-related functional connectivity using “seed” PLS (McIntosh, 1999). In the fifth and final stage of the analysis, in order to rule out the possibility that differences between planning and counting conditions were due to task difficulty, a second PLS analysis was performed to explicitly examine the effects of planning difficulty by subdividing both the autobiographical planning and Tower of London task conditions into easy and difficult trials.
1. Partial Least Squares
Spatiotemporal PLS is a multivariate functional neuroimaging analysis tool designed to identify whole brain patterns of activity that are correlated with tasks. PLS is a robustly validated (McIntosh et al., 1996; McIntosh et al., 2004a) and widely used analysis technique (e.g. Addis et al., 2004; Addis et al., 2009; McIntosh et al., 1999; Spreng and Grady, 2010; Stevens et al., 2008) that is sensitive to a distributed voxel response rather than the activity of individual voxels per se. PLS assesses the covariance between brain voxels (BOLD signal) and the experimental design to identify a limited number of orthogonal components (Latent Variables, LVs) that optimally relate the two. This data-driven approach is similar to independent component analysis in that it determines orthogonal whole brain patterns of activity. Unlike independent component analysis, the number of latent structures is constrained by the experimental conditions. Unlike standard univariate analyses that examine the activity of any single voxel independently, PLS detects brain-wide systems that covary with the experimental design.
Activity at each time point, relative to trial onset, for each voxel is averaged across trials of a given condition and normalized to activity in the first TR of the trial and the data matrix is then expressed as voxel-by-voxel deviation from the grand mean across the entire experiment. This matrix is then analyzed with singular value decomposition to derive the optimal effects in the data. Here, we applied PLS analysis to event-related fMRI data and the results provide a set of brain regions wherein activity is reliably related to the task conditions at 10 post-stimulus time points (i.e., 10 TRs = 25 s) for each LV. Each brain voxel is given a singular value weight, known as a salience (akin to a component loading in principle components analysis), which is proportional to the covariance of activity with the task contrast at each time point on each LV. Multiplying the salience by the BOLD signal value in that voxel and summing the product across all voxels gives a brain score for each participant for each time point on a given LV (like a component score in principal components analysis). These scores can be used to examine differences in brain activity across conditions, as greater activity in brain areas with positive (or negative) weights on a latent variable will yield positive (or negative) mean scores for a given condition over each time point.
The significance of each LV as a whole is determined by permutation testing, using 500 permutations. In a second, independent step, the reliability of the saliences for the brain voxels across subjects, characterizing each pattern identified by a LV, is determined by bootstrap resampling, using 100 iterations, to estimate the standard errors for each voxel. Clusters larger than 100 mm3 comprising voxels with a ratio of the salience to the bootstrap standard error values (i.e., the “bootstrap ratio”; BSR) greater than 4 (p < .0001) were reported. The local maximum for each cluster was defined as the voxel with a BSR higher than any other voxel in a 2-cm cube centered on that voxel. PLS identifies whole brain patterns of activity in a single analytic step, thus, no correction for multiple comparisons is required. Although most brain regions showed reliable activations across multiple time points (see temporal brain score plots in Figures 2C and 3C), results report the BSR for the sixth TR (i.e., 12.5 s after the start screen in the planning conditions and the presentation of the random letter sequences in the count condition) as a representative index of brain activity in time. See Supplemental Movies 1 and 2 for whole brain results at each TR.
Figure 2.

Task-related brain activity in default and dorsal attention networks dissociated the planning tasks. (A) Activity associated with autobiographical planning (Blue) and visuospatial planning (Red) at TR 6 (17.5 s). Real-time patterns of activation at each TR associated with planning are available as Supplemental Movies 1 and 2. Data are displayed on the dorsal, lateral, medial, and ventral surfaces of the left and right hemispheres of a partially inflated surface map using CARET software (Van Essen, 2005). (B) Design scores for each condition represent the optimal contrast weightings that explain the most task-related variance in BOLD signal. Autobiographical planning was maximally dissociated from visuospatial planning. Counting activity covaried across the same regions as visuospatial planning, although significantly less so. (C) Temporal brain scores convey changes in brain activity related to task at each TR. For each LV, mean brain scores (summary scores of activity across the entire brain of each participant, averaged across participants) show the divergence between experimental conditions over time (Ten 2.5s TRs), and are analogous to hemodynamic response functions typically plotted for individual brain regions.
Figure 3.

Task-related brain activity in frontoparietal control network is common to both planning tasks. (A) Activity associated with both planning tasks (Green) at TR 6 (17.5 s). The design scores (B) and temporal brain scores (C) dissociate both autobiographical and visuospatial planning from counting. Real-time patterns of activation at each TR associated with planning are available as Supplemental Movies 1 and 2.
2. Resting-state functional connectivity MRI
In the rsfcMRI analysis, we replicated the default, dorsal attention and frontoparietal control networks following previously established methods (Vincent et al., 2008). Two left hemisphere seed ROIs were defined a priori, based on Vincent et al. (2008) and used to produce each of the three networks: For the default network, hippocampal formation (HF; −22 −22 −22) and pIPL (−47 −71 29); for the dorsal attention network, MT+ (−48 −70 0) and SPL (−27 −52 57); and for the frontoparietal control network, RLPFC (−36 57 9) and aIPL (−52 −49 47). For each participant, the mean BOLD signal time course was extracted from each of the six spherical ROIs, centered on the foregoing coordinates, with a radius of 8mm. The correlation coefficient for each of these time courses with the time course for every voxel in the brain was computed using Pearson’s product-moment formula. These values were then converted to z-values using Fisher’s r-to-z transformation (Zar, 1996). Whole-brain voxel-wise z’-maps were then subjected to random-effects analyses to assess statistical significance across participants at the group level using t-tests performed in SPM2 (threshold p < 0.01). We then derived conjunction maps for each network where only those voxels that were significant in both t-maps (one map for each of the 2 ROIs for each network) were retained.
3. Network ROI Analysis
We quantitatively assessed the degree to which the tasks differentially engaged the three networks as defined by the rsfcMRI analysis in three additional analyses. Using each of the three resting-state networks (i.e., default, dorsal attention, frontoparietal control) as a priori ROIs, we extracted the salience and BSR values of each voxel from the PLS results images. Additionally, we extracted the task-related percent BOLD signal change within each network, during each task.
3a. Network ROI Analysis – Salience
We extracted all non-negative salience values that were positively associated with the planning tasks as described above. Planned t-tests were then conducted on the mean salience values for the planning tasks independently within each network.
3b. Network ROI Analysis – BSR
To determine the reliability of differential engagement of the three networks by the planning tasks, we calculated the mean BSR values associated with the tasks within each of the three networks. The salience of a single voxel is considered reliable if its BSR value exceeds 1.96, which corresponds to the 95% confidence interval (p < .05; Sampson et al., 1989). Thus, to adopt a statistically conservative approach, activation of an entire network was considered to be reliable only if the mean BSR value for all voxels within that network was ≥ 1.96 (p < .05).
3c. Network ROI Analysis – BOLD
In a univariate ROI analysis, we assessed the mean task-related hemodynamic response within the three network ROIs. For each subject, the mean BOLD signal between 10 and 20 seconds post trial onset was calculated for both the autobiographical planning and Tower of London task conditions, relative to the counting condition, within each of the three networks. Six single sample t-tests were performed to determine significant differences in percent BOLD signal change from the counting baseline condition. Three additional paired-sample t-tests comparing percent BOLD signal change between autobiographical planning and the Tower of London task conditions were also conducted. Significance levels were adjusted for multiple comparisons using the Bonferroni correction (α = .05). To determine significant increases in percent BOLD signal change from trial onset (i.e. fixation), independent of the counting task, four a priori single sample t-tests were also performed. For the autobiographical planning task in the default network, Tower of London performance in the dorsal attention network and both planning tasks in the frontoparietal control network, each subject’s peak BOLD signal occurring between 10 and 20 seconds post trial onset was extracted.
4. Network Coupling
4a. Network Coupling – Brain Scores
In order to directly assess the possibility that the patterns of network co-activation, revealed in the initial PLS analysis, reflect the coupling of activity across networks, we examined the correlation of the PLS temporal brain scores across time between LV1 and LV2 for the planning conditions. We correlated the mean temporal brain scores for the entire group using Pearson’s r. Using Fisher’s r-to-z transform, we determined the reliability of these correlations within subjects in two single sample t-tests.
4b. Network Coupling – BOLD
Next we correlated the change in BOLD activity across time, from 2.5 to 25 seconds post-trial onset, during autobiographical planning and Tower of London trials, relative to counting, for the default and dorsal attention networks with that of the frontoparietal control network in each subject. Using Fisher’s r-to-z transform, we conducted a 2×2 repeated measures ANOVA with network (default vs. dorsal attention) and task (autobiographical planning vs. Tower of London) as within-subjects factors to assess differences in the magnitude of correlation of these networks with the frontoparietal control network across tasks. We predicted a network by task interaction. Simple main effects were adjusted for multiple comparisons using the Bonferroni correction (α = .05). Additionally, the reliability of the correlation magnitude between the frontoparietal control network and the default and dorsal attention networks, during both autobiographical and Tower of London conditions, was assessed in four single sample t-tests. We predicted a robust correlation between the frontoparietal control network and a) the default network during autobiographical planning, and b) the dorsal attention network during Tower of London task performance. Additionally, we also predicted no association between a) the frontoparietal control network and the dorsal attention network during autobiographical planning, and b) the frontoparietal control network and the default network during Tower of London performance.
We also examined the temporal correlations between the networks from fixation baseline, independent of counting, for the default and dorsal attention networks with that of the frontoparietal control network following the same procedure as above. Again, we predicted a network by task interaction, as well as robust correlations between the frontoparietal control network and a) the default network during autobiographical planning, and b) the dorsal attention network during Tower of London task performance. Additionally, we predicted no association between the frontoparietal control network and the default network during Tower of London performance. However, because we did not remove activity associated with the perceptual features of the tasks by examining activity relative to the counting condition, we predicted that the dorsal attention network would also be correlated with the frontoparietal control network during autobiographical planning, due to the need to attend to the visually presented information. However, we expected the magnitude of this correlation to be lower than the correlation between the frontoparietal control and default networks.
4c. Network Coupling – Task-related Functional Connectivity
Seed PLS is a multivariate task-related functional connectivity analysis technique used to investigate the relationship between the activity of a seed region and the activity in the rest of the brain (McIntosh, 1999). Using the mean network ROI BOLD values as seeds, we assessed the task-related functional connectivity of the default network and the dorsal attention network with the rest of the brain during the autobiographical planning and the Tower of London tasks, respectively. Individually defined peak network activity values were correlated with activity in all brain voxels, across participants. This matrix was then analyzed with singular value decomposition, assessed for statistical significance by permutation testing, and for reliability by bootstrap resampling, as described above. Using the resting-state networks as ROIs, we extracted the BSR values of each voxel from the seed PLS results images to quantitatively assess the differential task-related connectivity of the three networks.
Three criteria were required to conclude that the seed network was functionally coupled with the frontoparietal control network. First, covariance between the mean network seed value and the voxels comprising that seed network had to be reliable (i.e., network wide autocorrelation). Second, a pattern of connectivity of the seed value with the voxels comprising the frontoparietal control network also had to be reliable. Third, the default and dorsal attention networks could not be functionally connected with each other. We hypothesized that during autobiographical planning, mean BSR values from the default network seed PLS analysis would exceed 1.96 (p < .05) in the default and frontoparietal control networks, but not in the dorsal attention network. We further hypothesized that during Tower of London task performance, the mean BSR values from the dorsal attention network seed PLS would exceed 1.96 (p < .05) in the dorsal attention and frontoparietal control networks, but not in the default network.
5. Task Difficulty Analysis
In order to rule out the possibility that differences in task difficulty between the planning and counting tasks could account for differential engagement of the frontoparietal control network, we explicitly examined easy versus difficult planning trials. If difficulty could account for the difference in activity, we would expect greater engagement of the frontoparietal control network during difficult versus easy planning trials. In order to assess the role of task difficulty, autobiographical planning task and Tower of London trials were split into easy and difficult bins. Autobiographical planning task trials were sorted according to self-reported difficulty of making the plan while in the scanner by a within-subject median split. Easy versus difficult Tower of London trials were divided into those requiring three or four moves (easy) versus those requiring five, six or seven moves (difficult), respectively. This division of trials was selected based on a clear separation in error rates between the four and five move trials (see Supplementary Fig. 1). Additionally, counter-intuitive moves, where subjects where required to move the disc away from the final position before returning it, become prevalent in trials requiring five or more moves. Due to potentially confounding effects of differential RTs between easy and hard conditions, the data were analyzed as blocks of variable duration, determined by the button press response. This approach effectively eliminates the potential confound of RT differences. Block PLS analysis of fMRI data provides a set of brain regions wherein mean activity is reliably related to the task conditions for each LV. Similar to spatiotemporal PLS, the salience of each brain voxel is proportional to the covariance of activity with the task on each LV. Multiplying the salience by the BOLD signal value in that voxel and summing the product across all voxels gives a brain score for each participant on a given LV. These scores are then bootstrapped as previously described to examine reliable differences in brain activity across conditions. Two subjects were excluded from this analysis due to a lack of sufficient trials in one or more of the conditions (fewer than six).
Results
Behavioral Findings
Behavioral data, collected at the end of each trial as well as in a post-scan interview of autobiographical plans, confirmed participant compliance. Participants produced moderately detailed autobiographical plans in the time provided (mean detail rating = 2.9 (out of 4), SD = 0.9; mean RT = 14.22s, SD = 2.1). Nearly all plans had some amount of detail (95%, SD = 7%). In the post scan interview, we verified that participants had generated autobiographical plans. The median time to completion of goals was estimated to be 1 year with a range of 1 day to 60 years. The goals had been given some prior consideration by the participants (mean novelty = 2.1 (out of 4), SD = 1.0). Goals were evaluated to have been somewhat difficult to plan (scanner difficulty mean = 2.2 (out of 4), SD = 1.0) and fulfill (life difficulty mean = 2.5 (out of 4), SD = 1.0). In the Tower of London condition, participants correctly determined the minimum number of moves to solve the Tower of London task in a majority of the trials in the time provided (total mean accuracy = 63%, SD = 12%; mean RT = 12.71s, SD = 1.9). Accuracy rates for the Tower of London diminished in a step-wise fashion with each additional move required to reach the solution (F (4,95) = 21.34, p < .001; Supplementary Fig. 1). In the counting condition, participants accurately counted the number of vowels in the random letter sequences in the time provided (mean accuracy = 92%, SD = 10%; mean RT = 12.42s, SD = 2.0). There was a significant difference in RTs between conditions (F(2,59) = 4.60, p < .05), attributable to the fact that RTs in the autobiographical planning condition were significantly longer than in the counting condition. RTs for the Tower of London condition did not differ from RTs for either autobiographical planning task or counting.
fMRI Results
1. Partial Least Squares
A significant pattern of activity dissociated the two planning tasks (accounting for 72.7% of the covariance in the data; p = .002). Autobiographical planning task performance was associated with increased BOLD signal in default network regions. Conversely, Tower of London task performance was associated with increased BOLD signal in dorsal attention network regions. Activity associated with counting covaried within the same regions as for the Tower of London task, although significantly less so (See Fig. 2, Tables 1 and 2).
Table 1.
Activation peaks for Autobiographical Planning
| MNI coordinates | ||||||
|---|---|---|---|---|---|---|
| Lat | Region | BA | x | y | z | BSR |
| Autobiographical Planning > Visuospatial Planning | ||||||
| L | TP | 38 | −44 | 6 | −42 | −15.41 |
| L | IFG (orb) | 45 | −50 | 28 | −4 | −14.49 |
| B | MPFC | 9 | −8 | 58 | 14 | −13.72 |
| B | RSC | 29 | −10 | −34 | 8 | −13.67 |
| L | MTG | 21 | −52 | −6 | −20 | −11.26 |
| B | PCC | 31 | −6 | −54 | 22 | −11.07 |
| L | pIPL | 39 | −50 | −74 | 40 | −11.00 |
| L | HC | −30 | −12 | −22 | −10.33 | |
| B | VMPFC | 11 | −4 | 50 | −12 | −10.29 |
| R | pIPL | 39 | 56 | −68 | 36 | −10.10 |
| R | TP | 38 | 54 | 10 | −26 | −9.47 |
| R | HC | 28 | −12 | −24 | −9.31 | |
| L | CD | −10 | 14 | 14 | −8.87 | |
| R | IFG (tri) | 45 | 54 | 30 | −2 | −6.84 |
| L | SFG | 6 | −12 | 32 | 54 | −11.59 |
| R | HC | 32 | −44 | 4 | −10.76 | |
| L | IOG | 18 | −18 | −110 | 0 | −9.81 |
| R | Insula | 44 | −14 | 22 | −9.25 | |
| R | PCG | 4 | 16 | −30 | 66 | −7.97 |
| R | LG | 18 | 22 | −108 | 0 | −6.62 |
| L | PCG | 1 | −54 | −14 | 54 | −5.79 |
| R | STG | 22 | 72 | −36 | 8 | −5.78 |
| R | PCS | 4 | 52 | −12 | 40 | −5.64 |
| R | SFG | 8 | 14 | 38 | 52 | −5.45 |
Peak regions of activation. Lat = Laterality, B = Bilateral, L = Left, R = Right, BA = Brodmann’s Area, aIfO = Anterior insula/frontal operculum, aIPL = Anterior inferior parietal lobule, CALG = Calcarine gyrus, CD = Caudate, dACC = Dorsal anterior cingulate cortex, DLPFC = Dorsolateral prefrontal cortex, FEF = Frontal eye fields, HC = Hippocampus, IFG (orb) = Inferior frontal gyrus (orbitalis), IFG (tri) = Inferior frontal gyrus (triangularis), IFP = Inferior frontal pole, IOG = Inferior occipital gyrus, iPCS = Inferior precentral sulcus, LG = Lingual gyrus, LN = Lentiform nucleus, MCC = Middle cingulate cortex, MPFC = Medial prefrontal cortex, MT+ = Middle temporal motion complex, MTG = Middle temporal gyrus, PCC = Posterior cingulate cortex, PCG = Precentral gyrus, PCL = Paracentral lobule, PCS = Precentral sulcus, PCu = Precuneus, pIPL = Posterior inferior parietal lobule, preSMA = Pre-Supplementary motor area, RLPFC = Rostrolateral prefrontal cortex, RSC = Retrosplenial cortex, SFG = Superior frontal gyrus, SPL = Superior parietal lobule, Thal = Thalamus, TP = Temporal pole, VMPFC = Ventromedial prefrontal cortex. Locations of the maxima are reported in the stereotaxic coordinates of MNI space.
Table 2.
Activation peaks for Visuospatial Planning
| MNI coordinates | ||||||
|---|---|---|---|---|---|---|
| Lat | Region | BA | x | y | z | BSR |
| Visuospatial Planning > Autobiographical Planning | ||||||
| R | SPL | 40 | 42 | −44 | 54 | 16.82 |
| R | FEF | 6 | 26 | 8 | 60 | 15.30 |
| L | SPL | 7 | −26 | −66 | 46 | 13.50 |
| L | FEF | 6 | −24 | 6 | 56 | 12.64 |
| R | iPCS | 6 | 46 | 8 | 28 | 10.36 |
| L | iPCS | 6 | −40 | 4 | 28 | 8.04 |
| L | MT+ | 19 | −44 | −60 | −2 | 7.91 |
| R | MT+ | 19 | 42 | −78 | −4 | 7.26 |
| L | IOG | 18 | −28 | −72 | −12 | 6.60 |
| R | Thal | 10 | −10 | 4 | 12.78 | |
| L | aIfO | −32 | 16 | 6 | 10.93 | |
| R | aIfO | 30 | 24 | −8 | 10.41 | |
| R | preSMA | 6 | 6 | 28 | 42 | 8.13 |
| R | DLPFC | 9 | 46 | 42 | 22 | 8.05 |
| L | DLPFC | 9 | −40 | 36 | 24 | 6.55 |
| R | IFP | 10 | 18 | 40 | −16 | 4.67 |
| B | Vermis | −2 | −76 | −22 | 9.28 | |
| R | Pons | 6 | −24 | −26 | 7.51 | |
| L | CALG | 17 | −10 | −84 | 10 | 6.00 |
| B | MCC | 24 | 2 | 10 | 30 | 5.97 |
Peak regions of activation. Lat = Laterality, B = Bilateral, L = Left, R = Right, BA = Brodmann’s Area, aIfO = Anterior insula/frontal operculum, aIPL = Anterior inferior parietal lobule, CALG = Calcarine gyrus, CD = Caudate, dACC = Dorsal anterior cingulate cortex, DLPFC = Dorsolateral prefrontal cortex, FEF = Frontal eye fields, HC = Hippocampus, IFG (orb) = Inferior frontal gyrus (orbitalis), IFG (tri) = Inferior frontal gyrus (triangularis), IFP = Inferior frontal pole, IOG = Inferior occipital gyrus, iPCS = Inferior precentral sulcus, LG = Lingual gyrus, LN = Lentiform nucleus, MCC = Middle cingulate cortex, MPFC = Medial prefrontal cortex, MT+ = Middle temporal motion complex, MTG = Middle temporal gyrus, PCC = Posterior cingulate cortex, PCG = Precentral gyrus, PCL = Paracentral lobule, PCS = Precentral sulcus, PCu = Precuneus, pIPL = Posterior inferior parietal lobule, preSMA = Pre-Supplementary motor area, RLPFC = Rostrolateral prefrontal cortex, RSC = Retrosplenial cortex, SFG = Superior frontal gyrus, SPL = Superior parietal lobule, Thal = Thalamus, TP = Temporal pole, VMPFC = Ventromedial prefrontal cortex. Locations of the maxima are reported in the stereotaxic coordinates of MNI space.
A second significant pattern of activity, orthogonal to the first, dissociated the counting task from both planning tasks, for which activity covaried together (accounting for the remaining 27.3% of the covariance in the data; p = .004). The pattern of activity common to both planning tasks was consistent with the frontoparietal control network (Fig. 3, Table 3; for brain activity associated with counting see Supplemental Fig. 2 and Supplemental Table 1).
Table 3.
Activation peaks for planning
| MNI coordinates | ||||||
|---|---|---|---|---|---|---|
| Lat | Region | BA | x | y | z | BSR |
| Planning > Counting | ||||||
| B | PCu | 7 | −2 | −60 | 50 | 15.29 |
| L | MTG | 37 | −52 | −42 | −12 | 11.04 |
| L | SFG | 6 | −24 | 14 | 60 | 10.89 |
| L | DLPFC | 9 | −44 | 24 | 38 | 10.28 |
| L | aIPL | 39 | −40 | −56 | 44 | 9.05 |
| L | IFG (tri) | 45 | −50 | 26 | 8 | 8.40 |
| B | dACC | 6 | −4 | 22 | 52 | 8.04 |
| R | LN | 14 | 0 | 0 | 7.35 | |
| L | RLPFC | 10 | −32 | 58 | 4 | 7.32 |
| R | DLPFC | 8 | 40 | 28 | 40 | 7.24 |
| L | aIfO | −42 | 18 | −2 | 6.73 | |
| R | aIfO | 38 | 20 | −12 | 6.56 | |
| R | DLPFC | 9 | 36 | 50 | 34 | 5.87 |
| R | RLPFC | 10 | 28 | 56 | 0 | 5.82 |
| R | aIPL | 40 | 44 | −50 | 44 | 5.68 |
| R | CD | 16 | 6 | 16 | 5.67 | |
| L | CD | −12 | 4 | 18 | 5.62 | |
| R | RLPFC | 11 | 42 | 48 | −20 | 5.60 |
| L | LN | −16 | −4 | 4 | 6.94 | |
| L | TP | 38 | −48 | 18 | −28 | 5.20 |
Peak regions of activation. Lat = Laterality, B = Bilateral, L = Left, R = Right, BA = Brodmann’s Area, aIfO = Anterior insula/frontal operculum, aIPL = Anterior inferior parietal lobule, CALG = Calcarine gyrus, CD = Caudate, dACC = Dorsal anterior cingulate cortex, DLPFC = Dorsolateral prefrontal cortex, FEF = Frontal eye fields, HC = Hippocampus, IFG (orb) = Inferior frontal gyrus (orbitalis), IFG (tri) = Inferior frontal gyrus (triangularis), IFP = Inferior frontal pole, IOG = Inferior occipital gyrus, iPCS = Inferior precentral sulcus, LG = Lingual gyrus, LN = Lentiform nucleus, MCC = Middle cingulate cortex, MPFC = Medial prefrontal cortex, MT+ = Middle temporal motion complex, MTG = Middle temporal gyrus, PCC = Posterior cingulate cortex, PCG = Precentral gyrus, PCL = Paracentral lobule, PCS = Precentral sulcus, PCu = Precuneus, pIPL = Posterior inferior parietal lobule, preSMA = Pre-Supplementary motor area, RLPFC = Rostrolateral prefrontal cortex, RSC = Retrosplenial cortex, SFG = Superior frontal gyrus, SPL = Superior parietal lobule, Thal = Thalamus, TP = Temporal pole, VMPFC = Ventromedial prefrontal cortex. Locations of the maxima are reported in the stereotaxic coordinates of MNI space.
2. Resting-state functional connectivity MRI
A rsfcMRI analysis was conducted to confirm that, as identified by PLS, the planning tasks had indeed activated the three networks of interest previously identified by others (Vincent et al., 2008). We replicated the default, dorsal attention and frontoparietal control networks using the same seed regions (Fig. 4) and following the same methods as Vincent and colleagues (2008). The default network comprised MPFC, PCC, and bilateral medial temporal lobes, including hippocampus, lateral temporal lobe, inferior frontal gyrus (IFG) and pIPL. The dorsal attention network comprised right DLPFC, right supplementary motor area (SMA), and bilateral FEF, SPL, MT+, and insula. The frontoparietal control network comprised the PCu, dACC, and bilateral aIPL, RLPFC, DLPFC, and aIfO (Fig. 4).
Figure 4.

Resting-state functional connectivity analysis. Seed regions used to compute the correlation maps are shown to the left of the (A) default, (B) dorsal attention, and (C) frontoparietal control resting-state networks. Task salience is a measure of task-based activity in each resting-state network ROI. Y-axis = extracted mean voxel-salience (10−4) within each ROI from the first latent variable for the autobiographical and visuospatial planning tasks, and from the second latent variable for the conjunction of both planning tasks relative to counting. Task salience values quantitatively demonstrate that (A) the default network was primarily engaged by autobiographical planning, (B) the dorsal attention network was primarily engaged by visuospatial planning and, (C) the frontoparietal control network was primarily engaged by activity underlying both planning tasks. HF = Hippocampal formation; AB Plan = autobiographical planning; VS Plan = visuospatial planning; AB & VS Plan = activity common to both planning tasks.
These results confirm that the spatially distributed patterns of activation from the PLS analysis were markedly similar to the rsfcMRI analysis results (see PLS/rsfcMRI convergence images in Supplementary Fig. 3). Fig. 5 depicts the similarity of left lateral parietal lobe activity between autobiographical planning task performance, Tower of London task performance, and a conjunction of these two planning tasks with the default, dorsal attention, and frontoparietal control resting-state networks, respectively. Regions associated with the frontoparietal control network are interposed between regions associated with the default and dorsal attention networks in both sets of analyses. Overall, the spatially distributed patterns of the three networks are anatomically distinct. Modest overlap is observed between the frontoparietal control network and both the default and dorsal attention networks – to a greater extent in the task-related activation patterns. However, there is no overlap between the default and dorsal attention networks, consistent with prior observations (Fox et al., 2005).
Figure 5.

Lateral parietal view of the PLS and rsfcMRI results. Left parietal lobe activity for autobiographical planning, visuospatial planning and activity common to these two planning tasks (left); and the default, dorsal attention, and frontoparietal control resting-state networks (right). (A) pIPL activity in autobiographical planning subsumes the pIPL cluster in the default resting-state network. (B) Visuospatial planning engaged the same SPL-to-MT+ arc seen in the posterior portion of the dorsal attention network. (C) The two planning tasks commonly engaged a dorsal segment of the aIPL, part of the frontoparietal control network. (D) Overlap of all three networks for task-related activity and resting-state networks. Yellow represents overlap. The cluster ventral to the aIPL in the posterior middle temporal gyrus is suggestive of a concentric ring fitting within the posterior arc of the dorsal attention network. The pIPL region associated with the default network fills this ring. The rsfcMRI results do not mirror this concentric ring pattern, suggesting that it may be task specific. See also Supplemental Fig. 3 for whole brain convergence images of task activity and resting-state network maps.
There are, however, notable differences between the spatial extent of activation and the networks identified by rsfcMRI. There is greater lateral temporal and medial activity for autobiographical planning than the rsfcMRI map targeting the default mode network. Likewise, there are larger dorsolateral prefrontal clusters of activity during performance on the Tower of London task than identified in the dorsal attention network map. The pattern of activity for both planning tasks extended into visual cortex, outside of the frontoparietal control network identified by the rsfcMRI analysis. These differences may be the result of differing thresholds across independent analytic methods and/or reflect task specific recruitment of cortex outside of resting-state associations. In order to quantify the extent and degree of correspondence between the PLS results and rsfcMRI network, we conducted a series of network ROI analyses.
3. Network ROI Analysis
Beyond the foregoing qualitative assessment of similarities and differences, we quantified the extent of spatial overlap between the task-based activity and rsfcMRI results by using the three resting-state networks as independently defined a priori ROIs. To further clarify the PLS results, we extracted salience values and BSR from each voxel from the PLS results images.
3a. Network ROI Analysis – Salience
Mean salience values for all PLS images differed within each of the networks (all p’s < .001) in the predicted direction: Mean salience values associated with the planning tasks were significantly highest in 1) the default network for autobiographical planning task performance; 2) the dorsal attention network for Tower of London task performance; and 3) the frontoparietal control network for activity common to performing both planning tasks (Fig. 4: Task Salience).
3b. Network ROI Analysis – BSR
Next, we determined the reliability of engagement of each network by calculating the mean BSR. A reliable contribution for a voxel is defined as a BSR of 1.96, which corresponds to the 95% confidence interval (p < 0.05; Sampson et al., 1989). Critically, we found that the mean BSR exceeded this threshold in: 1) the default network only during autobiographical planning task performance (BSR = 4.54, SD = 2.4, p < .001), 2) the dorsal attention network only during Tower of London task performance (BSR = 3.99, SD = 2.9, p < .001), and 3) the frontoparietal control network only for activity common to performing both planning tasks (BSR = 3.00, SD = 1.9, p < .005). Unique activation associated with the autobiographical planning task did not reliably engage the dorsal attention network (BSR = 0.08, SD = 0.4, p = .94) or the frontoparietal control network (BSR = 1.04, SD = 1.7, p = .30). Unique activation associated with performing the Tower of London task did not reliably engage the default network (BSR = 0.01, SD = 0.1, p = .99) or the frontoparietal control network (BSR = 1.54, SD = 2.1, p = .12). Only the covariance that was common to both planning tasks reliably engaged the frontoparietal control network as defined by the rsfcMRI analysis.
3c. Network ROI Analysis – BOLD
We determined the mean magnitude of the task-related hemodynamic response within each of the network ROIs. This complementary univariate analysis of percent BOLD signal change within each resting-state network was entirely consistent with the multivariate findings (Fig. 6). In all three networks, there were significant differences (Bonferroni corrected α = .05) in percent signal change relative to counting in the predicted direction. Within the default network, there was an increase in BOLD signal for autobiographical planning task performance (t(19) = 6.49) and a decrease for Tower of London task performance (t(19) = −3.57). Within the dorsal attention network, there was a decrease in BOLD signal for autobiographical planning task performance (t(19) = −15.14) and an increase for Tower of London task performance (t(19) = 7.36). Within the frontoparietal control network, there was an increase in BOLD signal for both autobiographical planning (t(19) = 4.75) and Tower of London (t(19) = 5.32) task performance. Differences were also observed in a direct comparison between the autobiographical planning task and the Tower of London task in percent BOLD signal change in the default (t(19) = 10.77) and dorsal attention (t(19) = −17.81) networks. No differences were observed in percent BOLD signal change in the frontoparietal control network between planning tasks, even at a more liberal significance threshold (t(19) = −1.65; uncorrected p >.10). See Fig. 6.
Figure 6.

Mean and SEM of planning task-related percent BOLD signal change within each resting-state network. (A) Default network. (B) Dorsal attention network. (C) Frontoparietal control network. * indicates significant task difference in BOLD signal from baseline.
In order to ensure that the comparison counting condition did not bias the results, we also conducted four a priori t-tests that examined peak activity relative to trial onset. Within the default network, BOLD signal significantly increased above trial onset for autobiographical planning task (t(19) = 7.80, p < .001). Performance on the Tower of London task showed a significant increase in BOLD signal within the dorsal attention network (t(19) = 14.16, p < .001). There were also significant increases in BOLD signal within the frontoparietal control network for both autobiographical planning task (t(19) = 2.15, p < .05), and Tower of London task (t(19) = 4.54, p < .001) performance.
4. Network Coupling
4a. Network Coupling – Brain Scores
The rise and fall of activity in the default and dorsal attention networks for LV1 and the frontoparietal control network for LV2, depicted in the temporal brain scores (Figure 2C, Figure 3C), were suggestive of network coupling during the planning tasks. The mean brain scores during the autobiographical planning task for LV 1 and LV2 were correlated over the 25-second trial (r = .94, p < .001). A similar pattern was observed for the Tower of London task (r = .91, p < .001). Within-subject correlations were reliably greater than zero during the autobiographical planning task between the pattern of activity in LV1 (default network) and LV2 (frontoparietal control network) (mean z’ = .74, SD = .58; t(19) = 5.7, p < .001). Within-subject correlations were also reliably greater than zero during the Tower of London task between the pattern of activity in LV1 (dorsal attention network) and LV2 (frontoparietal control network)(mean z’ = 1.01, SD = .74; t(19) = 6.2, p < .001).
4b. Network Coupling – BOLD
Next, we assessed the magnitude of BOLD signal correlations with the frontoparietal control network between the autobiographical planning and Tower of London tasks within the default and dorsal attention networks. There was a significant task by network interaction, F(1,19) = 42.49 (p < .001), see Figure 7. Correlations of frontoparietal control network activity were significantly greater with default network activity than dorsal attention network activity during autobiographical planning. Conversely, correlations of frontoparietal control network activity were significantly greater with dorsal attention network activity than default network activity during performance on the Tower of London task. The magnitude of correlations between the frontoparietal control network and the default mode network were significantly greater than zero for autobiographical planning (mean z’ = 1.10, SD = .58; t(19) = 8.4, p < .001), but not during performance on the Tower of London task (mean z’ = .06, SD = .69; t(19) = 0.4, p > .65). Additionally, the magnitude of correlations between the frontoparietal control network and the dorsal attention network were significantly greater than zero for the Tower of London task (mean z’ = .91, SD = .51; t(19) = 8.0, p < .001), but not during performance on the autobiographical planning task (mean z’ = -.23, SD = .80; t(19) = −1.3, p > .20). See Figure 7.
Figure 7.

Frontoparietal control network coupling modulated by task. The frontoparietal control network is reliably correlated with the default network during autobiographical planning, but not during visuospatial planning, across the trial interval (2.5 – 25.0 seconds). The dorsal attention network is reliably correlated with the frontoparietal control network during visuospatial planning, but not during autobiographical planning.
When we assessed the magnitude of BOLD signal correlations with the frontoparietal control network relative to trial onset (i.e., as opposed to calculations relative to the control task), a slightly different pattern emerged. There was still a significant task by network interaction, F(1,19) = 6.25 (p < .05), see Supplemental Figure 4. Critically, we observed a difference in frontoparietal control network correlations with the default mode network according to task. Correlations of frontoparietal control network activity were significantly greater with the default network during autobiographical planning than during the Tower of London task. The magnitude of correlations between the frontoparietal control network and the default mode network were significantly greater than zero for autobiographical planning (mean z’ = .83, SD = .36; t(19) = 10.2, p < .001), but not during performance on the Tower of London task (mean z’ = -.34, SD = .83; t(19) = −1.8, p > .05). Relative to trial onset, no differences in the correlations between the frontoparietal control network and the dorsal attention network were observed across the planning tasks, as expected, likely due to the need to attend to the visually presented information common to both planning task conditions. However, there was also no difference in the correlation magnitude during the autobiographical planning task with the frontoparietal control network between the default and dorsal attention networks, although the default network correlation strength was numerically greater, as predicted. The magnitude of correlations between the frontoparietal control network and the dorsal attention network were significantly greater than zero for Tower of London task (mean z’ = .71, SD = .85; t(19) = 3.7, p < .001), and the autobiographical planning task (mean z’ = .76, SD = .64; t(19) = 5.3, p < .001).
4c. Network Coupling – Task-related Functional Connectivity
The seed PLS analysis revealed a significant pattern of task-related functional connectivity (p = .002) that was reliable for the default network ROI BOLD signal value during the autobiographical planning task. A distributed pattern of brain activity was significantly correlated with the default network seed, r = .90. This distributed pattern of activity included the default network (BSR = 3.32, SD = 2.3, p < .001) and the frontoparietal control network (BSR = 2.44, SD = 1.9, p < .05). The dorsal attention network was not reliably associated with this pattern (BSR = 1.48, SD = 1.4, p > .10). The second seed PLS analysis also revealed a significant pattern of functional connectivity (p = .002) that was reliable for the dorsal attention network ROI BOLD signal value during the Tower of London task. A distributed pattern of brain activity was significantly correlated with the dorsal attention network seed, r = .89. This distributed pattern included the dorsal attention network (BSR = 2.28, SD = 2.1, p < .05) and frontoparietal control network (BSR = 2.23, SD = 2.0, p < .05). The default network was not reliably associated with this pattern (BSR = 1.12, SD = 1.4, p > .25). See Figure 8 and supplemental Figure 5.
Figure 8.
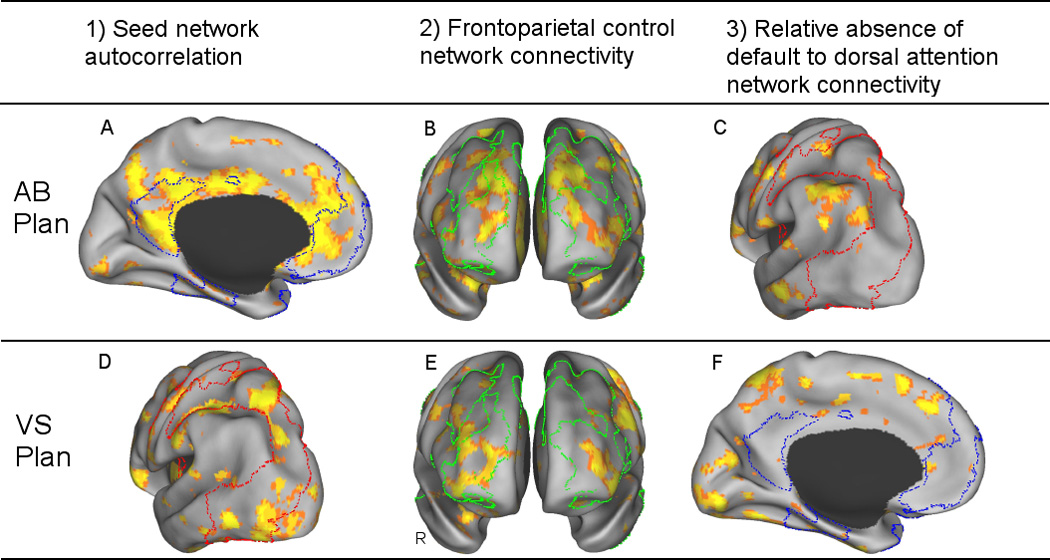
Task-related Functional Connectivity Analysis. Seed PLS results illustrate regions that are functionally connected with the default network ROI BOLD value during autobiographical planning, and with the dorsal attention network ROI BOLD value during visuospatial planning. All three conditions for network coupling were met. During autobiographical planning, network coupling between the default and frontoparietal control networks were demonstrated by A) Default seed network autocorrelations (depicted on the medial surface), B) Default network seed connectivity with the frontoparietal control network (depicted on an anterior view of the prefrontal lobes) and C) a relative absence of connectivity with the dorsal attention network (depicted on a lateral posterior surface). During visuospatial planning, network coupling between the dorsal attention and frontoparietal control networks were demonstrated by D) Dorsal attention seed network autocorrelations (lateral posterior), E) Dorsal attention network seed connectivity with the frontoparietal control network (anterior) and F) a relative absence of connectivity with the default network (medial). Outlined regions are the rsfcMRI maps: Blue = Default network on the medial surface, Red = Dorsal attention network on the lateral posterior surface, Green = Frontoparietal control network on the anterior frontal lobes. Images are thresholded at p < .001 (PLS identifies whole brain patterns of activity in a single analytic step, thus, no correction for multiple comparisons is required). See Supplemental Figure 5 for whole brain results. AB Plan = autobiographical planning; VS Plan = visuospatial planning; R = right; L = left.
These three analyses suggest that the frontoparietal control network couples its activity with either the default or dorsal attention network, during the autobiographical planning task or Tower of London task, respectively. The brain scores from LV 1 and LV2, depicting the rise and fall of activity in the initial PLS results, were correlated across the trial. Additionally, a network wide BOLD correlation analysis showed that the frontoparietal control network coupled its activity with the default network during autobiographical planning; Conversely, the frontoparietal control network coupled its activity with the dorsal attention network during visuospatial planning. This pattern was replicated in a voxel-wise multivariate task-related functional connectivity analysis using seed PLS.
5. Task Difficulty Results
The block PLS analysis used to assess potential effects of task difficulty essentially replicated the results of the spatiotemporal PLS analysis, revealing two significant patterns of activity, and critically, revealed no differences due to task difficulty. The first LV maximally dissociated both easy and difficult autobiographical planning task conditions from both easy and difficult Tower of London task conditions (accounting for 77.89% of the covariance in the data, p = .002). The second pattern of activity dissociated all planning conditions from counting (accounting for 14.96% of the covariance in the data, p = .002). Critically, there were no reliable differences in the brain scores between the easy and difficult autobiographical planning task and Tower of London task conditions relative to counting, thus ruling out any significant effect of task difficulty on the patterns of brain activation.
Discussion
We tested the hypothesis that the frontoparietal control network would be flexibly engaged with either the default or dorsal attention network in support of goal-directed cognition. In a data-driven multivariate PLS analysis, we found that autobiographical planning, like imagining personal future events, engages the default network. Consistent with previous observations, we also observed activity in the dorsal attention network while subjects engaged in visuospatial planning (Baker et al., 1996; Morris et al., 1993; Newman et al., 2003). Critically, both planning tasks engaged the frontoparietal control network. Task-related functional connectivity analyses indicated that the frontoparietal control network coupled its activity with the default network during autobiographical planning; furthermore, the frontoparietal control network coupled its activity with the dorsal attention network during visuospatial planning. These findings demonstrate that the frontoparietal control network can flexibly couple activity with the default or dorsal attention networks in support of goal-directed cognition.
The data-driven PLS results showed a pattern of task-related activity that was strikingly similar to previously observed intrinsic resting-state networks (Fox et al., 2005; Vincent et al., 2008; Fig. 5 and Supplemental Fig. 3). This similarity is all the more remarkable when considering that the same networks were identified in independent experimental runs, and using different analytic techniques to detect patterns of covarying BOLD signal at different frequency ranges. In the rsfcMRI analysis, we replicated the default, dorsal attention and frontoparietal control networks (Vincent et al., 2008). We used these resting-state networks as a priori ROIs to further interrogate the PLS results and quantify the degree and specificity of the task-related activation of these networks. We also performed complementary univariate ROI analyses to the same end. The PLS results showed that autobiographical planning significantly and reliably engaged both the default and frontoparietal control networks; additionally, visuospatial planning significantly and reliably engaged the dorsal attention and frontoparietal control networks (Fig. 4). Univariate analyses provided converging evidence for these observations, and were consistent whether we compared changes in BOLD signal relative to the counting condition or relative to trial onset (fixation): Percent BOLD signal significantly increased within the default and frontoparietal control networks for autobiographical planning, and within the dorsal attention network and frontoparietal control network for visuospatial planning (Fig. 6). Together, these findings confirm that goal-directed planning engages the frontoparietal control network, and is coactive with the default network or dorsal attention network, depending on task domain.
Results from the task-related functional connectivity analysis support the interpretation that the frontoparietal control network is not only co-active with the default or dorsal attention network, but couples its activity with each of these networks, depending on task domain. The temporal brain scores (i.e. composite measures of the neural activity at each timepoint) from the initial PLS analysis showed a high degree of correspondence in activity. Likewise, the BOLD activity extracted from the default and dorsal attention networks demonstrated a consistent temporal correlation pattern with frontoparietal control network activity during the autobiographical planning and Tower of London tasks, respectively. Both analyses demonstrated that neural activity within the default and frontoparietal control networks was coupled for autobiographical planning. Also, neural activity within the dorsal attention and frontoparietal control networks was coupled for visuospatial planning. This temporal correspondence is inconsistent with the alternative view that the default or dorsal attention networks and the frontoparietal control network act independently or sequentially without actually working directly together with the frontoparietal control network. If the networks were to independently modulate activity out of phase with one another over the course of individual trials, then this shifting would have to occur at a rate exceeding the fMRI sampling rate of 2500ms. While less parsimonious than the conclusion that network activity is coupled, the latter would be suggestive of network cooperation.
In a task-related functional connectivity analysis using seed PLS, we demonstrated a voxel-wise pattern of connectivity that is consistent with, and complementary to, the global measures discussed above. During autobiographical planning, we showed significant and reliable covarying patterns of activity within the default network (including the MPFC, PCC, lateral and medial temporal lobes, including the hippocampus, and the pIPL) with the frontoparietal control network (including the RLPFC, MFG, dACC, PCu, and the aIPL). During visuospatial planning, we showed significant and reliable covarying patterns of activity within the dorsal attention network (including the DLPFC, FEF, iPCS, MT+, and SPL) with the frontoparietal control network (including the RLPFC, MFG, dACC, PCu, and the aIPL). The extent of network connectivity, in its entirety, was quantitatively assessed and confirmed in an independent ROI analysis using the rsfcMRI maps (See Figure 8 and supplementary Figure 5). Evidence of this network coupling was observed independent of the counting condition. Together, these data confirm that default and frontoparietal control regions of the brain can interact as a functional network. This observation is consistent with the behavior of dorsal attention and frontoparietal control regions interacting as a functional network, as observed here and elsewhere (e.g. Grady et al., in press). The novel observation here, however, is that the frontoparietal control network may functionally couple with either the default or dorsal attention network, not just the dorsal attention network, in support of goal-directed cognition. A future challenge will be to examine node-to-node functional interactivity, within and across networks, modulated by task demands.
Additional analyses reduced the likelihood that task difficulty and RT differences could account for our findings. We addressed a potential confound of task difficulty by dividing the task data into easy and difficult trials and comparing task-related activity under easy and difficult conditions. If increased engagement of the frontoparietal control network during planning were due to increased difficulty during the planning tasks, relative to counting, we would expect increased activity within the frontoparietal control network for difficult versus easy autobiographical and visuospatial planning conditions. This effect was not observed, suggesting that frontoparietal control network activity was not modulated merely by task difficulty. Our categorization of autobiographical planning task difficulty was, however, based upon a post-scan self-report measure. Future work will be required to independently modulate and assess the effects of autobiographical planning difficulty.
Two additional analyses reduced the possibility that RT differences between autobiographical planning and counting could account for the pattern of network activity observed. First, significant engagement of the default and frontoparietal control networks by autobiographical planning was also observed relative to trial onset, independent of the counting control condition. Second, the block PLS analysis used to assess differences in difficulty between the planning conditions only included time points preceding the manual response, thereby eliminating potentially confounding RT differences. In addition to replicating the results using this method, we ruled out a differential RT explanation of differences in network activity between the conditions.
The neurocognitive function of the default network is not well characterized; yet the network is reliably engaged during spontaneous internal mentation (Andrews-Hanna et al., in press), including self-referential (D'Argembeau et al., 2005; Gusnard et al., 2001), and autobiographical thoughts about the past and the future (Andrews-Hanna et al., in press; Andrews-Hanna et al., 2010; Spreng and Grady, 2010; Spreng et al., 2009). Task-related fMRI data suggest that the medial temporal lobes support recombination of elements of past experience into a simulation of a specific future event (Addis et al., 2009; Addis et al., 2007). Midline structures including MPFC and PCC that show increased activity during episodic simulation of future events have been linked specifically with both personal goal processing and self-referential thinking (D'Argembeau et al., 2010; D'Argembeau et al., 2009). The MPFC may be particularly sensitive to processing of self-promotion goals, which emphasize hopes, accomplishments, and advancement (Higgins, 1997; Johnson et al., 2006; Packer and Cunningham, 2009). A remaining question is how imaginings supported by these components of the default network are integrated into goal-directed autobiographical plans in order to serve the adaptive function of guiding complex everyday behavior. Our findings suggest that co-activation of the default network with the frontoparietal control network occurs when individuals formulate autobiographical plans aimed at fulfilling an imagined goal state. The coactivation of the default network with the frontoparietal control network, however, is unlikely to be specific to autobiographical planning. Previous neuroimaging investigations of tasks that engage the default network (e.g. Spreng et al., 2009) have placed low demands on control processes and are thus unlikely to robustly engage the frontoparietal control network. Conversely, introspective processes that require simultaneous goal-directed control of information will likely engage aspects of both the default and frontoparietal control networks, consistent with the current findings.
The Tower of London task predominantly engaged the dorsal attention network, in addition to the frontoparietal control network. Using PLS, we dissociated patterns of activity associated with this task between these two networks, which might support different aspects of task performance. Visuospatial planning places high demands on visuospatial attention, hence the observed robust activation of the dorsal attention network associated with externally driven attention. Visuospatial planning also taxes working memory and control processes that engage anterior prefrontal regions, including the RLPFC (Baker et al., 1996; Wagner et al., 2006). The Tower of London task was developed to assess goal-directed non-routine behavior that is not driven by immediate environmental stimuli (Shallice, 1982). This aspect of the task may be common with autobiographical planning, as reflected by co-activation of the frontoparietal control network. Although we aimed to make the planning tasks as similar as possible with respect to perceptual characteristics and general task structure, further research will be needed to tease apart specific task components that differ between visuospatial and autobiographical planning, using a broader range of task manipulations.
By demonstrating that the frontoparietal control network is engaged during both autobiographical and visuospatial planning, this study provides new insight into its role in cognitive control and its access to domain specific information. The distributed frontoparietal control network is anatomically interposed between the default and dorsal attention networks. Vincent and colleagues (2008) hypothesized that this network could serve to integrate information between the independent default and dorsal attention networks. In the present study, we compared tasks that are known to engage anticorrelated brain networks, but that both involved the goal-directed integration of information over time. This comparison provided a dynamic range of BOLD signal to detect dissociable and converging patterns of distributed activity. By demonstrating that the frontoparietal control network is actively engaged by two tasks that differentially rely upon either the default or dorsal attention network, we have provided evidence that the frontoparietal control network may flexibly gain access to information processed in either domain.
Recent work has clarified the role of various components of the frontoparietal control network in cognitive performance, including the role of RLPFC in cognitive control (Koechlin et al., 1999), the hierarchical organization of control processes in lateral prefrontal cortex (Badre and D'Esposito, 2007), and the role of the aIPL in the control of attention (Corbetta et al., 2008) and memory (Cabeza et al., 2008). Comparing tasks that vary in only a single feature, as in the foregoing studies, provides a means to identify subtle changes in brain activity attributable to that feature. This approach has been productive in determining precise functional roles of nodes within a broader network.
Complementing these previous findings, we demonstrate here that lateral prefrontal and parietal regions do not work in isolation to support control processes, but rather, function as an integrated network of regions in support of controlled cognitive performance. Diffusion tensor imaging provides anatomical evidence that the RLPFC and aIPL are structurally interconnected via the superior parietal fasciculus (van den Heuvel et al., 2009). Neurophysiological techniques such as rsfcMRI suggest an even broader frontoparietal control network comprising multiple nodes associated with RLPFC and aIPL, including MSPFC, aIfO, dACC and PCu (Albert et al., 2009; Damoiseaux et al., 2006; Dosenbach et al., 2007; Fox et al., 2006; Smith et al., 2009; Vincent et al., 2008). The current study functionally identified this extended frontoparietal control network based on task-related activation during performance on two distinct planning tasks. The results provide novel evidence to support the hypothesis that the interposed nodes of the frontoparietal control network act as regional convergence zones that functionally interact with both default and dorsal attention regions during cognitive tasks. Further work is needed to delineate how the frontoparietal control network acts as a cortical mediator for crosstalk between internalized cognition and external attention in support of goal-directed cognition.
Supplementary Material
Acknowledgements
We thank Tanveer Talukdar, Hesheng Liu, Itamar Kahn and Randy Buckner for preprocessing and rsfcMRI tools, Karen Spreng for her assistance, and Randy McIntosh and Justin Vincent for helpful advice. This work was supported by NIH Grant MH060941 to DLS.
Footnotes
Publisher's Disclaimer: This is a PDF file of an unedited manuscript that has been accepted for publication. As a service to our customers we are providing this early version of the manuscript. The manuscript will undergo copyediting, typesetting, and review of the resulting proof before it is published in its final citable form. Please note that during the production process errors may be discovered which could affect the content, and all legal disclaimers that apply to the journal pertain.
References
- Addis DR, McIntosh AR, Moscovitch M, Crawley AP, McAndrews MP. Characterizing spatial and temporal features of autobiographical memory retrieval networks: A partal least squares approach. Neuroimage. 2004;23:1460–1471. doi: 10.1016/j.neuroimage.2004.08.007. [DOI] [PubMed] [Google Scholar]
- Addis DR, Pan L, Vu MA, Laiser N, Schacter DL. Constructive episodic simulation of the future and the past: Distinct subsystems of a core brain network mediate imagining and remembering. Neuropsychologia. 2009;47:2222–2238. doi: 10.1016/j.neuropsychologia.2008.10.026. [DOI] [PubMed] [Google Scholar]
- Addis DR, Wong AT, Schacter DL. Remembering the past and imagining the future: Common and distinct neural substrates during event construction and elaboration. Neuropsychologia. 2007;45:1363–1377. doi: 10.1016/j.neuropsychologia.2006.10.016. [DOI] [PMC free article] [PubMed] [Google Scholar]
- Albert NB, Robertson EM, Miall RC. The resting human brain and motor learning. Curr Biol. 2009;19:1023–1027. doi: 10.1016/j.cub.2009.04.028. [DOI] [PMC free article] [PubMed] [Google Scholar]
- Andrews-Hanna J, Reidler J, Huang C, Buckner R. Evidence for the default network's role in spontaneous cognition. J Neurophysiol. doi: 10.1152/jn.00830.2009. (in press) [DOI] [PMC free article] [PubMed] [Google Scholar]
- Andrews-Hanna J, Reidler J, Sepulcre J, Poulin R, Buckner R. Functional-Anatomic Fractionation of the Brain's Default Network. Neuron. 2010;65:550–562. doi: 10.1016/j.neuron.2010.02.005. [DOI] [PMC free article] [PubMed] [Google Scholar]
- Badre D, D'Esposito M. Functional magnetic resonance imaging evidence for a hierarchical organization of the prefrontal cortex. J Cogn Neurosci. 2007;19:2082–2099. doi: 10.1162/jocn.2007.19.12.2082. [DOI] [PubMed] [Google Scholar]
- Baker SC, Rigers RD, Owen AM, Frith CD, Dolan RJ, Frackowiak RSJ, Robbins TW. Neural systems engaged by planning: a PET study of the Tower of London task. Neuropsychologia. 1996;34:515–526. doi: 10.1016/0028-3932(95)00133-6. [DOI] [PubMed] [Google Scholar]
- Biswal B, Yetkin FZ, Haughton VM, Hyde JS. Functional connectivity in the motor cortex of resting human brain using echo-planar MRI. Magnetic Resonance in Medicine. 1995;34:537–541. doi: 10.1002/mrm.1910340409. [DOI] [PubMed] [Google Scholar]
- Buckner RL, Andrews-Hanna JR, Schacter DL. The brain's default network: Anatomy, function, and relevance to disease. The Year in Cognitive Neuroscience, Annals of the New York Academy of Sciences. 2008;1124:1–38. doi: 10.1196/annals.1440.011. [DOI] [PubMed] [Google Scholar]
- Cabeza R, Ciaramelli E, Olson IR, Moscovitch M. The parietal cortex and episodic memory: an attentional account. Nat Rev Neurosci. 2008;9:613–625. doi: 10.1038/nrn2459. [DOI] [PMC free article] [PubMed] [Google Scholar]
- Carhart-Harris RL, Friston KJ. The default-mode, ego-funcitons and free energy: a neurobiological account of Freudian ideas. Brain. 2010;133:1265–1283. doi: 10.1093/brain/awq010. [DOI] [PMC free article] [PubMed] [Google Scholar]
- Christoff K, Gordon AM, Smallwood J, Smith R, Schooler JW. Experience sampling during fMRI reveals default network and executive system conributions to mind wandering. Proc Natl Acad Sci USA. 2009;106:8719–8724. doi: 10.1073/pnas.0900234106. [DOI] [PMC free article] [PubMed] [Google Scholar]
- Corbetta M, Patel G, Shulman GL. The reorienting system of the human brain: from environment to theory of mind. Neuron. 2008;58:306–324. doi: 10.1016/j.neuron.2008.04.017. [DOI] [PMC free article] [PubMed] [Google Scholar]
- D'Argembeau A, Collette F, Van der Linden M, Laureys S, Del Fiore G, Degueldre C, Luxen A, Salmon E. Self-referential reflective activity and its relationship with rest: a PET study. Neuroimage. 2005;25:616–624. doi: 10.1016/j.neuroimage.2004.11.048. [DOI] [PubMed] [Google Scholar]
- D'Argembeau A, Stawarczyk D, Majerus S, Collette F, Van der Linden M, Feyers D, Maquet P, Salmon E. The Neural Basis of Personal Goal Processing When Envisioning Future Events. J Cogn Neurosci. 2010;22:1701–1713. doi: 10.1162/jocn.2009.21314. [DOI] [PubMed] [Google Scholar]
- D'Argembeau A, Stawarczyk D, Majerus S, Collette F, Van der Linden M, Salmon E. Modulation of medial prefrontal and inferior parietal cortices when thinking about past, present, and future selves. Soc Neurosci. 2009:1–14. doi: 10.1080/17470910903233562. [DOI] [PubMed] [Google Scholar]
- Damoiseaux JS, Rombouts SA, Barkhof F, Scheltens P, Stam CJ, Smith SM, Beckmann CF. Consistent resting-state networks across healthy subjects. Proc Natl Acad Sci U S A. 2006;103:13848–13853. doi: 10.1073/pnas.0601417103. [DOI] [PMC free article] [PubMed] [Google Scholar]
- Dosenbach NU, Fair DA, Miezin FM, Cohen AL, Wenger KK, Dosenbach RA, Fox MD, Snyder AZ, Vincent JL, Raichle ME, et al. Distinct brain networks for adaptive and stable task control in humans. Proc Natl Acad Sci U S A. 2007;104:11073–11078. doi: 10.1073/pnas.0704320104. [DOI] [PMC free article] [PubMed] [Google Scholar]
- Fox MD, Corbetta M, Snyder AZ, Vincent JL, Raichle ME. Spontaneous neuronal activity distinguishes human dorsal and ventral attention systems. Proc Natl Acad Sci U S A. 2006;103:10046–10051. doi: 10.1073/pnas.0604187103. [DOI] [PMC free article] [PubMed] [Google Scholar]
- Fox MD, Raichle ME. Spontaneous fluctuations in brain activity observed with functional magnetic imaging. Nat Rev Neurosci. 2007;8:700–711. doi: 10.1038/nrn2201. [DOI] [PubMed] [Google Scholar]
- Fox MD, Snyder AZ, Vincent JL, Corbetta M, Van Essen DC, Raichle ME. The human brain is intrinsically organized into dynamic, anticorrelated funcional networks. Proc Natl Acad Sci USA. 2005;102:9673–9678. doi: 10.1073/pnas.0504136102. [DOI] [PMC free article] [PubMed] [Google Scholar]
- Grady CL, Protzner AB, Kovacevic N, Strother SC, Afshin-Pour B, Wojtowicz M, Anderson JA, Churchill N, McIntosh AR. A Multivariate Analysis of Age-Related Differences in Default Mode and Task-Positive Networks across Multiple Cognitive Domains. Cerebral Cortex. doi: 10.1093/cercor/bhp207. (in press) [DOI] [PMC free article] [PubMed] [Google Scholar]
- Gusnard DA, Akbudak E, Schulman GL, Raichle ME. Medial prefrontal cortex and self-referential mental activity: Relation to a default mode of brain function. Proc Natl Acad Sci USA. 2001;98:4259–4264. doi: 10.1073/pnas.071043098. [DOI] [PMC free article] [PubMed] [Google Scholar]
- Gusnard DA, Raichle ME. Searching for a baseline: Functional imaging and the resting human brain. Nat Rev Neurosci. 2001;2:685–694. doi: 10.1038/35094500. [DOI] [PubMed] [Google Scholar]
- Higgins ET. Beyond pleasure and pain. Am Psychol. 1997;52:1280–1300. doi: 10.1037//0003-066x.52.12.1280. [DOI] [PubMed] [Google Scholar]
- Johnson RE, Chang CH, Lord RG. Moving from cognition to behavior: What the research says. Psychol Bull. 2006;132:381–415. doi: 10.1037/0033-2909.132.3.381. [DOI] [PubMed] [Google Scholar]
- Kelly AM, Uddin LQ, Biswal BB, Castellanos FX, Milham MP. Competition between functional brain networks mediates behavioral variability. Neuroimage. 2008;39:527–537. doi: 10.1016/j.neuroimage.2007.08.008. [DOI] [PubMed] [Google Scholar]
- Koechlin E, Basso G, Pietrini P, Panzer S, Grafman J. The role of the anterior prefrontal cortex in human cognition. Nature. 1999;399:148–151. doi: 10.1038/20178. [DOI] [PubMed] [Google Scholar]
- Laird AR, Eickhoff SB, Li K, Robin DA, Glahn DC, Fox PT. Investigating the functional heterogeneity of the default mode network using coordinate-based meta-analytic modeling. J Neurosci. 2009;29:14496–14505. doi: 10.1523/JNEUROSCI.4004-09.2009. [DOI] [PMC free article] [PubMed] [Google Scholar]
- Maguire EA, Frith CD. Aging affects the engagement of the hippocampus during autobiographical memory retrieval. Brain. 2003;126:1511–1523. doi: 10.1093/brain/awg157. [DOI] [PubMed] [Google Scholar]
- Maguire EA, Mummery CJ. Differential modulation of a common memory retrieval network revealed by positron emission tomography. Hippocampus. 1999;9:54–61. doi: 10.1002/(SICI)1098-1063(1999)9:1<54::AID-HIPO6>3.0.CO;2-O. [DOI] [PubMed] [Google Scholar]
- Maguire EA, Mummery CJ, Buchel C. Patterns of hippocampalcortical interaction dissociate temporal lobe memory subsystems. Hippocampus. 2000;10:475–482. doi: 10.1002/1098-1063(2000)10:4<475::AID-HIPO14>3.0.CO;2-X. [DOI] [PubMed] [Google Scholar]
- Mason M, Norton M, Van Horn J, Wegner D, Grafton S, Macrae C. Wandering Minds: The Default Network and Stimulus-Independent Thought. Science. 2007;315:393. doi: 10.1126/science.1131295. [DOI] [PMC free article] [PubMed] [Google Scholar]
- McIntosh A, Rajah M, Lobaugh N. Interactions of prefrontal cortex in relation to awareness in sensory learning. Science. 1999;284:1531–1533. doi: 10.1126/science.284.5419.1531. [DOI] [PubMed] [Google Scholar]
- McIntosh AR. Mapping cognition to the brain through neural interactions. Memory. 1999;7:523–548. doi: 10.1080/096582199387733. [DOI] [PubMed] [Google Scholar]
- McIntosh AR, Bookstein FL, Haxby JV, Grady CL. Spatial pattern analysis of functional brain images using partial least squares. Neuroimage. 1996;3:143–157. doi: 10.1006/nimg.1996.0016. [DOI] [PubMed] [Google Scholar]
- McIntosh AR, Chau WK, Protzner AB. Spatiotemporal analysis of event-related fMRI data using partial least squares. Neuroimage. 2004a;23:764–775. doi: 10.1016/j.neuroimage.2004.05.018. [DOI] [PubMed] [Google Scholar]
- McIntosh AR, Chau WK, Protzner AB. Spatiotemporal analysis of event-related fMRI data using partial least squares. Neuroimage. 2004b;23:764–775. doi: 10.1016/j.neuroimage.2004.05.018. [DOI] [PubMed] [Google Scholar]
- McKiernan KA, Kaufman JN, Kucera-Thompson J, Binder JR. A parametric manipulation of factors affecting task-induced deactivation in functional neuroimaging. J Cogn Neurosci. 2003;15:394–408. doi: 10.1162/089892903321593117. [DOI] [PubMed] [Google Scholar]
- Morris RG, Ahmed S, Syed GM, Toone BK. Neural correlates of planning ability: Frontal lobe activation during the Tower of London test. Neuropsychologia. 1993;31:1367–1378. doi: 10.1016/0028-3932(93)90104-8. [DOI] [PubMed] [Google Scholar]
- Newman SD, Carpenter PA, Verma S, Just MA. Frontal and parietal participation in problem solving in the Tower of London: fMRI and computational modeling of planning and high-level perception. Neuropsychologia. 2003;41:1668–1682. doi: 10.1016/s0028-3932(03)00091-5. [DOI] [PubMed] [Google Scholar]
- Okuda J, Fujii T, Ohtake H, Tsukiura T, Tanji K, Suzuki K, Kawashima R, Fukuda H, Itoh M, Yamadori A. Thinking of the future and the past: The roles of the frontal pole and the medial temporal lobes. Neuroimage. 2003;19:1369–1380. doi: 10.1016/s1053-8119(03)00179-4. [DOI] [PubMed] [Google Scholar]
- Packer DJ, Cunningham WA. Neural correlates of reflection on goal states: the role of regulatory focus and temporal distance. Soc Neurosci. 2009;4:412–425. doi: 10.1080/17470910902750186. [DOI] [PubMed] [Google Scholar]
- Park DC, Polk TA, Hebrank AC, Jenkins LJ. Age differences in default mode activity on easy and difficult spatial judgment tasks. Frontiers in Human Neuroscience. 2010;3:1–12. doi: 10.3389/neuro.09.075.2009. [DOI] [PMC free article] [PubMed] [Google Scholar]
- Sampson PD, Streissguth AP, Barr HM, Bookstein FL. Neurobehavioral effects of prenatal alcohol: Part II. Partial least squares analysis. Neurotoxicol Teratol. 1989;11:477–491. doi: 10.1016/0892-0362(89)90025-1. [DOI] [PubMed] [Google Scholar]
- Schacter DL, Addis DR, Buckner RL. Remembering the past to imagine the future: The prospective brain. Nat Rev Neurosci. 2007;8:657–661. doi: 10.1038/nrn2213. [DOI] [PubMed] [Google Scholar]
- Schacter DL, Addis DR, Buckner RL. Episodic simulation of future events: Concepts, data, and applications. The Year in Cognitive Neuroscience, Annals of the New York Academy of Sciences. 2008;1124:39–60. doi: 10.1196/annals.1440.001. [DOI] [PubMed] [Google Scholar]
- Shallice T. Specific impairments of planning. Philos Trans R Soc B. 1982;298:199–209. doi: 10.1098/rstb.1982.0082. [DOI] [PubMed] [Google Scholar]
- Shipman S, Astur R. Factors affecting the hippocampal BOLD response during spatial memory. Behav Brain Res. 2008;187:433–441. doi: 10.1016/j.bbr.2007.10.014. [DOI] [PubMed] [Google Scholar]
- Shulman GL, Fiez JA, Corbetta M, Buckner RL, Miezin FM, Raichle ME. Common blood flow changes across visual tasks 2: Decreases in cerebral cortex. J Cogn Neurosci. 1997;9:648–663. doi: 10.1162/jocn.1997.9.5.648. [DOI] [PubMed] [Google Scholar]
- Sigman M, Pan H, Yang Y, Stern E, Silbersweig D, Gilbert C. Top-down reorganization of activity in the visual pathway after learning a shape. Neuron. 2005;46:823–835. doi: 10.1016/j.neuron.2005.05.014. [DOI] [PMC free article] [PubMed] [Google Scholar]
- Smith SM, Fox PT, Miller KL, Glahn DC, Fox PM, Mackay CE, Filippini N, Watkins KE, Toro R, Laird AR, Beckmann CF. Correspondence of the brain's functional architecture during activation and rest. Proc Natl Acad Sci U S A. 2009;106:13040–13045. doi: 10.1073/pnas.0905267106. [DOI] [PMC free article] [PubMed] [Google Scholar]
- Sonuga-Barke E, Castellanos F. Spontaneous attentional fluctuations in impaired states and pathological. Neurosci Biobehav Rev. 2007;31:977–986. doi: 10.1016/j.neubiorev.2007.02.005. [DOI] [PubMed] [Google Scholar]
- Spreng RN, Grady CL. Patterns of Brain Activity Supporting Autobiographical Memory, Prospection, and Theory-of-Mind and Their Relationship to the Default Mode Network. J Cogn Neurosci. 2010;22:1112–1123. doi: 10.1162/jocn.2009.21282. [DOI] [PubMed] [Google Scholar]
- Spreng RN, Mar RA, Kim ASN. The common basis of autobiographical memory, prospection, navigation, theory of mind and the default mode: A quantitative meta-analysis. J Cogn Neurosci. 2009;32:489–510. doi: 10.1162/jocn.2008.21029. [DOI] [PubMed] [Google Scholar]
- Stevens WD, Hasher L, Chiew KS, Grady CL. A neural mechanism underlying memory failure in older adults. J Neurosci. 2008;28:12820–12824. doi: 10.1523/JNEUROSCI.2622-08.2008. [DOI] [PMC free article] [PubMed] [Google Scholar]
- Szpunar KK, Watson JM, McDermott KB. Neural substrates of envisioning the future. Proc Natl Acad Sci USA. 2007;104:642–647. doi: 10.1073/pnas.0610082104. [DOI] [PMC free article] [PubMed] [Google Scholar]
- Thomason M, Chang C, Glover G, Gabrieli J, Greicius M, Gotlib I. Default-mode function and task-induced deactivation have overlapping brain. Neuroimage. 2008;41:1493–1503. doi: 10.1016/j.neuroimage.2008.03.029. [DOI] [PMC free article] [PubMed] [Google Scholar]
- Toro R, Fox PT, Paus T. Functional coactivation map of the human brain. Cereb Cortex. 2008;18:2553–2559. doi: 10.1093/cercor/bhn014. [DOI] [PMC free article] [PubMed] [Google Scholar]
- Tosoni A, Galati G, Romani GL, Corbetta M. Sensory-motor mechanisms in human parietal cortex underlie arbitrary visual decisions. Nat Neurosci. 2008;11:1446–1453. doi: 10.1038/nn.2221. [DOI] [PMC free article] [PubMed] [Google Scholar]
- van den Heuvel MP, Mandl RC, Kahn RS, Hulshoff Pol HE. Functionally linked resting-state networks reflect the underlying structural connectivity architecture of the human brain. Hum Brain Mapp. 2009;30:3127–3141. doi: 10.1002/hbm.20737. [DOI] [PMC free article] [PubMed] [Google Scholar]
- van den Huevel OA, Groenewegen HJ, Barkhof F, Lazeron RHC, van Dyck R, Veltman DJ. Frontostriatal system in planning complexity: A parametric functional magnetic resonance version of the Tower of London task. Neuroimage. 2003;8:367–374. doi: 10.1016/s1053-8119(02)00010-1. [DOI] [PubMed] [Google Scholar]
- Van Essen DC. A Population-Average, Landmark- and Surface-based (PALS) atlas of human cerebral cortex. Neuroimage. 2005;28:635–662. doi: 10.1016/j.neuroimage.2005.06.058. [DOI] [PubMed] [Google Scholar]
- Vincent JL, Kahn I, Snyder AZ, Raichle ME, Buckner RL. Evidence for a frontoparietal control system reveaked by intrinsic functional connectivity. J Neurophysiol. 2008;100:3328–3342. doi: 10.1152/jn.90355.2008. [DOI] [PMC free article] [PubMed] [Google Scholar]
- Vincent JL, Snyder AZ, Fox MD, Shannon BJ, Andrews JR, Raichle ME, Buckner RL. Coherent spontaneous activity identifies a hippocampal-parietal memory network. J Neurophysiol. 2006;96:3517–3531. doi: 10.1152/jn.00048.2006. [DOI] [PubMed] [Google Scholar]
- Wagner G, Koch K, Reichenbach JR, Sauer H, Schlosser RGM. The special involvement of the rostrolateral prefrontal cortex in planning abilities: An event-related fMRI study with the Tower of London paradigm. Neuropsychologia. 2006;44:2337–2347. doi: 10.1016/j.neuropsychologia.2006.05.014. [DOI] [PubMed] [Google Scholar]
- Zar JH. Biostatistical Analysis. Prentice Hall: Upper Saddle River; 1996. [Google Scholar]
Associated Data
This section collects any data citations, data availability statements, or supplementary materials included in this article.