

Abstract
Ethanol exposure during postnatal days (PN) 4-6 in rats alters cerebellar development resulting in significant loss of Purkinje cells. There is little knowledge, however, on what happens to the neurons that survive. In this study, rat pups were treated with a daily dose of ethanol (either 3.6 or 4.5 g/kg body weight) delivered by intragastric intubation on PN4, PN4-6, or PN7-9. Then the interactions between climbing fibers and Purkinje cell were examined on PN14 using confocal microscopy. Mid-vermal cerebellar sections were stained with antibodies to calbindin-D28k (to visualize Purkinje cells) and vesicular glutamate transporter 2 (VGluT2, to visualize climbing fibers). Confocal z-stack images were obtained from Lobule 1 and analyzed with Imaris software to quantify the staining of the two antibodies. The VGluT2 immunostaining was significantly reduced in the PN4 and PN4-6 ethanol groups for the 4.5 g/kg dose level, compared to controls, indicating that the cerebellar circuitry was significantly altered following developmental ethanol exposure. Not only were there fewer Purkinje cells following ethanol exposure, but the surviving neurons had significantly fewer VGluT2-labeled synapses. These alterations in the synaptic integrity were both dose dependent and temporally dependent.
Keywords: Purkinje cell, Imaris, Confocal, VGluT2, Development
Cerebellar Purkinje cells of the rat are especially vulnerable to developmental ethanol exposure on postnatal days (PN) 4–6, with the amount of neuronal loss directly proportional to the blood ethanol concentration (Bonthius and West, 1990, Goodlett et al., 1990, Goodlett et al., 1997, Pierce et al., 1999, Dikranian et al., 2005). At PN4-6, the rat brain is in a period of rapid growth similar to human brain development found during the third trimester (Dobbing and Sands, 1979, Dobbing, 1981, Cudd, 2005). Therefore, administering a high dose of ethanol to rat pups daily on PN4-6 is a model of binge drinking during the human third trimester equivalent period. For humans, binge drinking in non-pregnant women can be fairly common. The National Survey on Drug Use and Health reports that 32.6% of non-pregnant women engaged in binge alcohol use, as defined by drinking five or more drinks at the same time or within a couple of hours (NSDUH, 2009). Fortunately, these numbers drop dramatically during the time a woman is pregnant with only 1% of pregnant women demonstrating binge alcohol use during the third trimester (NSDUH, 2009). However, this 1% in the USA alone represents from 40,000 to 60,000 children per year that are exposed to high levels of ethanol during the third trimester of development (Ventura et al., 2008, NSDUH, 2009). The rate for binge ethanol use in the third trimester is also coincident with the estimated incidence rate for Fetal Alcohol Spectrum Disorder (FASD) of 1 in every 100 live births (Riley and McGee, 2005, NSDUH, 2009).
Numerous studies, using a rat model that reflects ethanol exposure during the first few weeks of the human third trimester, have explored the mechanisms of Purkinje cell death (Light et al., 2002, Heaton et al., 2003, Goodlett et al., 2005, Siler-Marsiglio et al., 2005). However, little is known about ethanol’s impact on the integrity of synaptic inputs onto surviving neurons. A decrease in the number of Purkinje neurons does not fully explain the cerebellar dysfunction seen in FASD (Goodlett and Lundahl, 1996). For example, transgenic mice can have Purkinje cell losses of 50–75% before ataxia is apparent, (Mullen et al., 1976, Feddersen et al., 1992) and eliminating up to 95% of the Purkinje cells in a Lurcher/chimera mouse model does not result in ataxia (Martin et al., 2004).
The impact of ethanol on the surviving cells was evaluated in the current study by assessing the innervation of olivary climbing fibers along the somato-dendritic axis of Purkinje cells. The dendrites of Purkinje cells receive input from parallel fibers of granule cells and climbing fibers from the contralateral inferior olive of the brain stem (Altman and Bayer, 1997). Parallel fiber–Purkinje cell connections have demonstrated resiliency to developmental ethanol exposure (Klintsova et al., 1997, Klintsova et al., 2002). Postnatal ethanol exposure can reduce the overall number of these synapses simply because the number of Purkinje cells is reduced. However, the density of synapses per Purkinje cell is not affected, and there is evidence that synaptogenesis between parallel fibers and Purkinje cells following stimulation by complex motor training is similar in ethanol-exposed versus control animals (Klintsova et al., 1997, Klintsova et al., 2002). Electrophysiological characterization of Purkinje neurons confirms this resiliency in that animals that receive ethanol on PN4–10 demonstrate typical Purkinje cell activity evoked by parallel pathway stimulation (Backman et al., 1998).
The effect of developmental ethanol exposure on olivary climbing fibers is more controversial. An early study involving prenatal ethanol exposure indicated a retention of climbing fiber synapses on the soma rather than the normal progression to dendritic locations (Mohamed et al., 1987). A recent study with prenatal ethanol exposure in mice indicated that the climbing fiber induced complex spike firing rate of the Purkinje cells was normal (Servais et al., 2007). In contrast, another study found, in rats exposed to ethanol postnatally, a significant decrease in the proportion of Purkinje cells generating complex spikes, implying that the input from the inferior olive has been significantly altered by the ethanol exposure (Backman et al., 1998). Interestingly, when climbing fiber development is altered, such as in gene deletion studies involving various glutamate receptors, the animals experience ataxia, motor discoordination, and alterations in eye blink conditioning (Ichise et al., 2000, Hashimoto et al., 2001, Kishimoto et al., 2002, Kato et al., 2005). These behavioral deficits are very similar to those documented in rats postnatally exposed to ethanol (Meyer et al., 1990, Thomas et al., 1996, Thomas et al., 1998, Klintsova et al., 2002, Green, 2004) and in human FASD (Streissguth et al., 1980, Roebuck et al., 1998, Coffin et al., 2005, Connor et al., 2006).
We hypothesized that ethanol exposure at an early postnatal stage negatively impacts the surviving neuronal components of the cerebellum by altering the establishment of synaptic contacts by climbing fibers onto Purkinje cells. To test this hypothesis, climbing fiber synapses were visualized in lobule I of cerebellar sections immunostained for vesicular glutamate transporter 2 (VGluT2) (Hioki et al., 2003, Miyazaki et al., 2003, Takagishi et al., 2007). Confocal z-stack images were 3D-reconstructed and quantified as the total expression intensity and the volume of expression in the soma and molecular layers, utilizing Imaris software (Bitplane AG, Zurich, Switzerland) (Hein et al., 2006, Marvizon et al., 2007, Nassimi et al., 2009).
EXPERIMENTAL PROCEDURES
Timed-pregnant Sprague-Dawley rats (Harlan) delivered pups (designated PN0) in the University of Arkansas for Medical Sciences (UAMS) Division of Laboratory Animal Medicine. All experiments were carried out in accordance with the National Institutes of Health Guide for the Care and Use of Laboratory animals. All animal care and experimental procedures were reviewed and approved by the Institutional Animal Care and Use Committee (IACUC) of UAMS prior to initiation of experimentation. This review included efforts to minimize the number of animals as well as to reduce any animal discomfort.
On PN4 rat pups of either sex were randomly assigned to one of the experimental groups (see Tables 1–2). Twenty dams were utilized to produce 28 litters of rat pups. Each experimental group was comprised of pups from at least 3 (in many cases 6 or 7) different litters (see Table 3). Ethanol exposure (E groups) was given using two dose cohorts (4.5 g/kg body weight and 3.6 g/kg body weight). Ethanol was administered one time a day, for one day on PN4, or for 3 days from PN4-6 or PN7-9. The daily ethanol dose was delivered by intragastric intubation of a 15% (w/v) ethanol solution in Intralipid-II®, as previously described (Light et al., 2002). Isocaloric vehicle control pups (C groups) were treated in an identical manner, with the substitution of an isocaloric quantity of dextrose for the ethanol. Mother reared controls (MRC) were not intubated. To accomplish the intubation process all pups (representing all groups) were removed together from the mother, weighed and kept in a warmed chamber. Pups were returned to the mother within 30–40 minutes.
Table 1.
Number of animals in each experimental group by sex - confocal data analyzed.
| E4 | E4-6 | E7-9 | C4 | C4-6 | C7-9 | MRC | ||||||||
|---|---|---|---|---|---|---|---|---|---|---|---|---|---|---|
| Sex | m | f | m | f | m | f | m | f | m | f | m | f | m | f |
| 4.5 g/kg | 4 | 4 | 4 | 3 | 4 | 3 | 5 | 3 | 3 | 4 | 2 | 5 | 5 | 5 |
| 3.6 g/kg | 6 | 4 | 5 | 4 | 3 | 3 | 5 | 4 | 6 | 2 | 7 | 2 | 4 | 9 |
Table 2.
Number of animals in each experimental group by sex - PC counting data.
| E4 | E4-6 | E7-9 | C4 | C4-6 | C7-9 | MRC | ||||||||
|---|---|---|---|---|---|---|---|---|---|---|---|---|---|---|
| Sex | m | f | m | f | m | f | m | f | m | f | m | f | m | f |
| 4.5 g/kg | 4 | 2 | 3 | 3 | 4 | 1 | 2 | 3 | 3 | 3 | 2 | 4 | 4 | 5 |
| 3.6 g/kg | 4 | 2 | 5 | 1 | 2 | 4 | 4 | 2 | 4 | 2 | 1 | 5 | 2 | 4 |
Table 3.
Number of litters represented within the experimental groups (PC counting).
| E4 | E4-6 | E7-9 | C4 | C4-6 | C7-9 | MRC | |
|---|---|---|---|---|---|---|---|
| 4.5 g/kg | 7 (3) | 7 (6) | 5 (5) | 5 (4) | 7 (6) | 7 (6) | 10 (9) |
| 3.6 g/kg | 6 (4) | 7 (6) | 4 (4) | 5 (5) | 6 (4) | 7 (4) | 14 (6) |
Blood ethanol levels (BEC) were determined from separate groups of pups for both ethanol doses. On PN4, pups were given a single ethanol dose, then analyzed 2.5 hours later. The animals were quickly decapitated and trunk blood was collected for analysis using head-space gas chromatography with flame-ionization detection per our established procedures (Ge et al., 2004).
PN14 was chosen for analysis of the density and distribution of climbing fibers since these fibers innervate the Purkinje soma up to this time period, and become redistributed primarily around the Purkinje cell dendrites after this date (Lopez-Bendito et al., 2001, Sotelo, 2004, Sugihara, 2006). Gene deletions altering glutamate receptors result in abnormal multiple climbing fiber innervations of the Purkinje cells, and also produce ataxia and motor discoordinations such as that seen in animals exposed to ethanol developmentally (Ichise et al., 2000, Klintsova et al., 2002, Green, 2004). Thus it was hypothesized that abnormal climbing fiber distribution could be detected at PN14, since normal climbing fiber innervation would be shifted away from the soma at that time.
On PN14, rat pups were processed for the collection of the cerebellum to be analyzed by confocal microscopy. After an intraperitoneal injection of 50 mg/kg pentobarbital, intracardial perfusion with 0.05% heparin/0.9% NaCl was followed by 4% paraformaldehyde-lysine-periodate fixative (PLP), pH 7.4 (Pierce et al., 2006). The cerebella were removed and post-fixed in PLP at 4oC overnight then cryoprotected with 30% sucrose in phosphate buffered saline (PBS), pH 7.4, and stored at 4oC. Mid-vermal sections (60 μm thick) were prepared by cryostat sectioning and stored free floating in 0.1M glycine/PBS with 0.02% Microcide. Additional mid-vermal sections from the 4.5 g/kg groups were cut at 10 μm and collected on glass slides for cell counting.
Tissue was prepared for confocal imaging using immunofluorescence techniques. Monoclonal antibody to calbindin-D28k (CalB; 1:5,000, clone CB955, Sigma Chemical Co.) was utilized to selectively identify Purkinje cells including their somas and dendritic structures (Light et al., 2002). Antibody to vesicular glutamate transporter 2 (VGluT2; 1:5,000, AB5907, Chemicon, Millipore Corp.) was used to visualize glutamate transporters within the climbing fibers (Hioki et al., 2003, Miyazaki et al., 2003, Takagishi et al., 2007). Tissue was double-labeled with antibodies to CalB and VGluT2. Appropriate secondary antibodies (Alexa Fluor 594, Molecular Probes; Fluorescein conjugated affinity purified secondary, Millipore Corp.) were utilized to label Purkinje cells which were visible with fluorescence microscopy as red, and the climbing fibers as green.
Cell counts for the low dose ethanol group (3.6 g/kg) were accomplished using the mid-vermal sections prepared for confocal imaging. All Purkinje cells in lobule I in a single plane of focus were counted. For the high dose ethanol group (4.5 g/kg), a mid-vermal tissue section (cut at 10 μm) was prepared for cell counting also using immunohistochemical techniques to visualize Purkinje cells. Monoclonal antibody to calbindin-D28k (CalB; 1:500, clone CB955, Sigma Chemical Co., St. Louis, MO) was used to selectively identify Purkinje cells, coupled with 3,3 -diaminobenzidine (DAB, Vector Laboratories) (Light et al., 2002). Cell counting was done using a Zeiss Axioskop (Carl Zeiss, Thornwood, NY). One mid-vermal section of the cerebellum from each rat pup in the treatment groups was analyzed (Light et al., 2002).
Confocal image z-stacks were obtained from mid-sagittal slices of the lobule I region, most adjacent to lobule X. Lobule I was chosen because Purkinje cell loss in that lobule is greater than in any of the other lobules (Pierce et al., 1989, Bonthius and West, 1990, Pierce et al., 1993). The sampling area was approximately 250 X 500 microns in each tissue. Although the total sample volume would vary between individual animals, the average group volumes were statistically similar (data not shown). All tissues from each of the experimental and control groups, within each ethanol dose were stained together as a cohort to ensure that the immunofluorescent staining was comparable across samples. In addition the confocal image acquisition from each dose (and staining) cohort was conducted so that all samples were imaged using consistent settings for laser power and detector gain.
The confocal images were collected from a Zeiss Pascal confocal microscope with a 20x objective using the following parameters. Resolution was set at 512 X 512 pixels with 12 bit color. Multitrack settings were used with a 543 nm HeNe laser and a 488 nm argon laser. The optical slice was set at 2.0 microns with the slice thickness at 0.75 microns. This oversampling in the z-axis improved the resolution in that axis. Four scans were made per line with the mean of the signal recorded. The pinhole was set at 1 Airy unit.
One confocal image stack represented the data for one pup within a treatment group. The confocal acquired z-stacks were reconstructed into 3D image projections using the Imaris software (Bitplane AG, Zurich, Switzerland). This software allowed the construction of an isosurface for each fluorescent channel (calbindin-D28k and VGluT2) that reflected the total intensity of expression and the total tissue volume that contains the expression (Hein et al., 2006; Marvizon et al., 2007). These isosurface constructions were divided into the Soma region and the molecular layer (MolLay) region.
Within each specific region of interest, the analysis of climbing fiber development as measured by VGluT2 immunostaining was determined as the summed intensity or volume of each voxel of the VGluT2 channel in the region. The intensity was interpreted as a measure of the total expression level of that protein and the volume represents the size of the tissue compartment expressing the protein. Since the region-of-interest volumes varied from animal to animal, we divided the summed VGluT2 intensity or summed VGluT2 volume by the total volume of the calbindin-D28k channel in order to normalize the data and obtain the VGluT2 intensity or volume per micron3 of Purkinje cell tissue. These two end-points were termed VGluT2 Intensity Ratio, and VGluT2 Volume Ratio (Table 4). The Imaris software also allowed the construction of a channel that includes only those voxels that contained both red and green fluorescence and was termed the co-localized channel. As described above the summed volume or intensity of the co-localized voxels in each region of interest were divided by the total volume of the calbindin-D28k channel in order to normalize these measures to the volume of Purkinje cell tissue. These two end-points were termed Co-localized Intensity Ratio and Co-localized Volume Ratio (Table 4). We have interpreted the co-localized end-points as representing the portion of the climbing fiber tissue that had made putative functional contacts with Purkinje cells.
Table 4.
Definition of Image Analysis End-Points.
| VGluT2 Intensity Ratio | VGluT2 intensity/calbindin-D28k volume |
| VGluT2 Volume Ratio | VGluT2 channel volume/calbindin-D28k volume |
| Co-localized Intensity Ratio | Co-localized intensity/calbindin-D28k volume |
| Co-localized Volume Ratio | Co-localized channel volume/calbindin-D28k volume |
Each of these four endpoints was determined in the Soma and Molecular Layer regions of interest of each tissue sample independently and in a blind-to-treatment manner. Two other end-points, pup weight on PN14 (PN14Weight) and PC number, were also part of this study.
Statistical analysis first involved a preliminary analysis of variance (ANOVA) including only the four control groups (MRC, C4, C4-6, C7-9). This analysis served as a test of data consistency and to ensure there were no control group differences of relevance. The analysis for treatment specific alterations involved ANOVA including all seven treatment groups at both doses with adjustments for sex. If significance at the 5% level was identified then custom contrasts of interest were performed within dose cohorts. Bonferroni multiple contrast methods were applied to control for type I error. The five custom contrasts of interest were: E4 vs C4 or E7-9; E4-6 vs C4-6 or E7-9; and E7-9 vs C7-9. Importantly, since both male and female pups were used in these experiments we included sex as a variable and adjusted the data accordingly. All statistical analyses were conducted using SAS software (SAS Institute) and graphs were constructed using Prism (Graph Pad, Inc.) software.
RESULTS
BECs
The mean BECs for the lower dose ethanol group (3.6 g/kg) was 242.0 ± 18.9 mg/dl (± SEM) (n = 5). The mean BECs for the higher dose ethanol group (4.5 g/kg) was 365.4 ± 38.6 mg/dl (± SEM) (n = 7).
BODY WEIGHT DATA
The body weights of the rat pups at PN14 were analyzed for each group (Figure 1). The analyses identified a significant main effect of treatment (F(6,99)=6.524, p<0.001). Custom contrasts identified significant differences within the 3.6 g/kg dose cohort for E7-9 compared to C7-9 or E4. Within the 4.5 g/kg dose cohort significant differences were identified for the E7-9 compared to the E4 group. In addition, no significant impact of sex was identified (F(1,99)=0.002). Males weighed 31.69 ± 0.42 grams and females weighed 31.66 ± 0.48 grams. A difference between means of 1.85 grams was detectible with 80% power in these analyses. The decreased mass of the E7-9 groups were not a major influence on the other end points analyzed as the E7-9 groups in other measurements generally mirrored the control groups.
Figure 1.
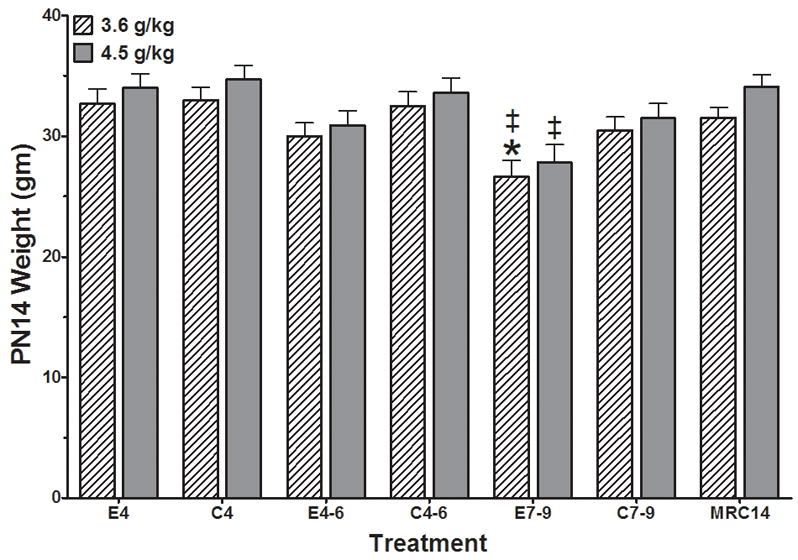
Body weights of PN14 pups following ethanol exposure at two dose levels (3.6 g/kg and 4.5 g/kg) during the early postnatal period. Analyses identified a significant main effect of treatment (F(6,99)=6.524, p<0.001) and dose (F(1,99)=4.91, p<0.03). Custom contrasts at the p<0.05 level identified significant differences within the 3.6 g/kg dose cohort for E7-9 vs C7-9 (*), and E4 (‡); and within the 4.5 g/kg dose cohort for E7-9 vs E4 (‡). No significant impact of sex was identified (F(1,99)=0.002). MRC14 = mother reared control group; C4, C4-6, C7-9 = Isocaloric vehicle control groups for PN4, PN4-6, and PN7-9, respectively; E4, E4-6, E7-9 = Ethanol exposure on PN4, PN4-6, and PN7-9, respectively.
CELL COUNT DATA
As expected, ethanol exposure (E4, E4-6) significantly reduced the number of Purkinje cells in lobule I (Figure 2). The analyses identified a significant main effect of treatment (F(6,70)=4.593, p=0.0005). Custom contrasts (p<0.05) identified significant differences within the 3.6 g/kg dose cohort for E4 and E4-6 vs E7-9; and within the 4.5 g/kg dose cohort for E4 and E4-6 vs their respective controls (C4 and C4-6). No consistent sex effects were identified (F(1,70)=0.080). For the analysis of sex differences our observed variance and 80% power allows us to detect a mean difference of 6 cells.
Figure 2.
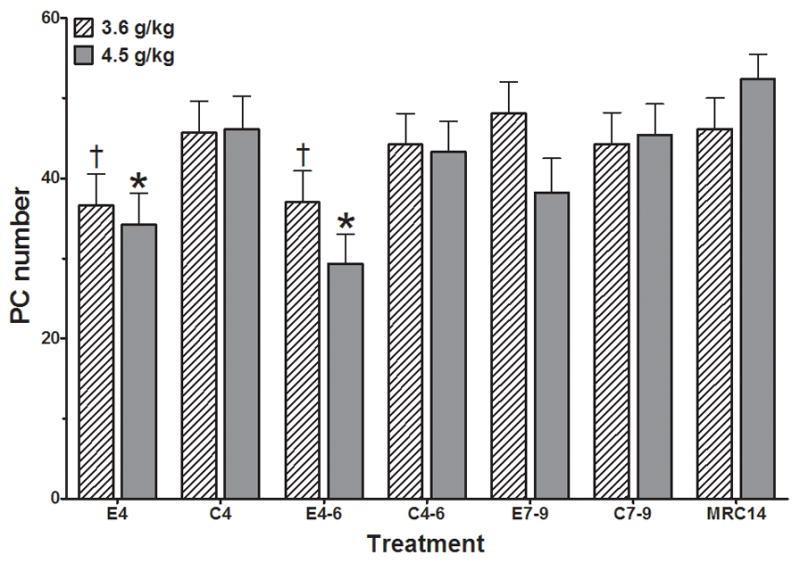
Purkinje cell (PC) numbers in Lobule I of PN14 pups following ethanol exposure at two dose levels (3.6 g/kg and 4.5 g/kg) during the early postnatal period. Analyses identified a significant main effect of treatment (F(6,70)=4.593, p=0.0005). Custom contrasts at the p<0.05 level identified significant differences within the 3.6 g/kg cohort for E4 and E4-6 vs E7-9 (†) and within the 4.5 g/kg cohort for E4 vs C4 (*) as well as E4-6 vs C4-6 (*). No significant impact of sex was identified (F(1,70)=0.080). MRC14 = mother reared control group; C4, C4-6, C7-9 = Isocaloric vehicle control groups for PN4, PN4-6, and PN7-9, respectively; E4, E4-6, E7-9 = Ethanol exposure on PN4, PN4-6, and PN7-9, respectively.
CLIMBING FIBER ANALYSIS
Calbindin-D28k positive immunofluorescent labeling was used to identify Purkinje cells and concurrent VGluT2 positive immunofluorescent labeling was used to identify olivary climbing fiber distribution to Purkinje cells in lobule I. Figure 3 shows the rendered Imaris image with each channel shown independently (A. CalB, B. VGluT2) and merged (C).
Figure 3.
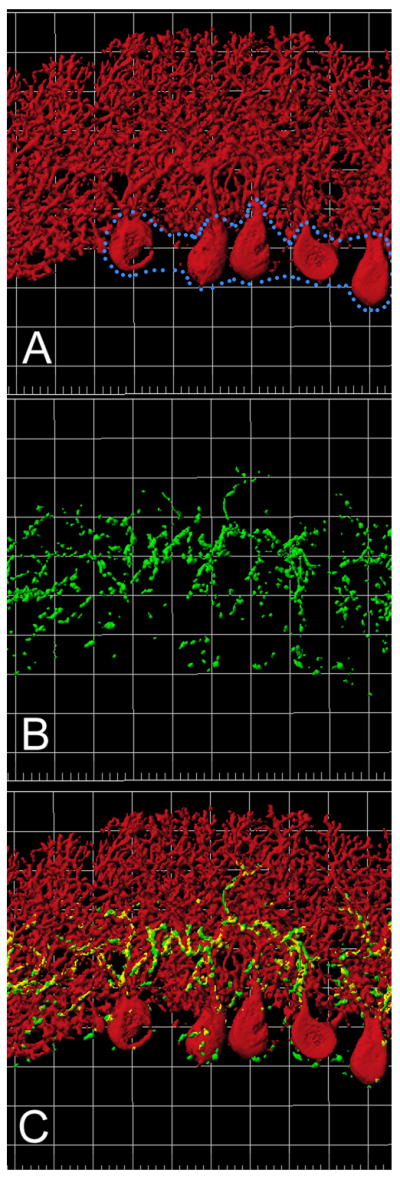
Rendered images of Lobule I Purkinje cells with VGluT2/climbing fiber innervation. Images were produced using Imaris software. A: Rendered image of the calbindin-D28k immunostaining demonstrating cerebellar Purkinje cells. Note that the soma layer is outlined in blue. The background squares are 20 microns per side. B: Rendered image of the VGluT2 immunostaining. This represents the VGluT2 positive portion of the climbing fibers from the inferior olive. C: Combined red and green channels showing the interactions of the Purkinje cells with the climbing fibers.
Analyses were conducted in the MolLay region (Figure 4) and the Soma region (Figure 5) independently. In the MolLay region alterations were seen only for the E4 and E4-6 experimental groups at the 4.5 g/kg dose level. Figure 4A presents the VGluT2 Intensity Ratio (Table 4), where a significant treatment x dose interaction was identified (F(6, 99)=4.772; p=0.0003). E4 and E4-6 groups only at the 4.5 g/kg dose level were significantly reduced compared to their respective controls (C4 and C4-6), as well as to their respective E7-9 group. No significant impact of sex was identified (F(1,99)=0.003).
Figure 4.

Alterations in Climbing Fiber endings in the Molecular Layer of Lobule I on PN14 following ethanol exposure at two dose levels (3.6 g/kg and 4.5 g/kg) during the early postnatal period. MRC14 = mother reared control group; C4, C4-6, C7-9 = Isocaloric vehicle control groups for PN4, PN4-6, and PN7-9, respectively; E4, E4-6, E7-9 = Ethanol exposure on PN4, PN4-6, and PN7-9, respectively. Staining and confocal image acquisition was completed as two cohorts by ethanol dose.
A. VGlut2 expression intensity relative to total PC tissue volume (VG2 Intensity-Ratio). There were no significant control group differences (F(3, 62)=0.75) that impact the conclusions. Treatment analyses identified a significant treatment x dose interaction (F(6, 99)=4.772; p<0.0003). Custom contrasts at the p<0.05 level identified significant differences only within the 4.5 g/kg dose cohort for E4 vs C4 (*) and E7-9 (†) and E4-6 vs C4-6 (*) and E7-9 (†). No significant impact of sex was identified (F(1,99)=0.003).
B. Co-localized expression intensity relative to total PC tissue volume (Co-localized Intensity-Ratio). There were no significant control group differences (F(3, 62)=1.30) that impact the conclusions. Treatment analyses identified a significant treatment x dose interaction (F(6, 99)=3.343; p<0.005). Custom contrasts at the p<0.05 level identified significant differences only within the 4.5 g/kg dose cohort for E4 vs C4 (*) and E7-9 (†)and for E4-6 vs C4 -6(*) and E7-9 (†). No significant impact of sex was identified (F(1,99)=0.259).
C. VGlut2 expression volume relative to total PC tissue volume (VG2 Volume-Ratio).There was a significant difference within the control groups (F(3, 62)=3.92; p<0.02). This difference is between the lowest group value C7-9 (0.144±0.017) compared to the MRC14 (0.211±0.015) and C4 (0.214±0.017) values. These differences do not impact the conclusions or interpretation of the effects of ethanol treatment in this study. Treatment analyses identified a significant treatment x dose interaction (F(6, 99)=6.313; p<0.001). Custom contrasts at the p<0.05 level identified significant differences only within the 4.5 g/kg dose cohort for E4 vs C4 (*) and E7-9 (†), and E4-6 vs C4-6 (*) and E7-9 (†). No significant impact of sex was identified (F(1,99)=3.08; p=0.082).
D. Co-localized expression volume relative to total PC tissue volume (Co-localized Volume-Ratio). There were no significant control group differences (F(3, 62)=1.27) that impact the conclusions. Treatment analyses identified a significant treatment x dose interaction (F(6, 99)=2.238; p<0.05). Custom contrasts at the p<0.05 level identified significant differences only within the 4.5 g/kg dose level for E4 vs E7-9 (†), E4-6 vs E7-9 (†), and E7-9 vs C7-9 (*). No significant impact of sex was identified (F(1,99)=2.174; p=0.14).
Figure 5.

Alterations in Climbing Fiber endings in the Soma region of Lobule I on PN14 following ethanol exposure at two dose levels (3.6 g/kg and 4.5 g/kg) during the early postnatal period. MRC14 = mother reared control group; C4, C4-6, C7-9 = Isocaloric vehicle control groups for PN4, PN4-6, and PN7-9, respectively; E4, E4-6, E7-9 = Ethanol exposure on PN4, PN4-6, and PN7-9, respectively. Staining and confocal image acquisition was completed as two cohorts by ethanol dose.
A. VGlut2 expression intensity relative to total PC tissue volume (VG2 Intensity-Ratio). There were no significant control group differences (F(3, 62)=1.618; p=0.19) that impact the conclusions. Treatment analyses identified a significant main effect of treatment (F(6, 99)=2.971; p=0.0104). Custom contrasts at the p<0.05 level identified significant differences only within the 4.5 g/kg dose cohort for E4 vs C4 (*). No significant impact of sex was identified (F(1,99)=0.0011).
B. Alterations in the Colocalized expression intensity relative to total PC tissue volume (Colocalized Intensity-Ratio). There were no significant control group differences (F(3, 62)=0.7354) that impact the conclusions. Treatment analyses identified a significant treatment x dose interaction (F(6, 99)=2.650; p=0.020). Custom contrasts at the p<0.05 level identified significant differences within the 4.5 g/kg dose cohort for E4 vs C4 (*) and E7-9 (†), as well as E4-6 vs E7-9 (†), and E7-9 vs C7-9 (*). No significant impact of sex was identified (F(1,99)=0.8718).
C. Alterations in the VGlut2 expression volume relative to total PC tissue volume (VG2 Volume-Ratio). There was a significant difference within the control groups (F(3, 62)=4.714; p=0.005). This difference is between the C7-9 group (0.162±0.021) compared to the C4 group (0.246±0.020) or the MRC14 group (0.254±0.018. These differences do not impact the conclusions or interpretation of the effects of ethanol treatment in this study. Treatment analyses identified a significant treatment x dose interaction (F(6, 99)=3.952; p=0.002). Custom contrasts at the p<0.05 level identified significant differences only within the 4.5 g/kg dose level for E4 vs C4 (*) and E7-9 (†) and for E4-6 vs the E7-9 group (†). No significant impact of sex was identified (F(1,99)=1.308; p=0.255).
D. Alterations in relative Colocalized expression volume relative to total PC tissue volume (Colocalized Volume-Ratio). There were no significant control group differences (F(3, 62)=0.597) that impact the conclusions. Treatment analyses identified significant treatment x dose interaction (F(6, 99)=2.487; p=0.028). Custom contrasts at the p<0.05 level identified significant differences only within the 4.5 g/kg dose level for E4 and E4-6 vs E7-9 (†), as well as E7-9 vs C7-9 (*). No significant impact of sex was identified (F(1,99)=2.380; p=0.126).
For the VGluT2 Volume Ratio (see Figure 4C) a significant treatment x dose interaction was also identified (F(6, 99)=6.313; p<0.001). Only the E4 and E4-6 groups given the 4.5 g/kg dose were significantly different from their respective controls (C4, C4-6), as well as their respective E7-9 group. No significant impact of sex was identified (F(1,99)=3.08; p=0.082).
Of the total VGluT2 immunostaining that was found in the molecular layer of the cerebellar cortex of lobule I, a much smaller proportion of this staining was actually co-localized with Purkinje cells. These data are presented in Figures 4B and 4D. The Co-localized Intensity Ratio (Figure 4B) showed a significant treatment x dose interaction (F(6, 99)=3.343; p<0.005) that revealed significant reductions within the 4.5 g/kg dose cohort for the comparisons of the E4 and E4-6 groups with their respective controls (C4, C4-6) and their respective E7-9 group. No significant impact of sex was identified (F(1,99)=0.259).
For the Co-localized Volume Ratio (Figure 4D), analyses identified significant treatment x dose interaction (F(6, 99)=2.238; p<0.05). Significant differences were identified within the 4.5 g/kg dose cohort for E4 and E4-6 vs E7-9 and for the E7-9 vs C7-9 groups. No significant impact of sex was identified (F(1,99)=2.174; p=0.14).
Analyses in the Soma region are shown in Figure 5. The VGluT2 Intensity Ratio (Figure 5A), demonstrated a significant main effect of treatment (F(6, 99)=2.971; p=0.0104). Custom contrasts (p<0.05) identified significant difference only within the 4.5 g/kg dose cohort for E4 vs C4. No significant impact of sex was identified (F(1,99)=0.0011).
Analysis of the VGluT2 Volume Ratio (Figure 5C) showed a significant treatment x dose interaction (F(6, 99)=3.952; p=0.002). Significant reductions were identified only within the 4.5 g/kg dose cohort for the E4 vs C4 and E7-9 groups as well as the E4 and E4-6 vs E7-9 comparisons. No significant impact of sex was identified (F(1,99)=1.308; p=0.255).
Analysis of the Co-localized Intensity Ratio (Figure 5B) within the Soma revealed a significant treatment x dose interaction (F(6, 99)=2.650; p=0.020). Significant group differences were identified only within the 4.5 g/kg dose cohort where the E4 group was significantly reduced compared to the respective C4 and E7-9 groups. Likewise the E4-6 group was significantly reduced compared to the respective E7-9 group which was significantly increased compared to the respective C7-9 group. No significant impact of sex was identified (F(1,99)=0.8718).
Analysis of the Co-localized Volume Ratio in the Soma region (Figure 5D) indicated a significant treatment x dose interaction (F(6, 99)=2.487; p=0.028). Group differences revealed significant reductions within the 4.5 g/kg dose cohort for the E4 and E4-6 groups compared to the respective E7-9 group; and for the E7-9 group which showed a significant increase over the respective C7-9 group. No significant impact of sex was identified (F(1,99)=2.380; p=0.126).
DISCUSSION
This study reveals a significant impact of timed ethanol exposures on the developing cerebellar cortical network beyond the already well characterized loss of Purkinje neurons. When a higher ethanol exposure was utilized (50% increase in BEC), the magnitude of Purkinje neuron apoptotic loss was not increased; however, the neurons that survived this higher exposure showed a significant decrease in climbing fiber innervation from the inferior olive that remains temporally concordant with the ethanol-induced apoptosis. This decrease is evidenced by a reduction in the total developing climbing fiber terminal innervation and a reduction in the actual innervating contacts as measured by the co-localization of VGluT2 and CalB. The interpretation that these alterations are not simply reflective of Purkinje cell loss is based on our normalization of the measured climbing fiber metrics to the volume of Purkinje neurons that survived the ethanol exposure. Validation of this view is sustained by the lack of climbing fiber alterations in the lower dose groups even though Purkinje cell loss was significant.
It has been previously shown that VGluT2 immunoreactivity represents the nerve terminals of the climbing fibers from the inferior olive. There are two main glutamate transporters in the cerebellar cortex, VGluT1 and VGluT2 (Hioki et al., 2003). Parallel fibers from granule cells in adult animals express VGluT1 (Hioki et al., 2003, Miyazaki et al., 2003). In contrast, climbing fiber terminals consistently exhibit VGluT2 immunoreactivity in the molecular layer and in the Purkinje cell soma layer (Hioki et al., 2003, Miyazaki et al., 2003, Takagishi et al., 2007). Furthermore, VGluT1 and VGluT2 localize only to nerve terminals, and not to cell bodies or dendrites (Fremeau et al., 2004).
There can be changes and even switching of VGluT expression during development, depending on the timing and the area of the central nervous system analyzed (Boulland et al., 2004). In the mouse cerebellum, the parallel fiber terminals express VGluT2 immunoreactivity during the first 10 postnatal days (Miyazaki et al., 2003). During the second 10 postnatal days, VGluT2 in the parallel fibers is replaced by VGluT1 starting from deep regions of the molecular layer and moving towards the pial surface, correlating with the dendritic translocation of the climbing fibers (Miyazaki et al., 2003). Climbing fiber terminals, however, will consistently express VGluT2 immunoreactivity throughout all of postnatal development (Miyazaki et al., 2003). In the present study, the rat cerebellum at PN14 expressed VGluT2 immunostaining in a pattern that was consistent only with the distribution of the climbing fibers. The only VGluT2 staining recognized for the soma and molecular layers in either the raw fluorescence images or the rendered Imaris images was located in the soma layer and the deep regions of the molecular layer (adjacent to the soma layer) and not in the portion of the molecular layer near the pial surface. Thus we concluded that all of the VGluT2 immunoreactivity in the molecular layer and the soma layer was attributed to climbing fibers originating from the inferior olive.
ETHANOL DOSE IS CRUCIAL
Purkinje cell loss was demonstrated for the two dose levels of 3.6 and 4.5 g/kg body weight. Ethanol exposure on PN4 or PN4-6 resulted in significant cell loss in the low dose and high dose groups, and no significant losses were found for the PN7-9 exposure times. Importantly, the ethanol-induced Purkinje cell loss we show in Figure 2, matches the range of developmental cell loss previously demonstrated by our laboratory and other laboratories for similar BECs (Pierce et al., 1999).
For the climbing fiber development however, the ethanol dose was crucial in determining the alterations. The higher dose paradigm (4.5 g/kg) produced significant changes, while the lower dose groups (3.6 g/kg) were not significantly affected (Figures 4 and 5). For the 4.5 g/kg ethanol exposure, significant reductions were identified in measures that reflect the volume of climbing fiber axonal endings (VGlut2 volume ratio) and likely neurotransmission effectiveness (VGluT2 intensity ratio and co-localized intensity ratio). The alterations occur in the soma layer of the Purkinje cells as well as the molecular layer for these cells. Since the data were normalized to the volume (micron3) of Purkinje cell tissue, the reductions in climbing fiber circuitry identified were independent of the loss of Purkinje cells.
In the current study the BEC levels at both doses were substantial. However, rat pups can tolerate BEC levels that are much higher than would be tolerated by humans, or the fetus. Previous studies from our laboratory employed BEC levels of 500 mg/dl or more from a single PN4 exposure without causing death in any of the rat pups (Light et al., 2002, Pierce et al., 2006). We have no information on the BEC’s reached by the human fetus; however adult humans are known to reach BECs of 400 mg/dl or more. More than 7-8% of DUI drivers recorded in one study had BEC levels greater than 300 mg/dl, and 0.3% had levels exceeding 400 mg/dl (Jones and Holmgren, 2009). In addition, at least 1% of pregnant women engaged in binge ethanol use, defined as drinking 5 or more drinks at the same time or within a couple of hours (NSDUH, 2009). Another study reported that 3.1% of pregnant women binge drink during pregnancy, with the mean number of drinks per binge at 7.2 drinks (Gladstone et al., 1997). Since, high BEC levels can clearly be obtained in pregnant women, and it is our contention that the BECs demonstrated for rat pups in the current study correspond to attainable BEC levels in humans.
ETHANOL EXPOSURE TIMING IS CRUCIAL
The timing of the ethanol exposure also plays a critical role in determining the extent of ethanol-induced developmental alterations. It is well established that in the rat, PN4-6 is a window of time during which the Purkinje cells are highly vulnerable to cell death from ethanol exposure (Hamre and West, 1993, Pierce et al., 1999, Dikranian et al., 2005). Exposure from PN7-9 results in little or no loss of Purkinje cells (Hamre and West, 1993, Pierce et al., 1999). The cell counts performed in the present study confirm this as well with significant cell loss for PN4 and PN4-6 exposures but not for PN7-9 exposure. Other regions of the CNS also exhibit vulnerable periods resulting in cell death, although with different timing compared to that in the cerebellum (Ikonomidou et al., 2000, Olney et al., 2002).
Alterations in the climbing fiber distribution also demonstrated a window or period of vulnerability. Ethanol exposure in the high dose groups only resulted in significant reductions in the VGluT2 immunostaining for exposures on PN4, or PN4-6, but not on PN7-9. The ethanol-induced alterations in climbing fiber development occurred within a specific temporal window, and this period of vulnerability coincided with the window of vulnerability for ethanol-induced Purkinje cell death (Hamre and West, 1993, Pierce et al., 1999).
Interestingly, the reductions in VGluT2 immunostaining only required one ethanol exposure to produce significant alterations. For the high dose ethanol exposure, PN4 or PN4-6 exposure protocols gave similar reductions in the amount of VGluT2 immunostaining. Previously, we showed that the loss of Purkinje neurons is complete within 24 hours after delivering a single ethanol dose on PN4 (Light et al., 2002). The present study demonstrates that a single ethanol dose on PN4 is also sufficient to reduce climbing fibers; however, we do not know if the totality of the reductions is in place by 24 hours after the ethanol exposure. This evidence suggests that a prolonged ethanol exposure is not required to induce the morphological alterations. A single alcohol dose, such as a binge drinking episode resulting in high BECs, could trigger significant alterations to the connections between the inferior olive and those Purkinje cells surviving the concurrent ethanol-induced death, depending on the timing of the insult. These data are in line with information reported by this laboratory and others that a single ethanol dose on PN4 may cause Purkinje cell death (Goodlett and Eilers, 1997, Light et al., 2002, Dikranian et al., 2005).
The postnatal ethanol exposure utilized in the current study (PN4-6) occurs while the climbing fibers are at the creeper stage (PN3-7) where one inferior olivary axon has more than 100 climbing fiber branches (Sotelo, 2004, Sugihara, 2006). The nest stage (PN7-10) involves an abrupt decrease of climbing fiber branches achieving a ratio of 10-20 branches per olivary axon (Sugihara, 2006). During the creeper and nest stages, the climbing fibers are initially concentrated around the Purkinje cell soma (Mason et al., 1990, Sugihara, 2005, Sugihara, 2006). From the nest stage the climbing fibers redistribute to the adult pattern around Purkinje cell dendrites. The climbing fiber branching is again reduced to 7 branches per climbing fiber, which then makes Purkinje cells singly innervated by one climbing fiber branch, since, in the rat, there are 7 Purkinje cells for every inferior olivary neuron (Altman and Bayer, 1997, Lopez-Bendito et al., 2001, Sotelo, 2004, Sugihara, 2006). By PN 15, normal climbing fiber development shows their extensive distribution around the proximal dendrites (Lopez-Bendito et al., 2001, Sotelo, 2004, Sugihara, 2006, Hashimoto et al., 2009). This pattern of development was sustained in the present study. There were significant reductions in the amount of VGluT2 immunostaining for the higher dose ethanol groups in the molecular layer compared to controls. However, similar magnitudes of reduction were also demonstrated for the soma layer (Figure 5), indicating that the VGluT2 loss in the molecular layer was not because the climbing fibers failed to translocate and were only accumulating in the soma layer. The VGluT2 immunostaining deficits in both the soma layer and molecular layer suggest that the climbing fibers exhibited similar ethanol-induced alterations throughout their entire terminal field.
ANALYSIS BY SEX
Our use of both sexes of rat pups in these studies was based on previous reports that sex was not a factor in ethanol-induced Purkinje cell loss during this early postnatal time frame (Bonthius and West, 1991, Goodlett and Lundahl, 1996). We therefore randomly assigned pups by sex to the experimental groups deciding later that appropriate analysis should include sex as a factor to adjust for the possibility of impact. Although we did not identify any sex-specific effects it is arguable that a more concerted assignment of pups by sex to the experimental groups would identify any sex-specific effects that may be present, although apparently not dramatic.
SUMMARY
The effects on the cerebellum of postnatal ethanol exposure are more than simply a loss of Purkinje cells. The surviving neurons have deficits involving climbing fiber-Purkinje cell connections. The VGluT2 immunoreactivity was significantly reduced in the PN14 rats implying that the potential for interaction between inferior olivary neurons and Purkinje cells has been seriously compromised. Not only were there fewer Purkinje cells following ethanol exposure, but the neurons which survived had significantly fewer contacts with significantly decreased synaptic VGluT2 components. These alterations in the synaptic integrity were both dose dependent and temporally dependent.
These data demonstrate that a brief ethanol exposure during a period of high vulnerability adversely affects afferent input to Purkinje neurons that survive after ethanol exposure. Since these neurons will constitute the entirety of the mature cerebellar cortical output, their operational status is of obvious critical importance. Specifically, our data identify a reduction in the innervation from climbing fibers to Purkinje neurons. Further analyses are necessary to understand the impact of this reduced climbing fiber input on the continued maturation and function of the cerebellar cortical network.
Acknowledgments
This work was supported by NIH grant R03AA017300 to DRP, and a grant to DRP from the UAMS Medical Research Endowment fund for the Ed Harms Family Research Award. The Zeiss Pascal confocal microscope was located at the Scanning Electron Microscope/Confocal Facility at the University of Central Arkansas, Conway, Arkansas.
LIST OF ABREVIATIONS
- FASD
fetal alcohol spectrum disorder
- PN
postnatal day
- VGluT2
vesicular glutamate transporter 2
- CalB
calbindin-D28k
- E group
ethanol exposure group
- C group
isocaloric vehicle control group
- MRC
mother reared control group
- BEC
blood ethanol concentration
- PLP
paraformaldehyde-lysine-periodate fixative
- PBS
phosphate buffered saline
- Soma
soma region of Purkinje cells
- MolLay
molecular layer of Purkinje cells
Footnotes
Publisher's Disclaimer: This is a PDF file of an unedited manuscript that has been accepted for publication. As a service to our customers we are providing this early version of the manuscript. The manuscript will undergo copyediting, typesetting, and review of the resulting proof before it is published in its final citable form. Please note that during the production process errors may be discovered which could affect the content, and all legal disclaimers that apply to the journal pertain.
Contributor Information
Dwight R. Pierce, Email: piercedwight@uams.edu, Department of Pharmaceutical Sciences, University of Arkansas for Medical Sciences, 4301 W. Markham St., #522-3, Little Rock, Arkansas 72205-7199, Phone: (501)686-5542, Fax: (501)686-6057
Abdallah Hayar, Email: AMHayar@uams.edu, Department of Neurobiology and Developmental Sciences, University of Arkansas for Medical Sciences, 4301 W. Markham St., #847, Little Rock, Arkansas 72205-7199.
D. Keith Williams, Email: WilliamsDavidK@uams.edu, Department of Biostatistics, University of Arkansas for Medical Sciences, 4301 W. Markham St., #781, Little Rock, Arkansas 72205-7199.
Kim Edward Light, Email: lightkime@uams.edu, Department of Pharmaceutical Sciences, University of Arkansas for Medical Sciences, 4301 W. Markham St., #522-3, Little Rock, Arkansas 72205-7199.
References
- Altman J, Bayer SA. Development of the cerebellar system : in relation to its evolution, structure, and functions. CRC Press; Boca Raton: 1997. [Google Scholar]
- Backman C, West JR, Mahoney JC, Palmer MR. Electrophysiological characterization of cerebellar neurons from adult rats exposed to ethanol during development. Alcohol Clin Exp Res. 1998;22:1137–1145. [PubMed] [Google Scholar]
- Bonthius DJ, West JR. Alcohol-induced neuronal loss in developing rats: increased brain damage with binge exposure. Alcohol Clin Exp Res. 1990;14:107–118. doi: 10.1111/j.1530-0277.1990.tb00455.x. [DOI] [PubMed] [Google Scholar]
- Bonthius DJ, West JR. Permanent neuronal deficits in rats exposed to alcohol during the brain growth spurt. Teratology. 1991;44:147–163. doi: 10.1002/tera.1420440203. [DOI] [PubMed] [Google Scholar]
- Boulland JL, Qureshi T, Seal RP, Rafiki A, Gundersen V, Bergersen LH, Fremeau RT, Jr, Edwards RH, Storm-Mathisen J, Chaudhry FA. Expression of the vesicular glutamate transporters during development indicates the widespread corelease of multiple neurotransmitters. J Comp Neurol. 2004;480:264–280. doi: 10.1002/cne.20354. [DOI] [PubMed] [Google Scholar]
- Coffin JM, Baroody S, Schneider K, O'Neill J. Impaired cerebellar learning in children with prenatal alcohol exposure: a comparative study of eyeblink conditioning in children with ADHD and dyslexia. Cortex. 2005;41:389–398. doi: 10.1016/s0010-9452(08)70275-2. [DOI] [PubMed] [Google Scholar]
- Connor PD, Sampson PD, Streissguth AP, Bookstein FL, Barr HM. Effects of prenatal alcohol exposure on fine motor coordination and balance: A study of two adult samples. Neuropsychologia. 2006;44:744–751. doi: 10.1016/j.neuropsychologia.2005.07.016. [DOI] [PubMed] [Google Scholar]
- Cudd TA. Animal model systems for the study of alcohol teratology. Exp Biol Med (Maywood) 2005;230:389–393. doi: 10.1177/15353702-0323006-06. [DOI] [PubMed] [Google Scholar]
- Dikranian K, Qin YQ, Labruyere J, Nemmers B, Olney JW. Ethanol-induced neuroapoptosis in the developing rodent cerebellum and related brain stem structures. Brain Res Dev Brain Res. 2005;155:1–13. doi: 10.1016/j.devbrainres.2004.11.005. [DOI] [PubMed] [Google Scholar]
- Dobbing J. The later development of the brain and its vulnerability. In: Davis JA, Dobbing J, editors. Scientific Foundations of Paediatrics. William Heinemann Medical Books; London: 1981. pp. 744–759. [Google Scholar]
- Dobbing J, Sands J. Comparative aspects of the brain growth spurt. Early Human Development. 1979;3:79–83. doi: 10.1016/0378-3782(79)90022-7. [DOI] [PubMed] [Google Scholar]
- Feddersen RM, Ehlenfeldt R, Yunis WS, Clark HB, Orr HT. Disrupted cerebellar cortical development and progressive degeneration of Purkinje cells in SV40 T antigen transgenic mice. Neuron. 1992;9:955–966. doi: 10.1016/0896-6273(92)90247-b. [DOI] [PubMed] [Google Scholar]
- Fremeau RT, Jr, Voglmaier S, Seal RP, Edwards RH. VGLUTs define subsets of excitatory neurons and suggest novel roles for glutamate. Trends Neurosci. 2004;27:98–103. doi: 10.1016/j.tins.2003.11.005. [DOI] [PubMed] [Google Scholar]
- Ge Y, Belcher SM, Pierce DR, Light KE. Altered expression of Bcl2, Bad and Bax mRNA occurs in the rat cerebellum within hours after ethanol exposure on postnatal day 4 but not on postnatal day 9. Brain Res Mol Brain Res. 2004;129:124–134. doi: 10.1016/j.molbrainres.2004.06.034. [DOI] [PubMed] [Google Scholar]
- Gladstone J, Levy M, Nulman I, Koren G. Characteristics of pregnant women who engage in binge alcohol consumption. Cmaj. 1997;156:789–794. [PMC free article] [PubMed] [Google Scholar]
- Goodlett CR, Eilers AT. Alcohol-induced Purkinje cell loss with a single binge exposure in neonatal rats: A stereological study of temporal windows of vulnerability. Alcohol Clin Exp Res. 1997;21:738–744. [PubMed] [Google Scholar]
- Goodlett CR, Horn KH, Zhou FC. Alcohol teratogenesis: mechanisms of damage and strategies for intervention. Exp Biol Med (Maywood) 2005;230:394–406. doi: 10.1177/15353702-0323006-07. [DOI] [PubMed] [Google Scholar]
- Goodlett CR, Lundahl KR. Temporal determinants of neonatal alcohol-induced cerebellar damage and motor performance deficits. Pharmacol Biochem Behav. 1996;55:531–540. doi: 10.1016/s0091-3057(96)00248-1. [DOI] [PubMed] [Google Scholar]
- Goodlett CR, Marcussen BL, West JR. A single day of alcohol exposure during the brain growth spurt induces brain weight restriction and cerebellar Purkinje cell loss. Alcohol. 1990;7:107–114. doi: 10.1016/0741-8329(90)90070-s. [DOI] [PubMed] [Google Scholar]
- Goodlett CR, Peterson SD, Lundahl KR, Pearlman AD. Binge-like alcohol exposure of neonatal rats via intragastric intubation induces both Purkinje cell loss and cortical astrogliosis. Alcohol Clin Exp Res. 1997;21:1010–1017. [PubMed] [Google Scholar]
- Green JT. The effects of ethanol on the developing cerebellum and eyeblink classical conditioning. Cerebellum. 2004;3:178–187. doi: 10.1080/14734220410017338. [DOI] [PubMed] [Google Scholar]
- Hamre KM, West JR. The effects of the timing of ethanol exposure during the brain growth spurt on the number of cerebellar Purkinje and granule cell nuclear profiles. Alcohol Clin Exp Res. 1993;17:610–622. doi: 10.1111/j.1530-0277.1993.tb00808.x. [DOI] [PubMed] [Google Scholar]
- Hashimoto K, Ichikawa R, Kitamura K, Watanabe M, Kano M. Translocation of a "winner" climbing fiber to the Purkinje cell dendrite and subsequent elimination of "losers" from the soma in developing cerebellum. Neuron. 2009;63:106–118. doi: 10.1016/j.neuron.2009.06.008. [DOI] [PubMed] [Google Scholar]
- Hashimoto K, Ichikawa R, Takechi H, Inoue Y, Aiba A, Sakimura K, Mishina M, Hashikawa T, Konnerth A, Watanabe M, Kano M. Roles of glutamate receptor delta 2 subunit (GluRdelta 2) and metabotropic glutamate receptor subtype 1 (mGluR1) in climbing fiber synapse elimination during postnatal cerebellar development. J Neurosci. 2001;21:9701–9712. doi: 10.1523/JNEUROSCI.21-24-09701.2001. [DOI] [PMC free article] [PubMed] [Google Scholar]
- Heaton MB, Moore DB, Paiva M, Madorsky I, Mayer J, Shaw G. The role of neurotrophic factors, apoptosis-related proteins, and endogenous antioxidants in the differential temporal vulnerability of neonatal cerebellum to ethanol. Alcohol Clin Exp Res. 2003;27:657–669. doi: 10.1097/01.ALC.0000060527.55252.71. [DOI] [PubMed] [Google Scholar]
- Hein S, Kostin S, Schaper J. Adult rat cardiac myocytes in culture: 'Second-floor' cells and coculture experiments. Exp Clin Cardiol. 2006;11:175–182. [PMC free article] [PubMed] [Google Scholar]
- Hioki H, Fujiyama F, Taki K, Tomioka R, Furuta T, Tamamaki N, Kaneko T. Differential distribution of vesicular glutamate transporters in the rat cerebellar cortex. Neuroscience. 2003;117:1–6. doi: 10.1016/s0306-4522(02)00943-0. [DOI] [PubMed] [Google Scholar]
- Ichise T, Kano M, Hashimoto K, Yanagihara D, Nakao K, Shigemoto R, Katsuki M, Aiba A. mGluR1 in cerebellar Purkinje cells essential for long-term depression, synapse elimination, and motor coordination. Science. 2000;288:1832–1835. doi: 10.1126/science.288.5472.1832. [DOI] [PubMed] [Google Scholar]
- Ikonomidou C, Bittigau P, Ishimaru MJ, Wozniak DF, Koch C, Genz K, Price MT, Stefovska V, Horster F, Tenkova T, Dikranian K, Olney JW. Ethanol-induced apoptotic neurodegeneration and fetal alcohol syndrome. Science. 2000;287:1056–1060. doi: 10.1126/science.287.5455.1056. [DOI] [PubMed] [Google Scholar]
- Jones AW, Holmgren A. Age and gender differences in blood-alcohol concentration in apprehended drivers in relation to the amounts of alcohol consumed. Forensic Sci Int. 2009;188:40–45. doi: 10.1016/j.forsciint.2009.03.010. [DOI] [PubMed] [Google Scholar]
- Kato Y, Takatsuki K, Kawahara S, Fukunaga S, Mori H, Mishina M, Kirino Y. N-methyl-D-aspartate receptors play important roles in acquisition and expression of the eyeblink conditioned response in glutamate receptor subunit delta2 mutant mice. Neuroscience. 2005;135:1017–1023. doi: 10.1016/j.neuroscience.2005.07.026. [DOI] [PubMed] [Google Scholar]
- Kishimoto Y, Fujimichi R, Araishi K, Kawahara S, Kano M, Aiba A, Kirino Y. mGluR1 in cerebellar Purkinje cells is required for normal association of temporally contiguous stimuli in classical conditioning. Eur J Neurosci. 2002;16:2416–2424. doi: 10.1046/j.1460-9568.2002.02407.x. [DOI] [PubMed] [Google Scholar]
- Klintsova AY, Matthews JT, Goodlett CR, Napper RM, Greenough WT. Therapeutic motor training increases parallel fiber synapse number per Purkinje neuron in cerebellar cortex of rats given postnatal binge alcohol exposure: preliminary report. Alcohol Clin Exp Res. 1997;21:1257–1263. [PubMed] [Google Scholar]
- Klintsova AY, Scamra C, Hoffman M, Napper RM, Goodlett CR, Greenough WT. Therapeutic effects of complex motor training on motor performance deficits induced by neonatal binge-like alcohol exposure in rats: II. A quantitative stereological study of synaptic plasticity in female rat cerebellum. Brain Res. 2002;937:83–93. doi: 10.1016/s0006-8993(02)02492-7. [DOI] [PubMed] [Google Scholar]
- Light KE, Belcher SR, Pierce DR. Time course and manner of Purkinje neuron death following a single ethanol exposure on postnatal day 4 in the developing rat. Neuroscience. 2002;114:327–337. doi: 10.1016/s0306-4522(02)00344-5. [DOI] [PubMed] [Google Scholar]
- Lopez-Bendito G, Shigemoto R, Lujan R, Juiz JM. Developmental changes in the localisation of the mGluR1alpha subtype of metabotropic glutamate receptors in Purkinje cells. Neuroscience. 2001;105:413–429. doi: 10.1016/s0306-4522(01)00188-9. [DOI] [PubMed] [Google Scholar]
- Martin LA, Escher T, Goldowitz D, Mittleman G. A relationship between cerebellar Purkinje cells and spatial working memory demonstrated in a lurcher/chimera mouse model system. Genes Brain Behav. 2004;3:158–166. doi: 10.1111/j.1601-183x.2004.00067.x. [DOI] [PubMed] [Google Scholar]
- Marvizon JC, Perez OA, Song B, Chen W, Bunnett NW, Grady EF, Todd AJ. Calcitonin receptor-like receptor and receptor activity modifying protein 1 in the rat dorsal horn: localization in glutamatergic presynaptic terminals containing opioids and adrenergic alpha2C receptors. Neuroscience. 2007;148:250–265. doi: 10.1016/j.neuroscience.2007.05.036. [DOI] [PMC free article] [PubMed] [Google Scholar]
- Mason CA, Christakos S, Catalano SM. Early climbing fiber interactions with Purkinje cells in the postnatal mouse cerebellum. J Comp Neurol. 1990;297:77–90. doi: 10.1002/cne.902970106. [DOI] [PubMed] [Google Scholar]
- Meyer LS, Kotch LE, Riley EP. Neonatal ethanol exposure: functional alterations associated with cerebellar growth retardation. Neurotoxicol Teratol. 1990;12:15–22. doi: 10.1016/0892-0362(90)90107-n. [DOI] [PubMed] [Google Scholar]
- Miyazaki T, Fukaya M, Shimizu H, Watanabe M. Subtype switching of vesicular glutamate transporters at parallel fibre-Purkinje cell synapses in developing mouse cerebellum. Eur J Neurosci. 2003;17:2563–2572. doi: 10.1046/j.1460-9568.2003.02698.x. [DOI] [PubMed] [Google Scholar]
- Mohamed SA, Nathaniel EJ, Nathaniel DR, Snell L. Altered Purkinje cell maturation in rats exposed prenatally to ethanol. II. Synaptology. Exp Neurol. 1987;97:53–69. doi: 10.1016/0014-4886(87)90281-0. [DOI] [PubMed] [Google Scholar]
- Mullen RJ, Eicher EM, Sidman RL. Purkinje cell degeneration, a new neurological mutation in the mouse. Proc Natl Acad Sci U S A. 1976;73:208–212. doi: 10.1073/pnas.73.1.208. [DOI] [PMC free article] [PubMed] [Google Scholar]
- Nassimi M, Schleh C, Lauenstein HD, Hussein R, Lubbers K, Pohlmann G, Switalla S, Sewald K, Muller M, Krug N, Muller-Goymann CC, Braun A. Low cytotoxicity of solid lipid nanoparticles in in vitro and ex vivo lung models. Inhal Toxicol. 2009;21:104–109. doi: 10.1080/08958370903005769. [DOI] [PubMed] [Google Scholar]
- NSDUH. The NSDUH Report: Substance Use among Women During Pregnancy and Following Childbirth. NSDUH; 2009. p. 135. [Google Scholar]
- Olney JW, Tenkova T, Dikranian K, Qin YQ, Labruyere J, Ikonomidou C. Ethanol-induced apoptotic neurodegeneration in the developing C57BL/6 mouse brain. Brain Res Dev Brain Res. 2002;133:115–126. doi: 10.1016/s0165-3806(02)00279-1. [DOI] [PubMed] [Google Scholar]
- Pierce DR, Cook CC, Hinson JA, Light KE. Are oxidative mechanisms primary in ethanol induced Purkinje neuron death of the neonatal rat? Neurosci Lett. 2006;400:130–134. doi: 10.1016/j.neulet.2006.02.025. [DOI] [PubMed] [Google Scholar]
- Pierce DR, Goodlett CR, West JR. Differential neuronal loss following early postnatal alcohol exposure. Teratology. 1989;40:113–126. doi: 10.1002/tera.1420400205. [DOI] [PubMed] [Google Scholar]
- Pierce DR, Serbus DC, Light KE. Intragastric intubation of alcohol during postnatal development of rats results in selective cell loss in the cerebellum. Alcohol Clin Exp Res. 1993;17:1275–1280. doi: 10.1111/j.1530-0277.1993.tb05241.x. [DOI] [PubMed] [Google Scholar]
- Pierce DR, Williams DK, Light KE. Purkinje cell vulnerability to developmental ethanol exposure in the rat cerebellum. Alcohol Clin Exp Res. 1999;23:1650–1659. [PubMed] [Google Scholar]
- Riley EP, McGee CL. Fetal alcohol spectrum disorders: an overview with emphasis on changes in brain and behavior. Exp Biol Med (Maywood) 2005;230:357–365. doi: 10.1177/15353702-0323006-03. [DOI] [PubMed] [Google Scholar]
- Roebuck TM, Simmons RW, Mattson SN, Riley EP. Prenatal exposure to alcohol affects the ability to maintain postural balance. Alcohol Clin Exp Res. 1998;22:252–258. [PubMed] [Google Scholar]
- Servais L, Hourez R, Bearzatto B, Gall D, Schiffmann SN, Cheron G. Purkinje cell dysfunction and alteration of long-term synaptic plasticity in fetal alcohol syndrome. Proc Natl Acad Sci U S A. 2007;104:9858–9863. doi: 10.1073/pnas.0607037104. [DOI] [PMC free article] [PubMed] [Google Scholar]
- Siler-Marsiglio KI, Paiva M, Madorsky I, Pan Q, Shaw G, Heaton MB. Functional mechanisms of apoptosis-related proteins in neonatal rat cerebellum are differentially influenced by ethanol at postnatal days 4 and 7. J Neurosci Res. 2005 doi: 10.1002/jnr.20591. [DOI] [PubMed] [Google Scholar]
- Sotelo C. Cellular and genetic regulation of the development of the cerebellar system. Prog Neurobiol. 2004;72:295–339. doi: 10.1016/j.pneurobio.2004.03.004. [DOI] [PubMed] [Google Scholar]
- Streissguth AP, Barr HM, Martin DC, Herman CS. Effects of maternal alcohol, nicotine, and caffeine use during pregnancy on infant mental and motor development at eight months. Alcohol Clin Exp Res. 1980;4:152–164. doi: 10.1111/j.1530-0277.1980.tb05630.x. [DOI] [PubMed] [Google Scholar]
- Sugihara I. Microzonal projection and climbing fiber remodeling in single olivocerebellar axons of newborn rats at postnatal days 4–7. J Comp Neurol. 2005;487:93–106. doi: 10.1002/cne.20531. [DOI] [PubMed] [Google Scholar]
- Sugihara I. Organization and remodeling of the olivocerebellar climbing fiber projection. Cerebellum. 2006;5:15–22. doi: 10.1080/14734220500527385. [DOI] [PubMed] [Google Scholar]
- Takagishi Y, Hashimoto K, Kayahara T, Watanabe M, Otsuka H, Mizoguchi A, Kano M, Murata Y. Diminished climbing fiber innervation of Purkinje cells in the cerebellum of myosin Va mutant mice and rats. Dev Neurobiol. 2007;67:909–923. doi: 10.1002/dneu.20375. [DOI] [PubMed] [Google Scholar]
- Thomas JD, Goodlett CR, West JR. Alcohol-induced Purkinje cell loss depends on developmental timing of alcohol exposure and correlates with motor performance. Brain Res Dev Brain Res. 1998;105:159–166. doi: 10.1016/s0165-3806(97)00164-8. [DOI] [PubMed] [Google Scholar]
- Thomas JD, Wasserman EA, West JR, Goodlett CR. Behavioral deficits induced by bingelike exposure to alcohol in neonatal rats: importance of developmental timing and number of episodes. Dev Psychobiol. 1996;29:433–452. doi: 10.1002/(SICI)1098-2302(199607)29:5<433::AID-DEV3>3.0.CO;2-P. [DOI] [PubMed] [Google Scholar]
- Ventura SJ, Abma JC, Mosher WD, Henshaw SK. Estimated pregnancy rates by outcome for the United States, 1990–2004. Natl Vital Stat Rep. 2008;56:1–25. 28. [PubMed] [Google Scholar]