

Abstract
Identification of the genetic basis of common traits may be hindered by underlying complex genetic architectures that are inadequately captured by existing models, including both multiallelic and multilocus modes of inheritance (MOI). One useful approach for localizing genes underlying continuous complex traits is the joint oligogenic linkage and segregation analysis implemented in the package Loki. The method uses reversible jump Markov chain Monte Carlo to eliminate the need to prespecify the number of quantitative trait loci (QTLs) in the trait model, thus providing posterior distributions for the number of QTLs in a Bayesian framework. The current implementation assumes QTLs are diallelic, and therefore can overestimate the number of linked QTLs in the presence of a multiallelic QTL. To address the possibility of multiple alleles, we extended the QTL model to allow for a variable number of additive alleles at each locus. Application to simulated data shows that, under a diallelic MOI, the multiallelic and diallelic analysis models give similar results. Under a multiallelic MOI, the multiallelic analysis model provides better mixing and improved convergence, and leads to a more accurate estimate of the underlying trait MOI and model parameter values, than does the diallelic model. Application to real data shows the multiallelic model results in fewer estimated linked QTLs and that the predominant QTL model is similar to one of two predominant models estimated from the diallelic analysis. Our results indicate that use of a multiallelic analysis model can lead to better understanding of the genetic architecture underlying complex traits.
Keywords: complex trait, MCMC, pedigree, continuous trait, Bayesian
Introduction
Linkage analysis is an invaluable tool used to identify trait loci. Parametric linkage analysis incorporating a single highly penetrant diallelic trait model has long been used, leading to successful localization of thousands of trait loci [Ott 1999; Glazier et al. 2002], including examples such as cystic fibrosis [Wainwright et al. 1985; Tsui et al. 1985; Knowlton et al. 1985; Kerem et al. 1989], monogenic forms of colorectal cancer [Bodmer et al. 1987], breast cancer [Hall et al. 1990; Wooster et al. 1994] and Alzheimer's disease [Schellenberg et al. 1992; Goate et al. 1991; Levy-Lahad et al. 1995]. However, most common traits appear to be caused by a complex web of genetic and environmental effects that are not sufficiently modeled by a single diallelic locus [Lohmueller et al. 2003; Daw et al. 2000; Glazier et al. 2002; Bourhis et al. 2007]. Such complexities include genetic heterogeneity, multiallelic inheritance, epistasis, incomplete penetrance and multiple environmental factors [Glazier et al. 2002; Ott 1999].
In order to confront the challenges inherent in complex traits, researchers have explored various study designs and have developed creative analysis and pedigree sampling methods. Although case-control study designs can be used to localize genes with common causal variants, recent investigations suggest that most of these variants have low penetrance and are difficult to detect even with thousands of individuals [Weedon et al. 2007; Visscher 2008]. In contrast, linkage analysis methods with small numbers of large families ascertained through extreme phenotypes may reduce the potential number of genes involved, reduce genetic background noise, and enrich the sample for rare, highly penetrant alleles [Wijsman and Amos 1997; Lander and Schork 1994]. In addition, quantitative trait information, rather than dichotomous information, can increase power to detect trait loci [Wijsman and Amos 1997; Knoblauch et al. 2000; Williams et al. 1997]. Within the linkage analysis framework, methods that do not require trait model parameters to be specified a priori, such as variance components linkage analysis, can have more power to detect a trait locus than methods that require a prespecified model when that model is poorly defined [Haines and Pericak-Vance 1998; Clerget-Darpoux et al. 1986; Amos 1994; Almasy and Blangero 1998]. However, these trait-model free methods have poor location resolution since they are based on pooled, rather than individual, meioses [Lynch and Walsh 1998; Atwood and Heard-Costa 2003]. Alternatively, joint segregation and linkage analysis can be more powerful and provide more accurate localization than the stepwise approach of segregation analysis followed by linkage analysis [Wijsman and Amos 1997]. However, if the trait model contains many parameters or includes a major gene component and a polygenic component, the exact likelihood is difficult or impossible to calculate when using parametric linkage analysis on large families [Guo and Thompson 1992; Thompson 2000].
One method that combines the strengths of a likelihood-based framework with a complex model is the joint oligogenic segregation and linkage analysis approach implemented in the package Loki [Heath 1997]. This oligogenic model assumes a linear relationship between a continuous phenotype and an unknown number of underlying diallelic quantitative trait loci (QTLs). The approach uses the Bayesian strategy of imposing a prior distribution on the parameter space in order to provide structure to the model without specifying details. This allows the number of QTLs to be treated as an unknown parameter, and for direct comparisons among a large number of non-nested trait models. This contrasts with a frequentist approach, which assumes a fixed number of QTLs, preferably with comparisons based on nested models. In addition, since the method incorporates a trait model, it has better location resolution than model free methods [Lynch and Walsh 1998; Atwood and Heard-Costa 2003]. Markov chain Monte Carlo (MCMC) sampling [Hastings 1970; Brooks 1998] over the model space, consistent with the observed data, provides efficient estimation of the potentially large number of parameters, avoiding the computational difficulty of maximizing or integrating over a complex likelihood. Reversible jump MCMC (RJMCMC) [Green 1995], a sampling technique that can handle multiple parameter spaces, provides estimation of the posterior distribution of the number of underlying QTLs. In addition, the implementation in Loki can incorporate a fixed number of linked markers and large families through the use of a block-Gibbs hybrid MCMC sampler, and has been used successfully in animal studies [Martinex et al. 2005] and for many human traits [Daw et al. 2000 2007; Yuan et al. 2000; Igo et al. 2006; Brkanac et al. 2008]. While this method addresses the important issue of multiple underlying loci, it does not address the possibility of multiple alleles at single trait loci.
Although diallelic QTL models have been used successfully to detect linkage for loci known to have more than two alleles [Wijsman et al. 2004; Daw et al. 1999; Devlin et al. 1998; Gagnon et al. 2003], this model assumption has some limitations. For example, use of a diallelic model to analyze Alzheimer's disease age-at-onset resulted in a biased estimate of the location of a QTL relative to the known triallelic APOE locus [Wijsman et al. 2004], and suggested the existence of two QTLs at the Presenilin 1 (PSEN1) location on chromosome 14 for families segregating different PSEN1 mutations [Daw et al. 1999]. Similarly, linkage analysis of HDL level, under a diallelic model, with a highly multiallelic marker in APOC3, gave evidence for two QTLs at the apolipoprotein A1-C3-A4-A5 complex [Gagnon et al. 2003]. One interpretation of these results is that use of a diallelic analysis model in the presence of a multiallelic underlying mode of inheritance (MOI) can lead to biased localization and estimation of the number of linked QTLs.
We present an extension to the segregation analysis component of the model used in Loki in order to allow for multiple alleles at QTLs. The approach incorporates the benefits of allowing for large families, quantitative or censored trait data, multiple linked markers, and few assumptions about the nature of the trait model complexity. We evaluate the multiallelic implementation with simulated data and demonstrate applicability to real data by performing a comparative analysis of a quantitative trait (HDL) using the current diallelic version of Loki as well as an extended version that allows for multiallelic QTLs. The multiallelic inheritance approach leads to more accurate trait model estimation and better mixing properties than does the traditional diallelic analysis model.
Methods
Trait model
The analysis method uses a linear mixed model to relate phenotype, Y, to underlying QTLs and other covariates. Although the model is explained elsewhere [Heath 1997], we include it here to facilitate explanation of the proposed extension to the model:
| (1) |
The parameters include μ, the overall baseline against which other parameters are estimated, X, the covariate matrix, β, a vector of covariate effects, Qiαi, which are the contributions for the ith QTL, i = 1,…, k, explained below, and e, Normally distributed error, with variance . In the current diallelic version of Loki, each QTL has two alleles and therefore only three genotypes. The genotype effects for QTL i are given by αi1,αi2, and αi3, where αi1 = 0 for all i, i = 1, ⋯, k. Since there is no assumed relationship between αi2 and αi3, the QTL model may exhibit dominance. The effects at each QTL i are incorporated in model (1) using the QTL genotype indicator variable Qi. In addition to the QTL model, there are several genetic parameters: the QTL genotypes, G, the marker genotypes, M, QTL allele frequencies, p, linkage groups (e.g., chromosomes or linked set of markers), λ, and positions, δ, relative to the marker map. To distinguish the concepts of the underlying, unknown truth (e.g., a true map position) from the model parameters that vary across MCMC iterations, we use the term ‘visiting QTL’ to indicate that λi = c ≠ 0; QTL i is visiting a location δi within linkage group c in an iteration in which the model includes a position on the map for QTL i.
The option introduced here allows the underlying QTLs to have more than two alleles. We distinguish this multiallelic version with the label maLoki. In order to reduce the number of parameters in the model, QTLs with three or more alleles have purely additive allelic effects, while QTLs with two alleles may include dominance. Each QTL has a type, defined by ℓ ∈ 1, …, 6, where, if ℓ = 1, the QTL has the structure found in the current version of Loki and if ℓ > 1, the QTL is completely additive with ℓ alleles. For completely additive QTLs, the genotype effects, α, are simply the sum of the constituent allele effects. If additive QTL i has ℓ ≥ 2 alleles Bi1, Bi2,⋯, Bil with effects ai1, ai2, ⋯, ail, there are possible unordered genotypes and the effect for genotype Bij1 Bij2 is equal to aij1 + aij2, where ij1 and ij2 identify the specific alleles.
Computation
Due to the complexity of model (1) and the large number of parameters to be estimated, an MCMC process is used to estimate a joint posterior distribution for the parameters. Prior distributions are chosen in order to have the least influence on the posterior distribution and are as follows: p ∼ U (0,1), , and . The user supplies prior distributions on the number of QTLs and the genetic effects. Typically, the prior distribution for the number of QTLs is a truncated Poisson distribution as this leads to quick convergence to the posterior distribution. The current prior distributions on αi2 and αi3 are independent N(0, τ2), where τ2 is chosen by the user in such a way that reasonable QTL models can be proposed, and convergence is relatively quick. Two such methods are to use a τ2 for which the average posterior number of QTLs fails to increase substantially relative to smaller values of τ2 in segregation analysis [Yu 2003] or for which the total genetic variance stabilizes as a function of increasing values of τ2 [Igo et al. 2006]. Throughout the MCMC process, samples of possible QTL model states are collected. The resulting posterior distribution obtained from the set of these states leads to inference regarding the underlying trait model.
The MCMC process is an iterative sampling technique where models, consistent with the observed data, are proposed and then accepted or rejected. One iteration involves updating each parameter, and parameter values are correlated across iterations. In the current version of Loki, Gibbs sampling steps are used to update μ, β, , α, and p [Lindley and Smith 1972; Wang et al. 1993; Heath 1997]. The number of QTLs may change in a birth/death step where the addition or removal of one QTL is proposed. Since the number of parameters in the model may change with this step, a RJMCMC move is required and the acceptance ratio incorporates the Jacobian of the transition between states [Green 1995]. In a birth, this requires first, sampling of the additive and dominance variances of the QTL and then second, a transition to the proposed genetic effects. The sampling distribution for both the additive and dominance variances ( and ), as chosen by Heath, is . In a death, the parameters of the QTL are dropped from the model. Similarly, when the linkage status, λi, of QTL i changes, a RJMCMC move is required because δi is either sampled or dropped from the model.
We expand the MCMC sampling scheme to allow for multiallelic QTLs by incorporating three changes at each iteration. The birth/death of a QTL step now allows for a completely additive QTL to be proposed. Allele frequencies for all QTLs are sampled using a Dirichlet distribution, which is a multivariate extension of the Beta distribution currently used by the diallelic version of Loki. Finally, Gibbs sampling is used to update the allele effects at completely additive QTLs, with the resulting genotype effects calculated from these values. Details related to the MCMC sampling can be found in the appendix.
When the birth of QTL i is proposed, the type of QTL, ℓ, is sampled from the discrete uniform (1,6) distribution. If ℓ > 1, random variables , l = 2, ⋯ ℓ are sampled from , as in the current version, and the pi are sampled from the uniform Dirichlet distribution. Assuming only two alleles (1 and l) exist at the QTL, the additive variance equations
| (2) |
can be used to calculate the allele effects via their inverse:
| (3) |
The remaining procedures are the same as that for the current version of Loki. The proposal is accepted or rejected based on the Metropolis-Hastings [Metropolis et al. 1953; Hastings 1970] acceptance ratio (appendix), and if accepted, genotypes for each individual at QTL i are sampled. We verified that the changes to the MCMC sampling in maLoki are correct by checking for convergence to the prior distribution when used to analyze uninformative data: a single individual without marker or phenotype information (supplementary material).
Simulated Data
We used twenty replicates of simulated multiallelic trait data in order to evaluate properties of the multiallelic implementation. We simulated highly informative phenotype data on a large pedigree in order to reduce the run time for each simulation and to ensure that linkage would be detectable. We used one 98-member, four-generation pedigree (figure 1), which is sufficiently large to detect linkage and to estimate the large number of trait model parameters. With 32 founders, multiple alleles may segregate at the trait gene within the pedigree. We used Genedrop [Thompson et al. 2007] to simulate multiple replicates of a chromosome with four markers, spaced 10 cM apart, and a 6 allele trait gene in the center of the chromosome. We rejected any simulated data set for which the trait gene allele frequencies differed markedly from uniformity, based on a Chi-squared goodness of fit test with a conservative significance level of 0.5, ensuring that the resulting data sets truly contain 6 alleles segregating at the trait gene. There was no missing marker data and we incorporated complete marker inheritance vector information into the analysis in the form of fully informative markers. This scheme leads to two benefits: fully informative markers supply the same information as a dense set of SNPs [Wijsman et al. 2006] and the only difference in the analysis across replicates should be due to the stochastic differences in the trait genotype and phenotype simulations, and the positions and number of recombinant events. We also note that the goal of the current study was to evaluate the multiallelic trait model, and not that of choice of marker panel. Choice of marker panel, including use of modern dense SNP panels, has been discussed elswhere. This includes demonstration of accuracy and efficacy of dense SNP panels in the context of both exact and MCMC-based analysis, along with identification of strategies that yield accurate results without excessive computation in the presence of inter-marker linkage disequilibrium [Wijsman et al. 2006; Wilcox et al. 2005; Daw et al. 2005; Wijsman et al. 2007]. We used R [R Development Core Team 2007] to simulate error terms, ej, for each individual j from where . We calculated the trait data, Yj, assuming the 6 alleles have effects a = 0, 1, ⋯, 5 using Yj = αj + ej, where αj is the genotype effect at the trait gene for individual j. The resulting trait distribution has a heritability of 0.9.
Figure 1.
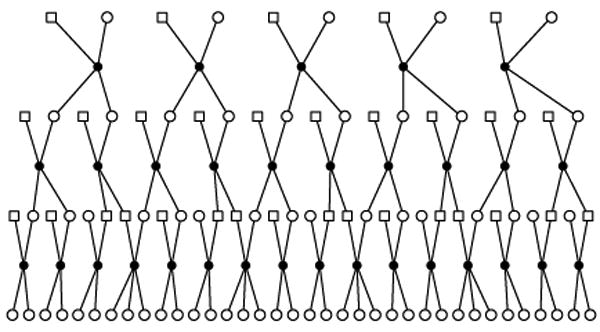
Pedigree used for simulated data.
We analyzed each replicate with Loki and maLoki using the same run parameters. We used , since past experience indicates that three times the true additive variance is a sufficiently large value for τ2. We used a truncated Poisson prior distribution on the number of QTLs, with mean 1 and maximum 15. The chromosome length was 60 cM and the entire map length was 3000 cM. Each run lasted 50,000 iterations, with an initial burn in of 1000 iterations. We saved every 50th iteration, resulting in a sample size of 1000 iterations. In order to evaluate convergence of the trait model under a diallelic analysis model, we ran Loki twice more on two replicates using 30 times as many iterations (long runs), saving every 300th iteration. We chose this run length so that the CPU run time using Loki would be equivalent to the run time using maLoki with only 50,000 iterations.
For comparison, we evaluated convergence of both analysis models when the trait had lower heritability or only two alleles at the gene. We transformed the phenotype data for one data replicate in two ways. First, we reduced the heritability of the trait to 0.6 by increasing the error term for each individual by a factor of 3/2 and calculating the phenotype, , where . In this case, we analyzed the data using τ2 = 10.35. Second, we created a diallelic underlying gene with h2 = 0.82 by grouping allele effects, ( , ) and calculating phenotypes, .
We evaluated both analysis models for their ability to detect linkage and their accuracy in estimating trait model summaries such as the allele frequency and genotype effects. To assess the linkage signal, we calculated the probability ratio (PR) for linkage: PR = q1/q0, where q0 is the prior probability of linkage and q1 is the posterior probability of linkage defined as:
| (4) |
with larger PR providing more evidence for linkage. We chose this statistic because it depends only on the number of iterations where there exists at least one visiting QTL, but not on the posterior distributions of the number of total and visiting QTLs, which differ between the diallelic and multiallelic analysis models. This ensures that comparisons of the evidence for linkage obtained from Loki and maLoki are as fair as possible.
In addition, we estimated the posterior distribution for the trait model. This includes the total number of QTLs, k, the number of visiting QTLs, as well as their position δ, genotype effects, α, and allele frequencies, p. We used the average position over all visiting QTLs to estimate the linkage position δ̂ and defined the bias (B) in position as the difference between the true position and δ̂, B = δ̂ − 30. To compare the contributions of individual QTLs to the genetic variance, we calculated the size, Si, for each QTL i at each iteration:
| (5) |
where n is the sample size of individuals with phenotype information, m is the overall phenotypic mean, mig is the phenotypic mean for genotype ig, and nig is the number of phenotyped individuals with genotype ig at that iteration.
Real Data
In order to compare the estimated posterior distribution of visiting QTLs from Loki and maLoki on a real data set when the underlying model is unknown, we analyzed a data set [Devlin et al. 1998] that was also analyzed previously with the standard diallelic model used in Loki [Gagnon et al. 2003]. The data set includes 8 pedigrees consisting of 216 individuals, of whom 163 have complete HDL trait, age and genotype for one multiallelic marker in the APOC3 gene. Since APOC3 is part of a tight cluster of apolipoprotein genes, for which there is evidence of functional variation associated with lipid levels [Hayden et al. 1987; Dedoussis 2007], including HDL [Devlin et al. 1998; Gagnon et al. 2003], there may be multiple alleles defined by haplotypes or multiple loci across the region, in addition to locus heterogeneity. In this data set, APOC3 has a high heterozygosity of 0.94, so that the information contained in the inheritance vectors should approximate that of a dense set of SNPs at that region. The analysis performed previously [Gagnon et al. 2003], using an older version of Loki, indicated the possibility of two linked QTLs at APOC3. Since the QTL model only assumed diallelic QTLs, another interpretation of these results is that there is a multiallelic QTL linked to APOC3 that effects HDL levels and is being modeled by multiple, diallelic QTLs. We used the same analysis conditions used previously so that comparisons can be made to the analysis with a previous version of Loki [Gagnon et al. 2003], in addition to the comparisons made here. We compared the posterior distributions of the number of visiting QTLs, their positions and models from our analyses, assuming a diallelic or multiallelic trait model.
Results
Simulated data
The analysis runs allowing for multiallelic QTLs show evidence for faster convergence to the equilibrium distribution and better mixing than the runs allowing only diallelic QTLs (figure 2). The number of visiting QTLs rarely changes in the long runs assuming diallelic QTLs, indicating that the sampler moves slowly around the model space (figure 2 a,b,i,j). This poor mixing results in insufficient information to estimate the posterior distribution, even with long runs (1.5 × 10⁶ iterations) and a run time of 2.2 hours (similar to that of the maLoki runs). This lack of mixing is due to the high heritability of the trait. When h2 is reduced to 0.6 for replicate 2, there is more evidence of mixing in the number of visiting QTLs (figure 3 b). In contrast, the runs allowing for multiallelic QTLs (run time between 1.4 and 3.2 hours) appear to mix well, regardless of the heritability (figure 2 e,f,m,n and figure 3 f).
Figure 2.
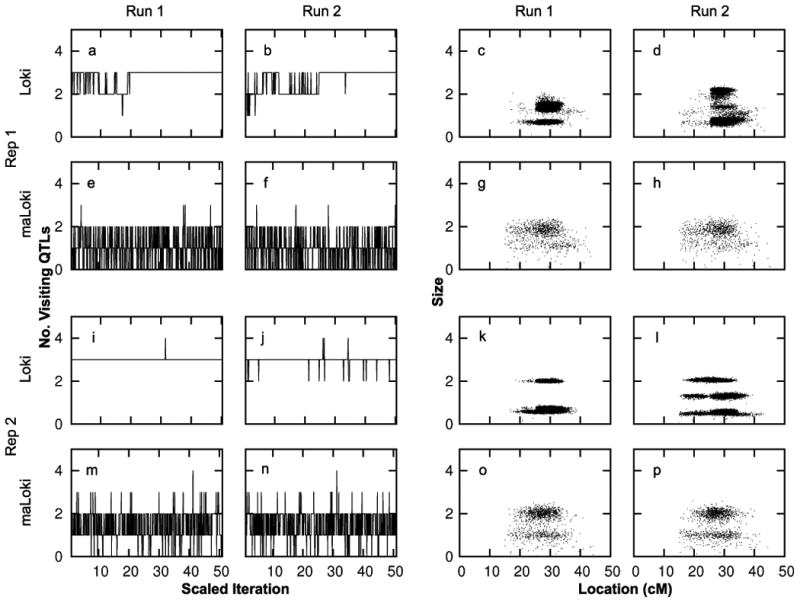
Comparison of visiting QTL parameters for paired Loki and maLoki runs on two representative simulated data replicates. Panels in left two columns show no. of visiting QTLs vs iteration/3000 for Loki and no. of visiting QTLs vs iteration/1000 for maLoki. Panels in right two columns show the size vs location (cM) of visiting QTLs
Figure 3.
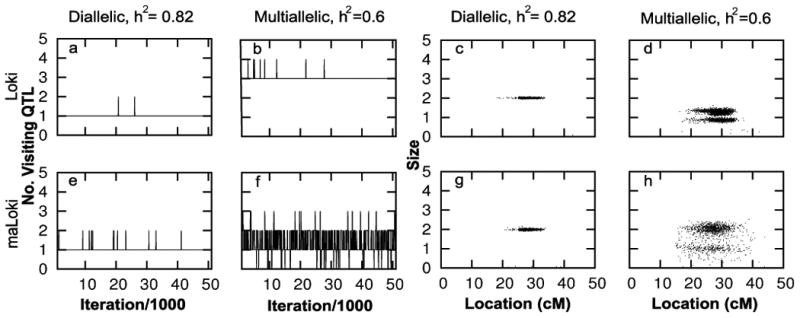
Comparison of visiting QTL parameters between Loki and maLoki on the transformed trait data for replicate 2. See Methods for description of data transformation.
The trait models across runs and replicates estimated from maLoki are strikingly similar whereas those estimated from Loki vary. For replicate 1, two of the QTLs have similar estimated posterior distributions of size and location across runs when using Loki, but the third QTL from both runs has different estimated size distributions (figure 2 c,d). For replicate 2, the location and sizes of the visiting QTLs are inconsistent across runs when assuming diallelic QTLs (figure 2 k,l). In contrast, the estimated posterior distribution of size and location of the visiting QTLs are similar when allowing multiallelic QTLs (figure 2 g,h,o,p).
Although each simulated data replicate provides evidence of linkage to the chromosome with both versions of Loki, the results from the two analysis models have different characteristics (figure 4). In all but one run assuming diallelic QTLs, each iteration contains at least one visiting QTL, resulting in PR of linkage = 50, the maximum possible with this data (figure 4 a). The one outlier has a PR of 45.6. In contrast, the PR ranges between 32.9 and 49.2 when multiallelic QTLs are allowed, indicating that there are iterations which lack visiting QTLs for all replicates. The mean bias in location is similar for both analysis models, but has a lower range for the diallelic model (figure 4 b). The smaller range in bias of location obtained from Loki is due to the larger number of visiting QTLs per iteration for Loki than maLoki, discussed below.
Figure 4.
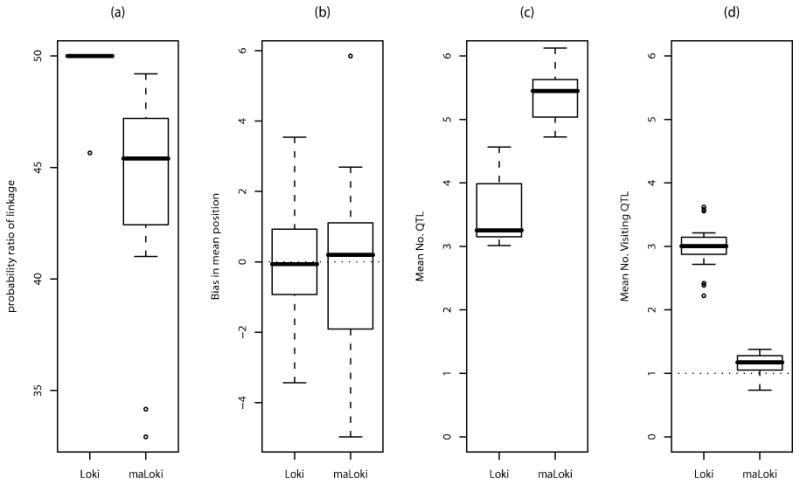
Distributional comparisons of key parameters from the Loki and maLoki runs on the simulated data. The columns are for (a) Probability ratio for the chromosome (b) Mean bias in position (c) Mean number of QTLs and (d) Mean number of visiting QTLs. The dotted line at 1 in (d) indicates the true number of linked QTLs. For all boxplots, the whiskers extend to the data point that is closest to and less than 1.5 times the interquartile range.
Similarly, the estimated posterior distribution of the number of visiting and total QTLs differs between the two analysis models (figure 4 c and d). Although both analysis models tend to overestimate the number of linked QTLs, there are fewer visiting QTLs in the analysis allowing multiallelic QTLs than the analysis restricted to diallelic QTLs: The mean number of visiting QTLs is 0.74 - 1.4 for maLoki but is always > 2 for Loki. This overestimate results from the presence of multiple alleles at the underlying trait gene. When the underlying true trait MOI is reduced to a diallelic MOI for replicate 2, the number of visiting QTLs is virtually always 1 for both analysis models (figure 3 a,e). In contrast, each iteration, on average, contains fewer total QTLs in analysis assuming diallelic QTLs than analysis allowing for multiallelic QTLs. Furthermore, the full posterior distribution of the total number of QTLs has a maximum ≤ 6 for Loki but always includes the upper bound of 15 for maLoki, across replicates.
Real Data
The estimated posterior distribution for the QTLs differs in analyses carried out with both trait models on the real HDL data. Unlike for the simulated data, estimates from maLoki include both fewer total and visiting QTLs than estimates from Loki: The total number of QTLs has posterior mean, standard deviation and range of 3.8, 1.5, (1,14) for maLoki and 5.4, 1.7, (1,12) for Loki, and respective run times of 7 hours and 0.75 hours on the identical computer. Although the posterior probability of at least one visiting QTL is similar (∼ 0.999), the posterior probability of 2 or more visiting QTLs is much lower for maLoki (0.27) than for Loki (0.61). Both analysis models appear to have good mixing for the total number of QTLs and the number of visiting QTLs (data not shown).
Although the estimated posterior mean number of visiting QTLs differed between runs from the diallelic versus multiallelic models, many of the visiting QTL models were similar. The estimated posterior trait model distribution for the larger visiting QTL (size ≥ 8) in both analyses is similar (figure 5 b,c). In the entire maLoki run, all but 5 of the visiting QTLs are diallelic and 97% of these QTLs have dominance. The estimated posterior mean (pi, αi2, αi3) for these diallelic QTLs was very similar across analysis models at (0.25, -17, 11) for maLoki and (0.25, -16, 9.9) for Loki. The position of the visiting QTLs from Loki and maLoki are also both centered near the location of APOC3 (figure 5 d and e).
Figure 5.
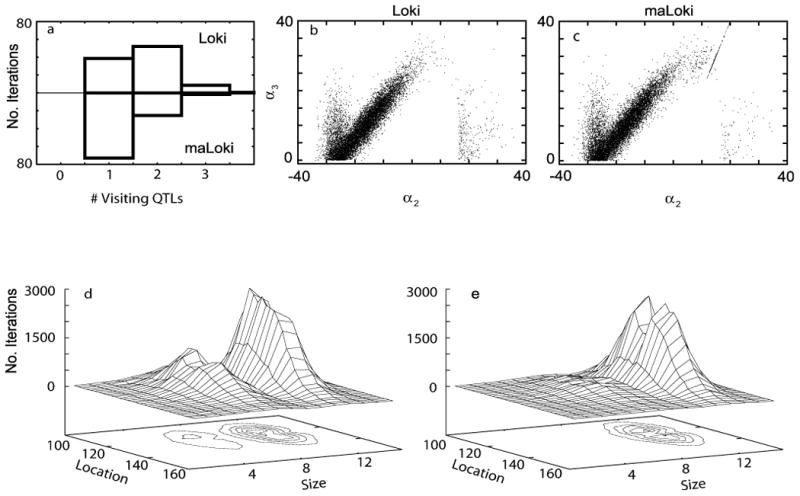
Results from analysis of HDL levels and APOC3. (a) Histogram of number of visiting QTLs when using Loki (top) and maLoki (bottom). Genotype effects of diallelic QTLs from Loki (b) and maLoki (c). These models are adjusted so that α3 ≥ 0. The line of points in (c) correspond to the additive QTLs: α3 = 2α2. Surface plots of size versus location of visiting QTLs when using Loki (d) and maLoki (e).
Discussion
Here we developed a multiallelic trait model that is useful for linkage and segregation analysis of complex continuous traits. We implemented this model as an extension to the current diallelic trait model used in the Bayesian oligogenic approach available in the package Loki. The method uses MCMC to efficiently sample from the posterior distribution of model parameters, and uses reversible jump MCMC to allow changes to the number of contributing loci and number of alleles at each QTL. In the extension, in order to limit the number of model parameters, each locus can be either diallelic with a dominance parameter, or multiallelic with additive allele effects. Using simulated data and a real complex trait, we compared results from analysis with the multiallelic and diallelic trait models. When the true underlying MOI was diallelic, both analysis models gave similar results. When the true underlying MOI was multiallelic, both analysis models provided evidence for linkage, but the posterior distributions of QTL parameters differed. For both the multiallelic simulated data and the real data, the estimated posterior mean number of visiting QTLs was smaller under the multiallelic analysis model. For the simulated multiallelic data, the multiallelic analysis model gave more consistent results across repeated analysis runs than did the diallelic analysis model.
The multiallelic model appears to achieve better sampling of the model space (mixing) than does the diallelic model. This is supported by the observation that similar estimated posterior QTL model distributions are attained from repeated multiallelic analysis runs within and across simulated data sets, whereas dissimilar posterior models are attained by the diallelic analysis on those same data sets. Even with many more iterations, the diallelic analysis model failed to converge, indicating that, under high heritability, the diallelic analysis model may suffer from poor mixing and the required number of iterations needed to ensure convergence may be prohibitively large. It is possible that the improved mixing observed with the multiallelic analysis model is due to the presence of the many non-visiting multiallelic QTLs accounting for phenotypic variation that the constrained diallelic model can not explain.
Comparison of the estimated posterior distributions of the parameters of the visiting QTLs from the diallelic and multiallelic analysis models clarifies the possible underlying MOI for the real data set. Although the diallelic analysis model provided evidence for two QTLs for HDL linked to APOC3, the multiallelic analysis model gave strong evidence for only one such linked QTL. Furthermore, average posterior trait model parameters for the single visiting QTL from the multiallelic model resembled those of one of the visiting QTLs from the diallelic analysis model. Given this distinction between the results from the analysis models and the expected linkage resolution of the HDL data set, the results from the multiallelic analysis model probably more accurately reflect the underlying MOI in this data set.
A disadvantage of the multiallelic analysis model is the increased computational cost. One source of the increased cost is the current presence of programming inefficiencies; future resolution of these may considerably improve the run time just as similar improvements increased computational speed in earlier versions of Loki [Heath 1998; Thompson and Heath 1999]. Another major contributor to the increased run time is the presence of additional parameters in the multiallelic trait model. In addition, proposals of unlikely QTL models waste time: Due to the constraints imposed by cosegregation at linked sites and the model relating phenotype to QTL genotype, proposed visiting multiallelic QTLs have small likelihoods and are therefore usually rejected. One way to limit the number of parameters, and thereby increase computing speed, may include using a Poisson prior distribution on the QTL type. Although incorporating a Poisson prior distribution on the total number of QTLs was fairly easy, computationally fast and statistically beneficial over the Uniform prior distribution [Heath 1998], there are difficulties in implementing a similar solution for QTL type. Until this issue is resolved, one practical approach to limit computation time is to use the multiallelic model selectively, such as when multiple linkage signals on a single chromosome are detected with the diallelic model.
As the search for trait loci continues, methods that more accurately capture the complexities of common traits will need continuous development, refinement and evaluation. An advantage of such methodological advancements is illustrated by the results obtained here, in which a more complex segregation analysis model can actually lead to a simpler estimated posterior distribution of the underlying trait MOI. A simpler trait model, in turn, may improve the chances of eventual gene identification. Although both the diallelic and multiallelic analysis models lead to incorrect model estimates, the models proposed by the multiallelic analysis, due to the improved mixing, more accurately reflect the underlying MOI in the simulated data. Therefore, the results obtained here illustrate conditions under which the multiallelic model can be used to clarify, support or refute trait model estimates from the diallelic model in the ongoing search for genes contributing to complex traits.
Appendix
Metropolis-Hastings
The iterative process of MCMC sampling can be carried out using the Metropolis-Hastings (MH) algorithm [Metropolis et al. 1953; Hastings 1970]. A state, or values for the model parameters, is proposed and then accepted or rejected, depending on the MH acceptance ratio:
| (6) |
where θ is the current values of the parameters, θ′ is the proposed values of the parameters, Y is the observed data, π is the target distribution of interest, which need be known only up to a constant of proportionality, and q is the sampling distribution used to generate values of θ′. If θ is multiparametric, the MH sampler can be used to make component-wise updates.
Reversible Jump MCMC
In the case when the number of parameters that make up the model θ can change between iterations, RJMCMC, a generalization of the MH algorithm, can be used [Green 1995]. In this case, a model state, z, consists of a model type, m, and parameter values, θ. If the proposed model type, m′, includes more parameters than m, random variables, U, are sampled and then transformed to create the proposed state, z′:
| (7) |
where the dimension of U equals that of the new parameters and g is a one-to-one transformation. In this case, the proposed transition between parameter spaces is incorporated into the acceptance ratio via the Jacobian, J, of g(θ, U):
| (8) |
where Pm is the prior density on the possible model types, pm,m′ is the transition probability from model type m to model type m′, and qm,m′ is the sampling distribution for the random variable U. If the proposed model contains fewer parameters than the current model, the additional parameters are dropped and the inverse of equation 8 is used for the acceptance ratio.
Birth/Death of additive QTL
The acceptance ratio,  , for the birth of a completely additive QTL is
| (9) |
where ℬ is unique to the case of proposing additive QTLs:
| (10) |
Equation 9, other than ℬ, is explained elsewhere [Heath 1997; Jannink and Wu 2003]. Briefly, P(birth) and P(death) are the probability of proposing a birth or a death, which is equivalent to proposing a change in model parameter space, m. P(k + 1) and P(k) are the prior probabilities of k + 1 or k QTLs. The k in the denominator of the prior distribution on the number of QTLs is for the random choice of QTL to choose for a death [Jannink and Wu 2003]. and are the current and proposed environmental variances. L and L′ are the likelihoods of the current and proposed trait models. Equation 10 contains the prior distribution on the allele effects, N(0, τ2/2), and the sampling distribution for , . The term is the random probability that an allele is positive or negative from equation 3. The Jacobian, J, for the transformation in equation 3 is:
| (11) |
Sampling of allele frequencies at additive QTLs
The posterior distribution for the allele frequencies is a multivariate generalization of the Beta distribution [Lange 1997]. If QTL i is additive with ℓ alleles, the posterior distribution on the allele frequencies is Dirichlet(ci1, ci2, …, ciℓ) where cil is one more than the count of allele il in the founders, l = 1, …,ℓ. The purpose of adding 1 is to ensure that cil > 0 for l = 1, …,ℓ.
Gibbs sampling of allele effects at additive QTLs
The trait model parameters (μ, β, α, a) are sampled simultaneously using Gibbs sampling at the end of each iteration. The prior distribution for the genotype effects is N(0,τ2), as used in the current version of Loki. The prior distribution for the allele effects of additive QTLs is N(0,τ2/2) in order that the genotype effects resulting from the sum of independent allele effects should be distributed as N(0,τ2). The prior distribution for the other parameters is given elsewhere [Heath 1997]. Since the trait model assumes that phenotypes are normally distributed, and the parameters have independent Normal prior distributions, the posterior distribution P(θ ∣ Y) is also Normal [Lindley and Smith 1972]. The posterior distribution is:
| (12) |
where ψ is the design matrix consisting of a unit vector for the baseline, vectors for the covariates, indicator vectors for genotypes Bi1Bi2 and Bi2Bi2 at QTLs with dominance or count of alleles Bi2, ⋯, Biℓ at additive QTLs. is the variance-covariance matrix, Y is the vector of phenotype data and ϒ is the variance matrix for the QTLs. The off-diagonal of ϒ is zero, and the diagonal is τ2 for QTLs with dominance and τ2/2 for the additive QTLs.
Supplementary Material
Acknowledgments
We wish to thank Gail Jarvik, Stephanie Monks, Kenneth Rice, Matthew Stephens, Yun Ju Sung, Nicola Chapman, Joseph Rothstein and Elizabeth Marchani for constructive comments, Hiep Nguyen for general computer support, and Simon Heath for providing the complete code for Loki 2.4.7. This work was supported by NIH grants R37 GM46255, P01 HL30086, P50 AG05136, and T32 HG00035.
Footnotes
Web Resources: Loki and Genedrop: http://www.stat.washington.edu/thompson/Genepi/pangaea.shtml.
Modified Loki code (maLoki): http://faculty.washington.edu/wijsman/.
References
- Almasy L, Blangero J. Multipoint quantitative-trait linkage analysis in general pedigrees. American Jouranl of Human Genetics. 1998;62(5):1198–1211. doi: 10.1086/301844. [DOI] [PMC free article] [PubMed] [Google Scholar]
- Amos CI. Robust variance-components approach for assessing genetic-linkage in pedigrees. American Journal of Human Genetics. 1994;54:535–543. [PMC free article] [PubMed] [Google Scholar]
- Atwood L, Heard-Costa N. Limits of fine-mapping a quantitative trait. Genetic Epidemiology. 2003;24(2):99–106. doi: 10.1002/gepi.10225. [DOI] [PubMed] [Google Scholar]
- Bodmer WF, Bailey C, Bodmer J, Bussey H, Ellis A, Gorman P, Lucibello F, Murday V, Rider S, Scambler P, Sheer D, Solomon E, Spurr N. Localization of the gene for familial adenomatous polyposis on chromosome 5. Nature. 1987;328:614–616. doi: 10.1038/328614a0. [DOI] [PubMed] [Google Scholar]
- Bourhis L, Benko S, Girardin S. Nod1 and Nod2 in innate immunity and human inflammatory disorders. Biochemical Society Transactions. 2007;35:1479–1484. doi: 10.1042/BST0351479. [DOI] [PubMed] [Google Scholar]
- Brkanac Z, Chapman NH, Igo RP, Jr, Matsushita MM, Nielsen K, Berninger VW, Wijsman EM, Raskind WH. Genome scan of a nonword repetition phenotype in families with dyslexia: Evidence for multiple loci. Behavior Genetics. 2008;38(5):462–475. doi: 10.1007/s10519-008-9215-2. [DOI] [PMC free article] [PubMed] [Google Scholar]
- Brooks SP. Markov chain Monte Carlo method and its application. Journal of the Royal Statistical Society Series D-The Statistician. 1998;47(1):69–100. [Google Scholar]
- Clerget-Darpoux F, Bonaïti-Pellié C, Hochez J. Effects of misspecifying genetic parameters in lod score analysis. Biometrics. 1986;42:393–399. [PubMed] [Google Scholar]
- Daw E, Heath S, Lu Y. Single-nucleotide polymorphism versus microsatellite markers in a combined linkage and segregation analysis of a quantitative trait. BMC Genetics. 2005;6(Suppl. 1) doi: 10.1186/1471-2156-6-S1-S32. [DOI] [PMC free article] [PubMed] [Google Scholar]
- Daw EW, Chen SN, Czernuszewicz G, Lombardi R, Lu Y, Ma J, Roberts R, Shete S, Marian AJ. Genome-wide mapping of modifier chromosomal loci for human hypertrophic cardiomyopathy. Human Molecular Genetics. 2007;16(20):2463–2471. doi: 10.1093/hmg/ddm202. [DOI] [PMC free article] [PubMed] [Google Scholar]
- Daw EW, Heath SC, Wijsman EM. Multipoint oligogenic analysis of age-at-onset data with applications to Alzheimer disease pedigrees. American Journal of Human Genetics. 1999;64:839–851. doi: 10.1086/302276. [DOI] [PMC free article] [PubMed] [Google Scholar]
- Daw EW, Payami H, Nemens E, Nochlin D, Bird T, Schellenberg G, Wijsman E. The number of trait loci in late-onset Alzheimer disease. American Journal of Human Genetics. 2000;66:196–204. doi: 10.1086/302710. [DOI] [PMC free article] [PubMed] [Google Scholar]
- Dedoussis GVZ. Apolipoprotein polymorphisms and familial hypercholes-terolemia. Pharmacogenomics. 2007;8(9):1179–1189. doi: 10.2217/14622416.8.9.1179. [DOI] [PubMed] [Google Scholar]
- Devlin CM, Prenger V, Miller M. Linkage of the apo CIII microsatellite with isolated low high-density lipoprotein cholesterol. Human Genetics. 1998;102:273–281. doi: 10.1007/s004390050691. [DOI] [PubMed] [Google Scholar]
- Gagnon F, Jarvik G, Motulsky A, Deeb S, Brunzell J, Wijsman E. Evidence of linkage of HDL level variation to APOC3 in two samples with different ascertainment. Human Genetics. 2003;113:522–533. doi: 10.1007/s00439-003-1006-5. [DOI] [PubMed] [Google Scholar]
- Glazier AM, Nadeau JH, Aitman TJ. Finding genes that underlie complex traits. Science. 2002;298:2345–2349. doi: 10.1126/science.1076641. [DOI] [PubMed] [Google Scholar]
- Goate A, Chartierharlin M, Mullan M, Brown J, Crawford F, Fidani L, Giuffra L, Haynes A, Irving N, James L, Mant R, Newton P, Rooke K, Roques P, Talbot C, Pericak-Vance M, Roses A, Williamson R, Rossor M, Owen M, Hardy J. Segregation of a missense mutation in the amyloid precursor protein gene with familial Alzheimer's-disease. Nature. 1991;349(6311):704–706. doi: 10.1038/349704a0. [DOI] [PubMed] [Google Scholar]
- Green PJ. Reversible jump Markov chain Monte Carlo computation and Bayesian model determination. Biometrika. 1995;82(4):711–32. [Google Scholar]
- Guo SW, Thompson EA. A Monte Carlo method for combined segregation and linkage analysis. American Journal of Human Genetics. 1992;51:1111–1126. [PMC free article] [PubMed] [Google Scholar]
- Haines JL, Pericak-Vance MA, editors. Approaches to Gene Mapping in Complex Human Diseases. Wiley-Liss; New York: 1998. [Google Scholar]
- Hall JM, Lee M, Newman B, Morrow J, Anderson L, Huey B, King M. Linkage of early-onset familial breast-cancer to chromosome-17q21. Science. 1990;250:1684–1689. doi: 10.1126/science.2270482. [DOI] [PubMed] [Google Scholar]
- Hastings WK. Monte Carlo sampling methods using Markov chains and their applications. Biometrika. 1970;57(1):97–109. [Google Scholar]
- Hayden MR, Kirk H, Clark C, Frohlich J, Rabkin S, McLeod R, Hewitt J. DNA polymorphisms in and around the Apo-A1-CIII genes and genetic hyperlipidemias. American Journal of Human Genetics. 1987;40:421–430. [PMC free article] [PubMed] [Google Scholar]
- Heath SC. Markov chain Monte Carlo segregation and linkage analysis for oligogenic models. American Journal of Human Genetics. 1997;61:748–760. doi: 10.1086/515506. [DOI] [PMC free article] [PubMed] [Google Scholar]
- Heath SC. Generating consistent genotypic configurations for multi-allelic loci and large complex pedigrees. Human Heredity. 1998;48:1–11. doi: 10.1159/000022775. [DOI] [PubMed] [Google Scholar]
- Igo R, Chapman N, Berninger V, Matsushita M, Brkanac Z, Rothstein J, Holzman T, Nielsen K, Raskind W, Wijsman E. Genomewide scan for real-word reading subphenotypes of dyslexia: Novel chromosome 13 locus and genetic complexity. American Journal of Medical Genetics Part B - Neuropsychiatric Genetics. 2006;141B(1):15–27. doi: 10.1002/ajmg.b.30245. [DOI] [PMC free article] [PubMed] [Google Scholar]
- Jannink JL, Wu XL. Estimating allelic number and identity in state of QTLs in interconnected families. Genetical Research. 2003;81:133–144. doi: 10.1017/s0016672303006153. [DOI] [PubMed] [Google Scholar]
- Kerem B, Rommens J, Buchanan J, Markiewicz D, Cox T, Chakravarti A, Buchwald M, Tsui L. Identification of the Cystic-fibrosis gene - genetic analysis. Science. 1989;245(4922):1073–1080. doi: 10.1126/science.2570460. [DOI] [PubMed] [Google Scholar]
- Knoblauch H, Muller-Myhsok B, Busjahn A, Ben Avi L, Bahring S, Baron H, Heath S, Uhlmann R, Faulhaber H, Shpitzen S, Aydin A, Reshef A, Rosenthal M, Eliav O, Muhl A, Lowe A, Schurr D, Harats D, Jeschke E, Friedlander Y, Schuster H, Luft F, Leitersdorf E. A cholesterol lowering gene maps to chromosome 13q. American Journal of Human Genetics. 2000;66:157–166. doi: 10.1086/302704. [DOI] [PMC free article] [PubMed] [Google Scholar]
- Knowlton R, Cohenhaguenauer O, Cong N, Frezal J, Brown V, Barker D, Braman J, Schumm J, Tsui L, Buchwald M, Doniskeller H. A polymorphic DNA marker linked to Cystic-fibrosis is located on chromosome-7. Nature. 1985;318(6044):380–382. doi: 10.1038/318380a0. [DOI] [PubMed] [Google Scholar]
- Lander E, Schork N. Genetic dissection of complex traits. Science. 1994;265(5181):2037–2048. doi: 10.1126/science.8091226. [DOI] [PubMed] [Google Scholar]
- Lange K. Mathematical and Statistical Methods for Genetic Analysis. Springer; New York: 1997. [Google Scholar]
- Levy-Lahad E, Wasco W, Poorkaj P, Romano D, Oshima J, Pettingell W, Yu C, Jondro P, Schmidt S, Wang K, Crowley A, Fu Y, Guenette S, Galas D, Nemens E, Wijsman E, Bird T, Schellenberg G, Tanzi R. Candidate gene for the chromosome-1 familial Alzheimer's-disease locus. Science. 1995;269(5226):973–977. doi: 10.1126/science.7638622. [DOI] [PubMed] [Google Scholar]
- Lindley DV, Smith AFM. Bayes estimates for the linear model. Journal of the Royal Statistical Society Series B. 1972;34:1–41. [Google Scholar]
- Lohmueller KE, Pearce CL, Pike M, Lander ES, Hirschhorn JN. Meta-analysis of genetic association studies supports a contribution of common variants to susceptibility to common disease. Nature Genetics. 2003;33(2):177–182. doi: 10.1038/ng1071. [DOI] [PubMed] [Google Scholar]
- Lynch M, Walsh B. Genetics and Analysis of Quantitative Traits. Sinauer Associates, Inc.; Sunderland, Mass: 1998. [Google Scholar]
- Martinex V, Thorgaard G, Robison B, Sillanpaa M. An application of Bayesian QTL mapping to early development in double haploid lines of rainbow trout including environmental effects. Genetical Research. 2005;86(3):209–221. doi: 10.1017/S0016672305007871. [DOI] [PubMed] [Google Scholar]
- Metropolis N, Rosenbluth A, Rosenbluth M, Teller A. Equations of state calculations by fast computing machines. Journal of Chemical Physics. 1953;21:1087–1092. [Google Scholar]
- Ott J. Analysis of Human Genetic Linkage. third The Johns Hopkins University Press; Baltimore: 1999. [Google Scholar]
- R Development Core Team. R: A Language and Environment for Statistical Computing. R Foundation for Statistical Computing; Vienna, Austria: 2007. [Google Scholar]
- Schellenberg G, Bird T, Wijsman E, Orr H, Anderson L, Nemens E, White J, Bonnycastle L, Weber J, Alonso M, Potter H, Heston L, Martin G. Genetic-linkage evidence for a familial Alzheimers-disease locus on chromosome-14. Science. 1992;258(5082):668–671. doi: 10.1126/science.1411576. [DOI] [PubMed] [Google Scholar]
- Thompson EA. NSF-CBMS Regional Conference Series in Probability and Statistics. Vol. 6. Beachwood, Ohio: 2000. Statistical Inference from Genetic Data on Pedigrees. [Google Scholar]
- Thompson EA, Heath SC. Estimation of conditional multilocus gene identity among relatives. In: Seillier-Moiseiwitsch, editor. Statistics in Molecular Biology and Genetics. IMS; Hayward, CA: 1999. pp. 95–113. [Google Scholar]
- Thompson EA, Jewett M, Basu S, George A, Geyer C, Guo S, Heath S, Li M, Lewis S, Lin S, Sheehan N, Snow G, Stewart W, Tong L. Monte Carlo genetic analysis. 2007 http://www.stat.washington.edu/thompson/Genepi/pangaea.shtml.
- Tsui L, Buchwald M, Barker D, Braman J, Knowlton R, Schumm J, Eiberg H, Mohr J, Kennedy D, Plavsic N, Zsiga M, Markiewicz D, Akots G, Brown V, Helms C, Gravius T, Parker C, Rediker K, Doniskeller H. Cystic-fibrosis locus defined by a genetically linked polymorphic DNA marker. Science. 1985;230(4729):1054–1057. doi: 10.1126/science.2997931. [DOI] [PubMed] [Google Scholar]
- Visscher PM. Sizing up human height variation. Nature Genetics. 2008;40(5):489–490. doi: 10.1038/ng0508-489. [DOI] [PubMed] [Google Scholar]
- Wainwright B, Scambler P, Schmidtke J, Watson E, Law H, Farrall M, Cooke H, Eiberg H, Williamson R. Localization of cystic-fibrosis locus to human-chromosome 7cen-q22. Nature. 1985;318(6044):384–385. doi: 10.1038/318384a0. [DOI] [PubMed] [Google Scholar]
- Wang C, Rutledge J, Gianola D. Marginal inferences about variance-components in a mixed linear-model using Gibbs sampling. Genetics Selection Evolution. 1993;25(1):41–62. [Google Scholar]
- Weedon MN, Lettre G, Freathy RM, Lindgren CM, Voight BF, Perry JRB, Elliott KS, Hackett R, Guiducci C, Shields B, Zeggini E, Lango H, Lyssenko V, Timpson NJ, Burtt NP, Rayner NW, Saxena R, Ardlie K, Tobias JH, Ness AR, Ring SM, Palmer CNA, Morris AD, Peltonen L, Salomaa V, Smith GD, Groop LC, Hattersley AT, McCarthy MI, Hirschhorn JN, Frayling TM, Diabetes Genetics Initiative, and Wellcome Trust Case Control Consortium A common variant of HMGA2 is associated with adult and childhood height in the general population. Nature Genetics. 2007;39(10):1245–1250. doi: 10.1038/ng2121. [DOI] [PMC free article] [PubMed] [Google Scholar]
- Wijsman E, Daw E, Yu C, Payami H, Steinbart E, Nochlin D, Conlon E, Bird T, Schellenberg G. Evidence for a novel late-onset Alzheimer disease locus on chromosome 19p13.2. American Journal of Human Genetics. 2004;75(3):398–409. doi: 10.1086/423393. [DOI] [PMC free article] [PubMed] [Google Scholar]
- Wijsman E, Rothstein J, Thompson E. Multipoint linkage analysis with many multiallelic or dense diallelic markers:Markov chain-Monte Carlo provides practical approaches for genome scans on general pedigrees. The American Journal of Human Genetics. 2006;79:846–858. doi: 10.1086/508472. [DOI] [PMC free article] [PubMed] [Google Scholar]
- Wijsman EM, Amos CI. Genetic analysis of simulated oligogenic traits in nuclear extended pedigrees: Summary of GAW10 contributions. Genetic Epidemiology. 1997;14:719–735. doi: 10.1002/(SICI)1098-2272(1997)14:6<719::AID-GEPI28>3.0.CO;2-S. [DOI] [PubMed] [Google Scholar]
- Wijsman EM, Rothstein JH, Thompson EA. MCMC provides practical approaches for genome scans on general pedigrees with many multiallelic or dense diallelic markers. Genetic Epidemiology. 2007;31(5):454. doi: 10.1086/508472. [DOI] [PMC free article] [PubMed] [Google Scholar]
- Wilcox M, Pugh E, Zhang H, Zhong X, Levinson D, Kennedys G, Wijsman E. Comparison of single-nucleotide polymorphisms and microsatellite markers for linkage analysis in the COGA and simulated data sets for genetic analysis workshop 14: Presentation groups 1, 2, and 3. Genetic Epidemiology. 2005;29(Suppl. 1):S7–S28. doi: 10.1002/gepi.20106. [DOI] [PubMed] [Google Scholar]
- Williams JT, Duggirala R, Blangero J. Statistical properties of a variance components method for quantitative trait linkage analysis in nuclear families and extended pedigrees. Genetic Epidemiology. 1997;14(6):1065–1070. doi: 10.1002/(SICI)1098-2272(1997)14:6<1065::AID-GEPI84>3.0.CO;2-F. [DOI] [PubMed] [Google Scholar]
- Wooster R, Neuhausen S, Mangion J, Quirk Y, Ford D, Collins N, Nguyen K, Seal S, Tran T, Averill D, Fields P, Marshall G, Narod S, Lenoir G, Lynch H, Feunteun J, Devilee P, Cornelisse C, Menko F, Daly P, Ormiston W, McManus R, Pye C, Lewis C, Cannon-Albright L, Peto J, Ponder B, Skolnick M, Easton D, Goldgar D, Stratton M. Localization of a breast-cancer susceptibility gene, BRCA2, to chromosome 13q12-13. Science. 1994;265:2088–2090. doi: 10.1126/science.8091231. [DOI] [PubMed] [Google Scholar]
- Yu D. Master's thesis. University of Washington; 2003. Testing the robustness of Markov chain Monte Carlo segregation and linkage analysis when normality assumptions are violated. [Google Scholar]
- Yuan B, Neuman R, Duan S, Weber J, Kwok P, Saccone N, Wu J, Liu K, Schonfeld G. Linkage of a gene for familial hypobetalipoproteinemia to chromosome 3p21.1-22. American Journal of Human Genetics. 2000;66(5):1699–1704. doi: 10.1086/302904. [DOI] [PMC free article] [PubMed] [Google Scholar]
Associated Data
This section collects any data citations, data availability statements, or supplementary materials included in this article.