Abstract
We report patient motion in 110 Tl-201 cardiac perfusion SPECT studies in 66 patients. The imaging consisted of emission followed by sequential transmission imaging during which motion tracking with a visual tracking system (VTS) was performed. We investigated the extent, time, and frequency of respiratory and rigid-body motion in these patients. We also determined whether the motion occurred gradually or in sudden jumps, whether it was sustained, and if it occurred along one or more axes predominantly. We then studied the differences in respiratory and body motion (BM), if any, between stress versus rest imaging groups, male versus female subjects, and exercise versus pharmacological stress groups. We found that 23% of the studies had sustained motion (> 4min.) of between 3–6 mm, and 5% had sustained motion larger than 6 mm during emission imaging. In terms of respiratory motion, 13% showed a downward trend of the respiratory baseline of more than 6 mm during emission imaging. Also, in 9% of the studies, the average position of patients was displaced by more than 3 mm between emission and transmission imaging phases. Both of these motions may lead to misalignment of the attenuation map. In hypothesis testing of grouped studies, it was determined that stress and rest imaging did not show any significant differences in body motion but did in respiratory motion associated with a change in respiration following stress. Exercise-stress studies showed a larger extent of respiratory motion than the pharmacologically induced stress studies. Significant differences in body and respiratory motion of male and female groups were also observed. A visual assessment of the reconstructed slices in the studies with measured motion was made to investigate the impact of the motion. Illustrative example studies are included.
Keywords: Motion estimation, patient motion, signal processing, single photon emission computed tomography, statistical analysis
I. Introduction
PATIENT motion during emission imaging can cause image artifacts and a decrease in diagnostic accuracy. In a review of SPECT projection data and sinograms for 165 clinical SPECT perfusion studies, Botvinick et al. [1] reported the detection of motion in approximately 25% of the studies with the significant artifact being present in 5%. Similarly, in a study of 164 studies from cardiac SPECT patients, Prigent [2] found evidence of motion in 26% and artifacts were present in 4% of the studies. More recently, Wheat and Currie [3] analyzed 800 myocardial SPECT studies and determined 36% contained visually detectable motion. Studies with simulated motion [1] demonstrated that the time of occurrence of motion during imaging (related to the camera angle when motion occurred), the direction of motion (vertical or horizontal relative to projections), and the number of frames sustained in the moved state affect the severity of artifacts induced. These studies showed that small vertical motion of 1–2 pixel (4–8 mm) occurring for eight frames (5–6 min.) around the middle of the acquisition may cause significant artifacts.
In addition to the inadvertent movement, superior drift of the heart within the patient's body or “upward creep” occurs in patients especially following exercise stress, and has been linked to a change in respiratory pattern [4]. Using the Varian RPM system to track motion of the abdomen, Kinahan et al. [5] found a significant variability in the amplitude and frequency of respiration in several hundred PET/CT studies. These changes in the position of the heart with respiration may also cause diagnostically significant artifacts in cardiac perfusion imaging.
Patient motion whether respiratory drift or gross body motion, occurring between emission and transmission imaging modalities can cause a misalignment of the attenuation maps and must be corrected for proper attenuation correction [6]–[9]. In fact, a recent study of cardiac SPECT/CT reported that 42% of the studies had moderate to severe misregistration [7], and a recent review of cardiac PET/CT reported moderate to severe misregistration related perfusion artifacts in 40% patients studied [9]. Misalignment of CT maps acquired during normal breathing in 46% of rest and 54% of stress PET scans on a PET/CT system by an amount of 5 mm or more was also reported in [10].
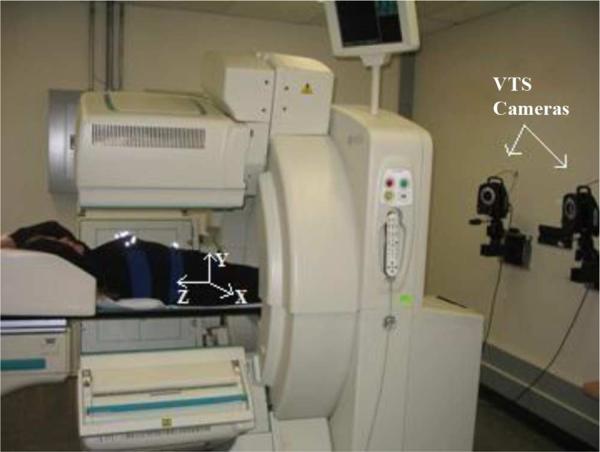
With the exception of the studies of Kinahan et al. [5], all of these studies inferred patient motion from the clinical imaging data. To provide quantitative information about the actual movement of the patients during emission and sequential transmission imaging for use in motion correction, we have installed a visual tracking system (VTS) from Vicon [11] within our nuclear medicine clinic (Fig. 1).
Fig. 1.
SPECT and Vicon Visual Tracking System (VTS) setup. Two near-infrared cameras are mounted on the wall at the footend of the gantry. Three more cameras (not shown) are mounted on the wall at the head end of the gantry. The retroeflective markers on the belts may be seen as bright spots on the chest and the abdomen of the subject. The coordinate system for the VTS as calibrated to the SPECT coordinate system is shown with X being lateral, Y vertical, and Z axial. The arrows indicate the positive direction of the axes.
In this paper, we analyze the motion-tracking data of these patient acquisitions to determine the extent, duration, time of occurrence, and the frequency of motion. The type of motion (i.e., whether it occurred gradually or in jumps) is also examined. We also analyze the respiratory motion of patients to determine the extent of change in amplitude and frequency of oscillations of the respiratory signal, and the drift of respiratory baseline over the duration of imaging, which may be correlated with the upward creep of the heart. In addition, we compared the motion parameters between studies grouped by stress versus rest imaging, exercise versus pharmacologically induced stress, and male versus female subjects to investigate if there are significant differences between the pairs of each grouping. Finally, we visually assessed the reconstructed slices in the studies with measured motion and illustrate motion artifacts in two example studies.
II. Methods
In an IRB-approved study with informed consent, we tracked 51 stress and 59 rest cardiac Tl-201 perfusion studies performed on a Philips IRIX SPECT system in a total of 66 patients, 45 males, and 21 females. The patients were referred to our Nuclear Medicine Clinic for cardiac perfusion imaging to evaluate the possibility of coronary artery disease. Stress-rest paired studies were available for 44 of these patients. Stress was by exercise in 37 patients, and persantine was used as the pharmacological agent for inducing stress in the remaining 14 patients. The patients involved in this study were between 32 to 87 years of age (the average was 56) and had a BMI ranging between 18 and 40 (the average was 28).
The SPECT system was set to acquire from two camera heads at 102° apart acquiring 34 frames at 3° each. Note with Tl-201 patient imaging begins within 10 to 15 min. following the completion of stress. These studies require the patient to remain motionless during about 15 min of emission imaging followed by about 7 min of sequential transmission imaging which is used to estimate attenuation maps for the correction of the emission images.
During imaging, the patients have stretchy belts wrapped about their chest and abdomen to which retro-reflective markers are attached (Fig. 1). The movement of these markers at a rate of 30 frames/s is then determined by stereo-imaging by using the cameras of the Vicon VTS. Sometimes, the Vicon VTS cameras cannot view some of the markers, and this may lead to gaps in the marker traces. This may occur due to the obstruction of the line of sight of the Vicon cameras either by the camera-heads of the SPECT system itself, or by the patient's arms, other parts of the body, or clothing. In a separate study [11] reporting motion-tracking in 77 patients undergoing cardiac-SPECT imaging, we determined that at least three of the four markers on the chest and one on the abdomen bands could be tracked without loss in 94% and 92% of the studies, respectively, during the entire period of SPECT and transmission imaging. The accuracy of VTS for motion tracking was also established to be submillimeter and subdegree through studies comparing the motion of Tc-99m containing markers as determined from stereotracking and SPECT reconstructions.
The signal from each marker consists of three 1-D traces corresponding to the absolute X, Y, and Z location of the marker in the 3-D space of the SPECT coordinate system over time. In this coordinate system, X is the lateral, Y is the vertical, and Z is the axial direction (see Fig. 1). Each trace has at least a periodic component (PM) due to respiration and a nonperiodic component (NPM) that manifests itself as sudden baseline changes due to gross patient motion, or slow drifts due to either gross patient motion or changes in respiration over time. We have previously developed a method of separating the components of PM and NPM from the marker signals using total-variation (TV)-based iterative-smoothing [12]. In this method, the PM component of the Y-axis (vertical) signal from the abdominal marker with the largest average peak-to-peak amplitude of oscillations is extracted first. The TV-based iterative smoothing of this marker signal is continued until the power in the dominant frequency of the extracted oscillations is maximized. The respiratory frequency of the patient is assumed to be the dominant frequency of the extracted PM component. For all of the signals that are smoothed thereafter, smoothing is continued until the power in the patient's respiratory frequency (estimated above) of extracted PM components is maximized. This methodology was determined to work very well in controlled experiments; however, only a subjective validation has been performed in actual clinical studies [12].
Herein, when reporting observed motions, and elsewhere when correcting motion [11], we do not assume the combined chest and abdomen regions of patients to be a single rigid body. Thus, the NPM of the chest markers is used as an estimate of the motion of the heart within the chest. In the discussion section, we summarize our studies thus far which employ combined MRI and marker imaging to investigate the assumptions involved in estimating gross heart motion in this manner.
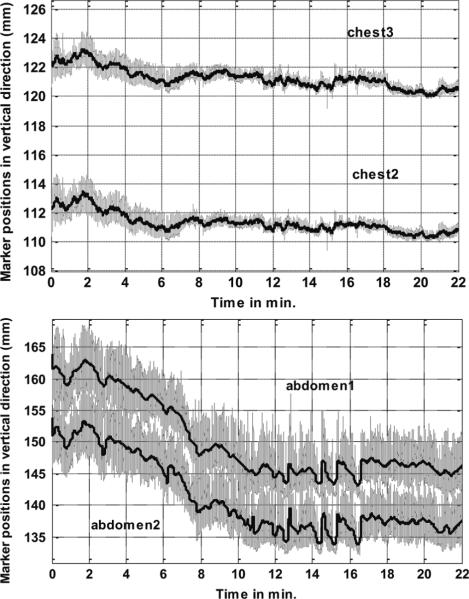
Fig. 2 shows the motion-tracking data (in gray lines) and the separated NPM component (black lines) in the vertical (Y) direction for two chest (top) and two abdominal markers (bottom) for a sample patient study. Note that the amplitude of respiration in this direction is much smaller in chest markers than in the abdominal markers. This correlates with the observation that most patients lying in a supine position with arms over their heads are “abdomen” breathers as opposed to “chest” breathers. That is, respiration is predominately due to a superior/inferior (SI) motion of the diaphragm which causes an anterior/posterior (AP) motion of markers on the abdomen [13] as opposed to a rocking of the ribs which causes an AP motion of markers on the chest surface. Also, while the chest markers show a movement downwards of only about 2 mm, the abdominal markers move down by 15 mm during the period of imaging. The drift downwards is again larger for the abdomen as opposed to chest markers due to the predominately “abdominal” nature of the respiration. Evidence of a correlation between marker and heart motion can be inferred from the literature on studies correlating externally measured motion of markers on the abdomen and fluoroscopy measured diaphragm motion [13], and diaphragm and heart motion in MRI [14], [15]. Previously, we also reported anecdotal evidence that the downward drift of respiratory baseline as seen in the NPM components of abdominal markers along the vertical direction was found to correlate with the superior motion of the heart (upward creep) in projection images [12]. Therefore, we used the PM and NPM components of abdominal markers for reporting respiratory motion herein, and for binning list-mode acquisitions for the estimation and correction of the PM and NPM respiratory motion of the heart [16].
Fig. 2.
Motion-tracking data along the vertical direction of markers on a patient undergoing cardiac stress imaging. The gray lines show the acquired motion signal, and black lines represent the extracted nonperiodic motion component. (Top) Motion data from two chest markers. (Bottom) Motion data from two abdominal markers.
A. Body Motion Parameters (During Emission Study)
1) Extent of Motion
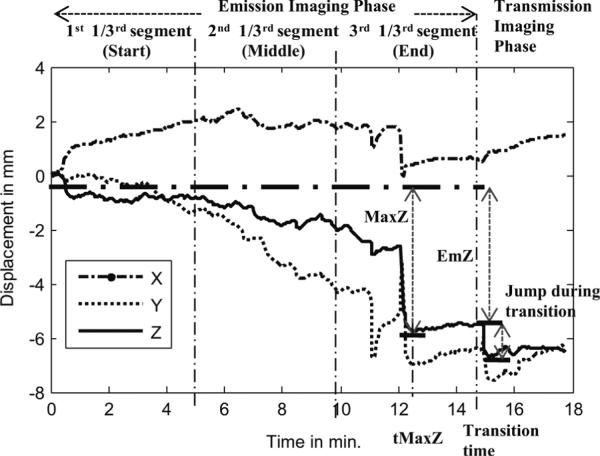
The NPM components from the chest markers are used to compute the rigid-body translation of the centroid of the markers relative to the start of the study. The median displacement along X, Y, Z axes (Fig. 1) over 1-min. intervals is used to compute the following motion parameters:
-
1)
displacement along X, Y, Z between the start and end of the emission imaging phase (emX, emY, emZ);
-
2)
maximum displacement along all three axes (maxX, maxY, maxZ) which can be larger than the displacement between the start and end if the patient returns toward their starting position;
-
3)
the time of occurrence of maximum displacement from the start position along all three axes (tmaxX, tmaxY, tmaxZ);
-
4)
the maximum average displacement between any of the three segments (start, middle, and end) of the emission acquisition; this was computed by taking the average position along X, Y, and Z in each segment and then determining which two segments had maximum separation; this parameter examines the gross motion states during emission.
Fig. 3 shows an example of the aforementioned extent-of-motion parameters for the Z-axis signal for a patient study. This figure also illustrates the division of the emission acquisition into three time segments for the computation of parameter 4 above.
Fig. 3.
Illustration of three time segments of emission imaging, the period of transmission imaging, and nonperiodic motion parameters of maximum change along the Z-axis during emission imaging (MaxZ), the time of occurrence of the maximum change (tMaxZ), and the overall change from start to the end of emission imaging (EmZ).
2) Severity and Frequency of Motion
For analyzing the motion severity in terms of the possibility of diagnostically significant artifacts, we divided the studies with motion into two categories.
-
1)
small motion: studies with displacement along all three axes during emission phase (aforesaid emX, emY, & emZ) between 3–6 mm;
-
2)
large motion: studies with emX, emY, and emZ greater than 6 mm.
For analyzing the frequency of motion, we then computed the number of studies with small and large motion
-
1)
sustained for 1 min. or longer;
-
2)
sustained for 4 min. or longer (i.e., 1/4; the duration of the study approximately).
We also examined the likelihood of motion occurring in groups: Stress versus Rest, Male versus Female and Exercise versus Pharmacological stress. The studies with motion of 3 mm or more sustained for at least 4 min. during emission imaging were chosen for determining the likelihoods.
3) Type of Motion
In addition, we analyzed the studies to determine the type of motion, that is
-
1)
if motion occurred gradually or in the form of jumps (sudden movements); for this purpose, we examined the displacement of the centroid of marker NPM components along the three axes for discontinuities of at least 3 mm;
-
2)
the predominant axis (X, Y, Z) along which motion occurred (if any); this was determined by computing the fraction of studies with a motion of 3 mm or more sustained for at least 4 min. during emission imaging along each of the three axes, and then evaluating if any particular axis accounted for a significantly large fraction.
B. Body Motion Parameters (Between End of Emission and End of Transmission Imaging)
In the IRIX SPECT system during sequential imaging, there is a short period of time at the end of emission imaging when the camera heads move out and change their direction of rotation in preparation for transmission imaging. Patients are warned in advance of this and are instructed to lie still, but in some cases, they still move. We therefore examined the studies for indication of motion between the end of emission imaging and the start of transmission imaging, and during transmission imaging to determine the possibility of misaligned attenuation maps.
1) Extent of Motion
-
1)
the Displacement along X, Y, Z during transition from emission to transmission;
-
2)
the maximum of the displacements of the average position during transmission from the three time-segments (start, middle, and end in Fig. 3) of emission study.
2) Type of Motion
We determined if motion occurred gradually or in the form of jumps (sudden movements) along any predominant axes, or predominantly in any group (stress or rest, male or female).
3) Frequency of Motion
This is the percentage of studies with motion between emission and transmission phase, or during transmission phase.
C. Respiratory Motion Parameters
For analyzing the extent of respiratory motion, we used the PM and NPM components along the vertical or Y axis (Fig. 1) from the abdominal marker with the largest respiratory amplitude. The NPM component along the Y axis of abdominal markers mostly reflects the trend changes in respiration (motion of the diaphragm [13]) as physical motion of the patient downwards in the vertical direction is restricted due to the bed and it is unlikely the patients would sustain a vertical motion upwards off the bed. The following parameters are used to quantify respiratory motion:
-
1)
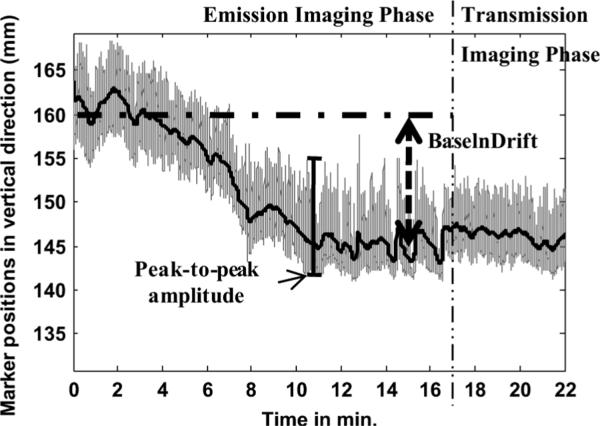
the maximum downward drift of respiratory baseline during emission imaging (BaselnDrift) and the standard deviation of the respiratory baseline about the median (stdBase) computed from the NPM component along the Y axis;
-
2)
the median (MedPpk) and the standard deviation (stdPpk) of the peak-to-peak amplitude of the respiration signal computed from the PM component along the Y-axis;
-
3)
the change in peak-to-peak amplitude of the respiration signal during emission imaging also computed from the PM component along the Y-axis (ChangePpk);
-
4)
average respiratory frequency at the start of acquisition (AvFrqSt) and at the end of emission imaging phase (AvFrqEn) computed over 1 min. intervals from the PM component.
Fig. 4 shows an example of patient data with large respiratory baseline drift. The respiratory parameters base-line-drift (BaselnDrift) and peak-to-peak amplitude are also illustrated.
Fig. 4.
Illustration of respiratory parameters base-line-drift (BaselnDrift) and peak-to-peak amplitude.
D. Statistical Analysis
The parameters for body motion and respiratory motion computed before for all studies were used to form box-whisker plots to allow visual portrayal of the overall statistics [17]. In the box-plot, the box includes the values between 25th and 75th percentile, and the line that cuts across the box is the median value. The whiskers include values up to 1.5 times the interquartile range (IQR) away from the top or bottom of the box. The IQR is the difference between the 25th and 75th percentile values. The whiskers correspond to approximately ±2.7σ (or 99.3% coverage) if the data are normally distributed. Values outside this range are labeled as outliers and individually plotted as “+” signs. For testing differences in motion parameters between paired studies of Stress versus. Rest, the Wilcoxon signed rank test was used [18]. For the assessment of statistically significant differences between unbalanced groups (male versus female and exercise versus pharmacological stress), the Wilcoxon rank sum test was used [18]. A statistical summary table was compiled for illustrating the differences between groups. The summary table lists the P-value from the aformentioned tests, the mean, standard deviation, as well as the minimum and maximum values for each parameter and each group. The mean for data not normally distributed (determined by the Lilliefors normality test [19]) was computed robustly by trimming outliers outside the interquartile range [20]. The standard deviation in this case was the normalized interquartile range (i.e., 0.7413 * IQR) [20]. Box-whisker plots are also used for visual illustration of differences between groups.
E. Visual Assessment of Impact of Motion on the Appearance of Spect Slices
To determine whether there was a correlation between the appearance of the emission slices and patient motion as determined by motion-tracking, the transverse slices of all patients who had a body motion of 4 mm or greater sustained for 4 min. or longer, were assessed visually for artifacts in apparent uptake and left-ventricle wall shape. The slices of patients which exhibited more than a 10 mm drift in their respiratory baseline during emission imaging were similarly evaluated. Attenuation correction and resolution recovery were used in reconstructing the slices with OSEM according to our standard methodology employed clinically [21], except that no scatter compensation was performed. The reconstructed slices were post-smoothed with a 3-D Gaussian filter of standard deviation 0.5. No attempt was made to correct the attenuation map for motion during transmission imaging or between emission and transmission imaging. Thus, it too would contribute to the appearance of alterations in the slices.
III. Results
A. Body Motion (Emission Imaging): Overall Statistics
1) Extent of Motion
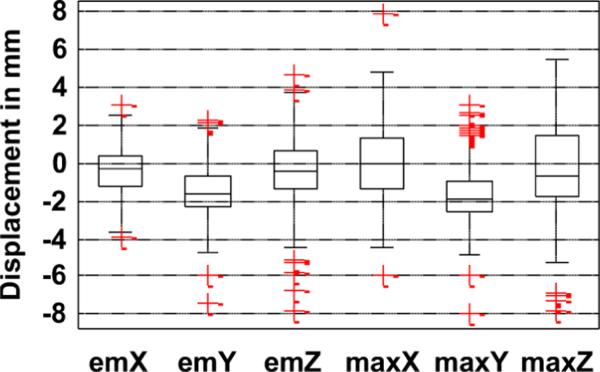
The distribution of the body motion parameters (the total and maximum displacement along X, Y, Z during emission imaging) for all studies is shown in Fig. 5 using the box-whisker plot. Note that the maximum displacement can be larger than the total displacement between the start and end of emission imaging if the patient returns closer to his or her original position with the completion of imaging. This explains the larger size of the box for plots of maximum displacement (i.e., maxX, maxY, and maxZ) than total displacement (i.e., emX, emY, and emZ). Note that the box plots for displacement along Y (emY and maxY), for the most part, lie below zero, which implies most patients exhibit a settling or relaxation pattern. The lateral movement of patients (represented by emX and maxX) was noted by the technologist to be largely associated with hand or shoulder movement and, in many cases, to avoid perceived potential contact with the rotating camera when it came closer at some points of time during imaging. The maximum displacement relative to start position along one or more directions for most studies occurred in the latter half (> 8 min.) of imaging. The median time of maximum displacement along all axes was between 12–13 min.
Fig. 5.
Distribution of nonperiodic body motion parameters tracked for all patient studies. emX, emY, and emZ are the displacements between the start and end of emission imaging, and maxX, maxY, and maxZ are the maximum displacements during emission imaging along the X, Y, and Z axes.
2) Severities and Frequency of Motion
The frequency of occurrence of body motion is reported in Table I for the categories of small motion and large motion sustained for at least a minute, and sustained for at least a quarter of the duration of the emission study. As seen from the table, 39% of the studies contained small motion sustained for at least a minute and 23% sustained for at least a quarter of the duration of the study.
TABLE I.
Body Motion: Frequency of Occurrence
| Based on 110 studies, with 51 stress and 59 rest studies | ||
|---|---|---|
| Sustained > 1 min. | Sustained > 4 min. | |
| Small motion (3–6 mm) | 39% | 23% |
| Large motion (> 6 mm) | 6% | 5% |
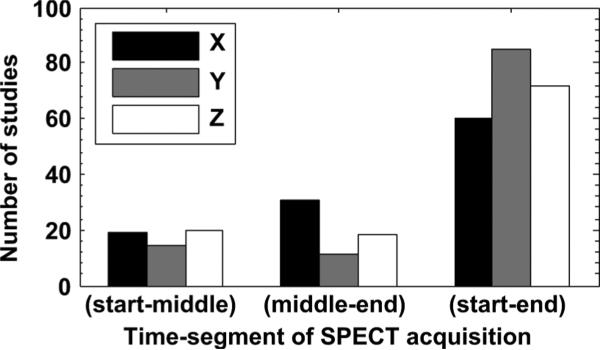
In terms of average position change between the start, middle, and end segments of emission study (shown in Fig. 3), 15% had one-third of the frames displaced from another one-third by more than 3 mm and 3% more than 6 mm. In 4% of the studies, displacement greater than 3 mm occurred between the middle segment and the start or the end. Fig. 6 shows whether maximum change in the average position occurred between the start and middle segment, middle and end, or, between the start and end segment. As seen from the figure, the maximum displacement along all axes was observed for most studies between start and end segments, but for X and Z axes, a considerable number of studies had maximum displacement between other segments implying that for these studies, the patients returned closer to their start position by the end of the emission phase.
Fig. 6.
Histogram showing the distribution of studies with the maximum displacement in segment averaged position between the start and middle, middle and end, and start and end time segments, and along each of the three axes. Most studies show the maximum displacement between start and end segments implying a net displacement during emission.
In evaluating the predominance of motion in Stress or Rest studies, we found that the likelihood of motion was larger in stress (32%) than the Rest (23%) studies. The exercise stress studies also had a higher likelihood of motion (36%) than the pharmacological stress (21%) studies. In male subjects, the likelihood of motion was 33% and in females, it was 71%. These percentages indicate the likelihood of motion over all of the studies in a group. The paired comparison of motion parameters between groups is dealt with separately in Section D for grouped studies.
3) Type of Motion
The motion was found to be gradual in most subjects. Only 15% had sudden movements ranging from 3–6 mm and 2% more than 6 mm. Motion was found to occur predominantly along the Y and Z axis (each in 13% of studies). Only 8% of the studies contained motion along the X axis. The motion along the Y axis was primarily downwards, which we believe is associated with settling or relaxation.
B. Body Motion (Post-Emission): Overall Statistics
At the time of transition from emission imaging to transmission imaging in 4% of studies, sudden movements between 3–7 mm were observed. In 3% of the studies, motion greater than 3 mm occurred between the start and end of transmission imaging. The maximum of the displacements of the average position during transmission from the three time segments (start, middle, and end in Fig. 3) of the emission study was more than 3 mm in 9% of the studies. The distribution of this parameter across all studies is shown in Fig. 7.
Fig. 7.
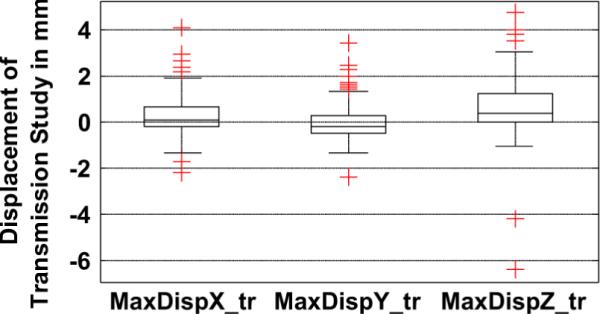
Maximum of the displacements of the average position during transmission from the three time segments during emission along the X (MaxDispX_tr), Y (MaxDispY_tr), and Z (MaxDispZ_tr) axes is shown. Note that in many patients, the displacement during transmission is significant (> 3 mm), especially along the Z axes.
Interestingly, 12% of Rest studies were found to have motion during Transmission which was higher than Stress imaging where only 6% of studies were observed to have motion. Females at 19% showed a higher likelihood than Males at 13%. Exercise and Persantine groups were determined to be similar, with 6% showing motion in each. Again, these percentages indicate the likelihood of motion over all the studies in a group.
The motion during Transmission was significantly more prevalent along the Z axis (90%) than Y and X (10% each), implying that the patients almost always settled in a different axial position relative to emission imaging.
C. Respiratory Motion: Overall Statistics
The distribution of respiratory motion parameters is shown in Fig. 8. The median peak-to-peak amplitude of respiration was between 5–10 mm, and the change over the duration of emission imaging was between 0–2 mm for most studies. The respiratory baseline drifted downwards for all studies, and the amount of drift was between 3–6 mm for most studies. However, significantly higher values of these parameters occur in some studies as indicated by the presence of outliers.
Fig. 8.
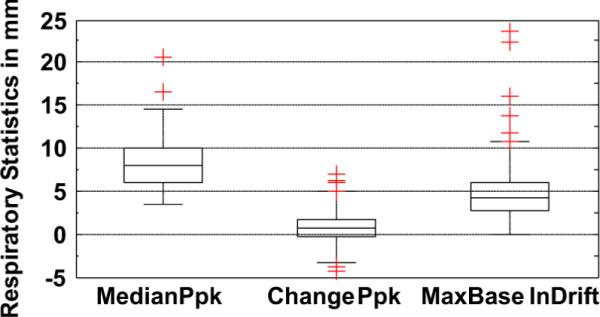
Distribution of respiratory motion parameters. Median peak-to-peak amplitude (MedianPpk) is between 5–10 mm for most patients. Change in peak-to-peak amplitude (ChangePpk) is between 0–2 mm for most patients, though there are many outliers. The drift of respiratory baseline (BaselnDrift) is always positive, implying a settling pattern, and is between 3–6 mm for most patients, though it can be as high as 20 mm in some cases (typically stress studies).
We found that in 24% of the studies, the respiratory baseline drift was greater than 6 mm at some point in time during emission imaging. The maximum respiratory baseline drift was observed to be 23 mm. In 13% of the studies, the respiratory baseline drift at the end of imaging was more than 6 mm below that at the start.
The standard deviation of the peak-to-peak amplitude and baseline of respiration about the median varies between 0–2 mm for most patients, but the variation in respiratory baseline was as large as 6 mm for some studies. In general, greater variation in the respiratory baseline was observed than in the peak-to-peak amplitude.
Fig. 9 shows the average frequency of respiration observed in all studies at the start and at the end of emission imaging. Note that the average frequency at the end of the study is slightly lower than at the start for most patients. High values (>0.35 Hz) occurred in a few patients, and they were consistently high in their stress and rest studies. Low values of average frequency (<0.15 Hz) corresponded to studies from patients with very erratic respiration, as illustrated in Fig. 10. Note that the respiration signal illustrated in this figure seems to have gaps, which is why the average turned out to be low.
Fig. 9.
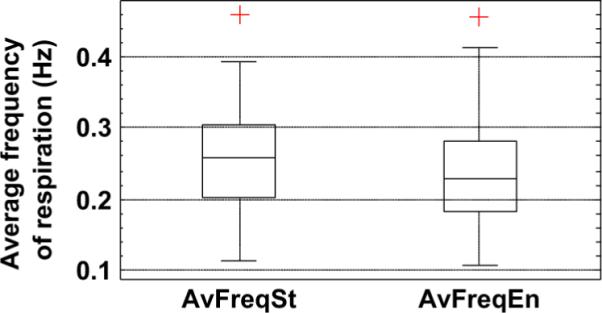
Distribution of the average frequency of respiration computed over 1-min. interval at the start (AvFreqSt) and end (AvFreqEn) of emission imaging. The low values (< 0.15 Hz) were found to correspond to studies where the subject had very erratic respiration. Also note that, on average, the frequency of respiration is lower at the end of the emission study.
Fig. 10.
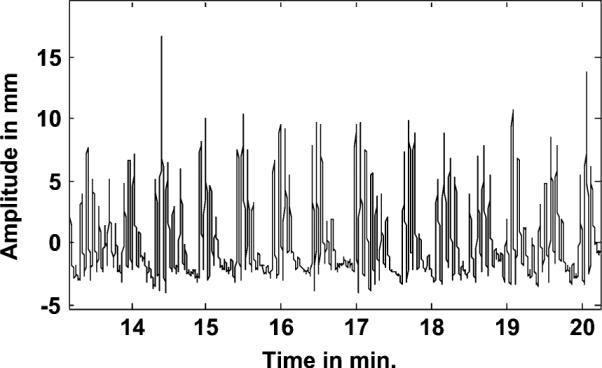
Example of an erratic respiratory signal from a patient.
D. Grouped Studies: Differences in Stress versus Rest
We compared the results of motion tracking in 44 patients who were motion-tracked during stress and subsequent rest imaging. Table II summarizes the significant differences between the two groups.
TABLE II.
Comparison of Motion Parameters in Stress Versus Rest. Values are Reported as Stress; Rest in Each Column
| Motion Parameters | P-value | Mean | Standard Deviation | (Minimum value, Maximum Value) |
|---|---|---|---|---|
| Median peak-to-peak amp. (mm)* | 0.01 | 8.60;7.61 | 2.58;2.68 | (3.48,14.56);(4.03,14.05) |
| Change in peak-to-peak amp.(mm)* | 0.03 | 0.91;0.36 | 2.50;1.59 | (−4.42,6.92);(−3.28,4.92) |
| Max. downward drift of Resp. baseline (mm)* | 0 | 5.08;3.38 | 2.03;1.99 | (1.06,23.60);(0.00,22.39) |
| Standard dev. of peak-to-peak amp. (mm)* | 0 | 1.31;0.93 | 0.75;0.60 | (0.34,3.99);(0.31,2.33) |
| Standard dev. of Resp. baseline (mm)* | 0.01 | 1.16;0.80 | 0.75;0.36 | (0.23,5.55);(0.26,4.04) |
| Avg. frequency of Resp. at the Start (Hz) | 0.28 | 0.26;0.25 | 0.07;0.07 | (0.11,0.39);(0.12,0.37) |
| Avg. frequency of Resp. at the end(Hz)* | 0.01 | 0.22;0.25 | 0.07;0.07 | (0.11,0.35);(0.13,0.41) |
| Change in Avg. frequency of Resp. (Hz)* | 0 | −0.04;−0.01 | 0.05;0.05 | (−0.12,0.07);(−0.11,0.09) |
Significance indicated for statistically significant differences (P-value<0.05) by*
1) Body Motion
The net and maximum displacement along any direction due to body motion during emission phase showed no significant difference at a p level of 0.05 between the stress and rest studies according to the Wilcoxon signed rank test. In addition, the motion between emission and transmission phase was also not significantly different between the groups.
2) Respiratory Motion
Table II shows that the respiratory motion parameters were all significantly different between stress and rest for our Tl-201 patients. This can be seen from the group means and standard deviations reported in Table II for all parameters. The stress studies showed significantly higher median peak-to-peak amplitude (13% higher approximately) and a significantly greater change in this amplitude. Therefore, it is evident that the amplitude of respiration is higher to start with in stress studies, and changes more over the duration of imaging than the rest studies.
The standard deviation of peak-to-peak amplitude and the standard deviation of respiratory baseline were also significantly larger in stress studies, implying greater variations in the respiratory amplitude and respiratory baseline during the stress studies (Table II). The maximum downward drift of the respiratory baseline was also significantly larger (at a p level of 0.05) during stress (1.5 times) as opposed to rest imaging. The respiratory baseline drift varied greatly from one patient to another, and some patients had large drifts in their stress and rest studies. Fig. 11 shows the distribution of the respiratory baseline drift in stress and rest groups.
Fig. 11.
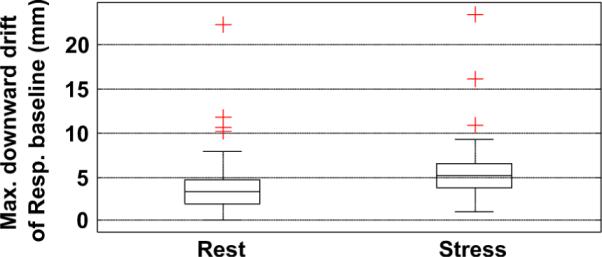
Wilcoxon signed rank test shows a significant difference between stress and rest in the downward drift of the respiration baseline during emission imaging (p = 0.0007).
The change in average frequency of respiration from the start to the end of emission phase was also found to be significantly larger in stress studies, though the frequency at the start of imaging was not significantly different from the rest study (Table II). The average frequency in stress studies generally had decreased at the end of emission imaging about 12% more than that for the rest study. Interestingly, in some cases, the average frequency increased (positive change) from start to end. We found that this occurred in studies where the patient had erratic respiration at the start of the study which became more regular toward the end. In some cases, the patients took large breaths at the start, which also caused the frequency at the start to be lower than at the end. This can be seen in Table II, column 5, where the maximum value for the change in frequency is positive for rest and stress studies.
E. Grouped Studies: Differences in Male versus Female
Based on the motion data from 45 males and 21 females, hypothesis testing using the Wilcoxon rank sum test showed the following differences which are summarized in Table III.
TABLE III.
Comparison of Motion Parameters in Male Versus. Female Studies. Values are Reported as Male;Female in Each Column
| Motion Parameters | P-value | Mean | Standard Deviation | (Minimum value, Maximum Value) |
|---|---|---|---|---|
| Disp. in Y(mm) during Emission* | 0.03 | −1.37;−2.00 | 1.51;1.70 | (−5.91,2.30);(−7.44,1.74) |
| Max. Disp. in Y (mm)* | 0.04 | −1.45;−1.98 | 1.02.1.62 | (−5.91,3.08);(−7.91,2.00) |
| Median peak-to-peak amp. (mm)* | 0 | 8.70;6.25 | 2.67;2.25 | (4.06,20.51);(3.48,12.39) |
| Change in peak-to-peak amp.(mm) | 0.18 | 0.52;0.94 | 2.29;1.34 | (−4.42,6.92);(−2.13,6.02) |
| Max. downward drift of Resp. baseline (mm)* | 0.04 | 4.69;3.88 | 2.35;2.50 | (0.00,23.60);(0.71,11.86) |
| Standard dev. of peak-to-peak amp. (mm)* | 0 | 1.31;0.69 | 0.67;0.24 | (0.39,3.99);(0.31,2.30) |
| Standard dev. of Resp. baseline (mm)* | 0 | 1.15;0.78 | 0.67;0.29 | (0.23,6.28);(0.26,4.04) |
| Avg. frequency of Resp. at the Start (Hz)* | 0.03 | 0.25;0.28 | 0.07;0.07 | (0.11,0.46);(0.12,0.39) |
| Avg. frequency of Resp. at the end(Hz)* | 0 | 0.22;0.26 | 0.07;0.06 | (0.11,0.46);(0.15,0.37) |
| Change in Avg. frequency of Resp. (Hz) | 0.84 | −0.02;−0.02 | 0.05;0.03 | (−0.19,0.16);(−0.10,0.08) |
Significance indicated for statistically significant differences (P-value<0.05) by*
1) Body Motion
The maximum displacement as well as the net displacement during emission imaging along the Y-axis showed a slightly significant difference between male and female subjects, with studies involving female subjects having a greater extent of motion (Table III). Only in the Y direction were these differences statistically significant. Motion between the emission and transmission phase was not significantly different between male and female groups.
2) Respiratory Motion
Median peak-to-peak amplitude of respiration in the male group was found to be significantly higher (39% approximately) than that of females at the p = 0.05 level as seen from Table III. The net change in peak-to-peak amplitude of respiration over the duration of emission imaging was not significantly different at the 0.05 level, but greater variability in the peak-to-peak amplitude was observed in the male studies. The maximum downward drift of the respiration baseline showed a significant difference between the two groups, with more male studies having a larger drift (about 21% more) than females as shown in Fig. 12. The frequency of respiration was significantly higher in the female group (about 15% more) both at the start and the end of the study, but the change in breathing frequency was not significantly different between male and female groups (Table III).
Fig. 12.
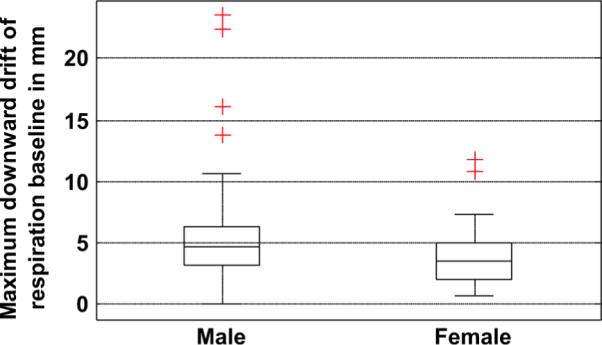
Wilcoxon rank sum test showed significant difference between male and female studies in the downward drift of the respiration baseline during emission imaging (p = 0.03).
F. Grouped Studies: Differences in Exercise versus Pharmacological Stress
For our Tl-201 patients, we compared 36 exercise stress studies with 14 pharmacologically induced (Persantine) stress studies for significant differences in body motion as well as respiratory motion. Wilcoxon rank sum test showed no significant difference in the body motion and respiratory motion parameters between these groups. The respiratory parameters though not significantly different between the groups had larger mean values for exercise stress studies.
G. Visual Assessment of Impact of Motion On Appearance of SPECT Slices
In this study, 9 patients had body motions of 4 mm or more sustained for 4 min or longer and, thus, had their slices evaluated for motion. Another 5 patients had respiratory baseline drift of more than 10 mm and were also evaluated. In all other subjects, the extent of motion is smaller and, hence, they were not investigated. Note that the actual number of studies evaluated is more than the number of patients because a single patient sometimes had two studies (Rest and Stress). No patient in this study had sustained body motion of greater than 2 pixels (9.4 mm). Thus, as observed by others [1], [2], [22] and discussed in Section IV, there were really not any dramatic changes in the appearance of the slices that were anticipated, and none were found. In general, the changes seen were slight to moderate, especially at the mid-to-lower range of motions measured. One difficulty confounding evaluating the changes which were seen was the large variability in the appearance of heart walls in clinical studies. We therefore compared the rest and stress studies of each subject and chose subjects where one of the studies had considerably larger motion than the other for use in illustrating the type of changes seen in the slices in the following figures.
In the patients selected for large changes in the respiratory baseline, the extent of change measured from the abdominal marker signal in the vertical (Y) direction ranged from 1 to 2.4 cm. Note this is not the SI change in the location of the heart, but the change in a signal related to it [13], [14]. Again, in comparing the rest and stress studies of the patients, we found that both the rest and stress studies often exhibited respiratory baseline change, though the extent was typically more in the stress studies. This implies that the respiratory creep is characteristic of a patient rather than an attribute only associated with stress.
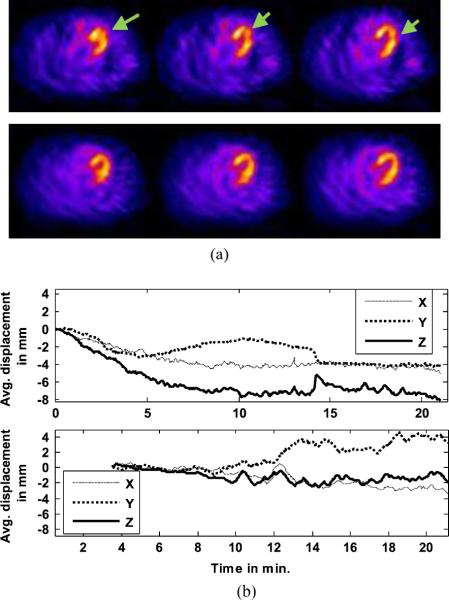
An illustration of an artifact due to body motion can be seen in Fig. 13. Notice that the rest slices show a cooling and change in the shape of the heart wall in the region close to the apex in the rest slices which are easily seen in comparison to the stress studies [Fig. 13(a)]. Comparing the VTS data of the rest and stress studies reveals a maximum motion of about 7 mm along the Z-axis in the rest acquisition, but less motion during the stress acquisition [Fig. 13(b)]. The complete VTS data for the stress emission study was not available due to a technical glitch requiring VTS to be restarted after about 3.5 min. Both studies exhibit about 4-mm drift of the respiratory baseline and fairly constant peak-to-peak amplitude of respiration.
Fig. 13.
(a) Corresponding transverse cardiac slices from the same patient imaged at rest (Top) and stress (Bottom) are shown. A distortion indicated with green arrows in the apparent localization and wall shape due to primarily an axial (along Z-axis) body motion is easily seen in the in the rest-study slices in comparison to the stress slices. (b) The estimated body motion from the chest markers during rest (Top) and stress (Bottom) imaging are shown for the same patient whose slices are shown above. Note that in the rest study, the patient moved in the Z-axis direction approximately 7 mm during emission imaging (i.e., first 15 min), as well as smaller amounts in the other directions. In the stress study, the first 3.5 min of motion-tracking data were not available, but during the remainder of emission imaging, the body motion was within 3 mm in all directions.
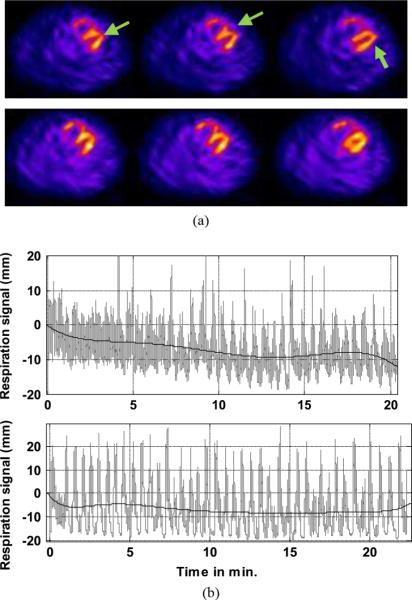
An illustration of the changes seen with primarily a change in the respiratory baseline is given in Fig. 14. Fig. 14(a) shows the corresponding transverse slices of the heart in rest (Top) and stress (Bottom) studies. It can be seen that the left-ventricular walls of the heart appear elongated, the angulation between the septal and lateral wall is increased, and there is a hint of misalignment between these two walls at the apex in the rest study in comparison to the stress study. As seen from the motion-tracking data in Fig. 14(b), the respiration pattern in the stress study was erratic but consistent all through the study, whereas that in the rest study shows a clear drift of the respiratory baseline and increased amplitude in the later part of the study. Body motion was less than 3 mm in both studies.
Fig. 14.
(a) Corresponding transverse cardiac slices from a patient imaged at rest are shown. (Top) and stress (Bottom). A distortion indicated with green arrows at the joining of the septal and lateral walls due to a difference in respiratory motion is easily seen in the in the rest-study slices in comparison to the stress slices. (b) Estimated respiratory motion from an abdominal marker during rest (Top) and stress (Bottom) imaging are shown for the same patient whose slices are shown above. The black line shows the trend over time of the respiratory signal shown in gray. Note that in the rest study, the respiratory trend has a large drift (more than 10 mm by 14 min). The amplitude of respiration also varies greatly especially in the later half of the study. On the other hand, in the stress study after the first minute, the respiratory trend was more consistent and varied only a few millimeters during emission imaging. Body motion as estimated from chest markers was minimal for this patient.
IV. Discussion
The SPECT imaging performed in these studies was conducted on a 10-year-old multiheaded system. It is thus representative of the majority of SPECT systems performing clinical cardiac studies currently. Modern cardiac SPECT systems [23] are now available, however, which can reduce the emission imaging time significantly, and allow the patient to be imaged in what may be more comfortable positions than supine with their arms over their heads. In this study, the maximum gross motion displacement for most studies occurred in the latter half of emission imaging. Thus, the potential for gross body motion should be reduced with these new systems. Similarly, the transmission imaging performed herein requires significantly longer time to be performed than CT imaging on a modern SPECT/CT system [6]. Thus, the potential for gross body motion during CT should be less than what was observed herein for transmission imaging. The transmission system employed herein did provide an indication to the patients that emission imaging was over and a new form of imaging was to start just as the patient was made aware with SPECT/CT imaging that these is a switch from one form of imaging to another. Thus, our measurement of motion occurring at this time, even though the patients were warned in advance to expect the changes and not to move, is indicative of similar things likely to occur with SPECT/CT imaging.
With reference to the literature, we can predict the likelihood of the observed gross body motion causing artifacts. Botvinick et al. [1] conducted an analysis of the impact of the type of motion (vertical or horizontal in terms of the projection data), extent of displacement, the timing of motion during rotation, and duration of motion by simulating motion in normal clinical images through processing of the projection data. They observed that both types of motion caused artifacts, and that it was the combination of duration and extent of motion which predicted the presence of an artifact. That is, a larger magnitude of motion was needed to induce an artifact as the number of frames involved decreased. Prigent [2] performed a similar study of the impact of motion on perfusion SPECT imaging again by modifying a normal clinical study. They looked at vertical “bounces” (motion of 3 or fewer frames), vertical “shifts” (motion of greater than 3 frames), mixtures of these, and lateral motion. They defined a quantitative measure called the “motion pixel area” which was the sum of the pixel deviations over the projections, and determined that a value of greater than 20 was predictive of the presence of artifacts. In a companion paper to their study of the incidence of motion [3], Wheat [22] also performed a study of the impact of motion by altering the projections of a normal SPECT perfusion study. Besides the direction, extent, timing, and duration of motion, they also investigated gantry configuration (i.e., single, dual opposed, dual at 90°, and triple head systems). Their conclusions were similar to those of others with the addition that the impact of motion was also related to the intensity of the heart within the projection. Motion at projection angles where the heart was faintly seen had less of an impact than motion at frames when the heart was well visualized.
In our investigation, stress studies showed a higher likelihood of within emission motion, especially the exercise stress studies. Stress and rest studies showed significant differences mainly in respiratory motion, all of which were associated with a change in respiration due to stress. The peak-to-peak amplitude of respiration at the start of the study as well as the amount it varied over the duration of imaging was significantly greater in stress studies. The maximum downward drift in respiratory baseline was greater in stress studies, which also showed a larger variation of the baseline. Most of the motion was gradual, accumulating over the duration of the study, which will pose some difficulty in correction during reconstruction due to missing angles in motion states and may need different strategies such as list-mode reconstruction.
Motion likelihood in females was found to be significantly higher than males, both during the emission and transmission phase. The extent of motion in the Y direction was also larger in females. We are not sure of the explanation for these observations. In contrast, males were found to exhibit a larger extent of respiratory motion than females. This may have a physiological explanation in the larger pulmonary volume of average males.
The results reported herein are based on the assumption that the externally measured motion from the markers actually is predictive of the motion of the heart within the body. We have conducted preliminary investigations of the correlation between externally measured motion and heart motion using magnetic resonance imaging (MRI) of volunteers [24], [25]. We found that the extent of correlation depends on the type of motion. For a rigid anthropomorphic phantom, translations were predicted with an error of less than 1 mm, and rigid-body motion involving rotations was found to be predicted within 3 mm in 3-D. The use of a 6 mm slice thickness in the lateral direction in MRI leads to this inaccuracy in predicting the MRI motion because the MRI motion was estimated with registration of the premotion and postmotion slices. In human volunteer studies, for the case of translational motions, which might be expected to be rigid-body, the error in position was comparable to that of “no intentional motion” baseline studies, implying that the VTS is very predictive of translational motions of the heart. For the most common types of arm motion, which do not involve the shoulder significantly, the errors were not significantly different from those of the baseline values. With the less common case of arm motion involving a significant motion of the shoulders, the errors were slightly larger than the baseline values so there seemed to be a slight overestimation of heart motion. For the case of exaggerated bends and twists larger than those typically seen clinically, which might be expected to be non-rigid-body for humans, the error margin was larger. Thus, the VTS predicted the majority of the motion in each study, but not as completely as it did for translational motion. Motion of the legs also showed no difference from the baseline studies for the chest markers, but showed some influence on the vertical motion of the abdominal markers. Thus, leg movement might impact the ability to correct respiratory motion during the period of movement.
V. Conclusion
We have employed a motion-tracking system with sub-millimeter and subdegree accuracy to track the motion of markers on the chest and abdomen of patients undergoing cardiac perfusion SPECT imaging. Since we demonstrate that motion can occur at any time, and that gross body motion is more often gradual then abrupt, one conclusion which can be reached is that reducing imaging time will decrease degradation of imaging by motion. Another conclusion is that patients need to be educated before the start of imaging that they must not move during the entire imaging period. This is especially important when a transition between one modality and another occurs, which they may interpret as the end of their imaging study. However, as seen herein, even with this precaution, some patients will still move. Thus, attenuation maps may be misaligned with the studies they are intended to correct for attenuation. Finally, our results demonstrate that respiratory motion may be quite small in some patients, but very large both in terms of the amplitude of respiration and drifting of end-inspiration and end-expiration volumes during imaging in others. Thus, respiratory motion correction would be expected to have a variable impact when applied to patient studies. In some, it may make little difference, in others, the difference will be more pronounced.
Acknowledgment
The contents are solely the responsibility of the authors and do not represent the official views of the NIBIB or Philips Medical Systems. This work was also published in part in “Quantitative Study of Rigid-body and Respiratory Motion of Patients undergoing Stress and Rest Cardiac SPECT Imaging,” by as J.M. Mukherjee, K. Johnson, J. McNamara, J. Dey, and M.A. King, Proceedings of 2008 IEEE Medical Imaging Conference, October 19–25, 2008, pp. 3668 –3672.
This work was supported by the National Institute of Biomedical Imaging and Bioengineering (NIBIB) under Grant R01 EB001457 and a research grant from Philips Medical systems.
Footnotes
Color versions of one or more of the figures in this paper are available online at http://ieeexplore.ieee.org.
References
- [1].Botvinick EH, Zhu YY, O'Connell WJ, Dae MW. A quantitative assessment of patient motion and its effect on myocardial perfusion SPECT images. J. Nucl. Med. 1993;34:303–310. [PubMed] [Google Scholar]
- [2].Prigent FM, Hyun M, Berman DS, Rozanski A. Effect of motion on thallium-201 SPECT studies: A simulation and clinical study. J. Nucl. Med. 1993;34:1845–1850. [PubMed] [Google Scholar]
- [3].Wheat JM, Currie GM. Incidence and characterization of patient motion in myocardial perfusion SPECT: Part 1. J. Nucl. Med. Technol. 2004;32:60–65. [PubMed] [Google Scholar]
- [4].Friedman J, et al. “Upward creep” of the heart: A frequent source of false-positive reversible defects during thallium-201 stress-redistribution SPECT. J. Nucl. Med. 1989 Oct;30(no. 10):1718–1722. [PubMed] [Google Scholar]
- [5].Kinahan PE, Wollenweber SD, Alessio A, Kohlmyer S, MacDonald L, Lewellen T, Ganin A. Impact of respiration variability on respiratory gated whole-body PET/CT imaging. J. Nucl. Med. 2007;48:196P. [Google Scholar]
- [6].Le Meunier L, Maass-Moreno R, Carrasquillo JA, Dieckmann W, Bacharach SL. PET/CT imaging: Effect of respiratory motion on apparent myocardial uptake. J. Nucl Cardiol. 2006;13:821–830. doi: 10.1016/j.nuclcard.2006.09.003. [DOI] [PMC free article] [PubMed] [Google Scholar]
- [7].Goetze S, Wahl RL. Prevalence of misregistration between SPECT and CT for attenuation-corrected myocardial perfusion SPECT. J. Nucl. Cardiol. 2007;14:200–206. doi: 10.1016/j.nuclcard.2006.12.325. [DOI] [PubMed] [Google Scholar]
- [8].Loghin C, Sdringola S, Gould KL. Common artifacts in PET myocardial perfusion images due to attenuation-emission misregistration: Clinical significance, causes, and solutions. J. Nucl. Med. 2004;45:1029–1039. [PubMed] [Google Scholar]
- [9].Gould KL, Pan TS, Loghin C, Johnson NP, Guha A, Sdringola S. Frequent diagnostic errors in cardiac PET/CT due to misregistration of CT attenuation and emission PET images: A definitive analysis of causes, consequences, and corrections. J. Nucl. Med. 2007;48:1112–1121. doi: 10.2967/jnumed.107.039792. [DOI] [PubMed] [Google Scholar]
- [10].Slomka PJ, Le Meunier L, Hayes SW, Acampa W, Obal M, Haemer GG, Berman DS, Germano G. Comparison of myocardial perfusion 82Rb PET performed with CT- and transmission CT-based attenuation correction. J. Nucl. Med. 2008;49:1992–1998. doi: 10.2967/jnumed.108.056580. [DOI] [PubMed] [Google Scholar]
- [11].McNamara JE, Pretorius PH, Johnson K, Mukherjee JM, Dey J, Gennert MA, King MA. A flexible multi-camera visual-tracking system for detecting and correcting motion-induced artifacts in cardiac SPECT slices. Med. Phys. 2009;36:1913–1923. doi: 10.1118/1.3117592. [DOI] [PMC free article] [PubMed] [Google Scholar]
- [12].Mukherjee JM, Mcnamara JE, Johnson KL, Dey J, King MA. Estimation of rigid-body and respiratory motion of the heart for SPECT motion correction. IEEE Trans. Nucl. Sci. 2009 Feb;56(no. 1):147–155. doi: 10.1109/TNS.2008.2010319. [DOI] [PMC free article] [PubMed] [Google Scholar]
- [13].Vedam SS, Kini VR, Keall PJ, Ramakrishnan V, Mostafavi H, Mohan R. Quantifying the predictability of diaphragm motion duringrespiration with a non-invasive external marker. Med. Phys. 2003;30(no. 4):505–513. doi: 10.1118/1.1558675. [DOI] [PubMed] [Google Scholar]
- [14].Nehrke K, Börnert P, Manke D, Böck JC. Free-breathing cardiacMR imaging: Study of implications of respiratory motion-initial results. Radiol. 2001;220:810–815. doi: 10.1148/radiol.2203010132. [DOI] [PubMed] [Google Scholar]
- [15].Danias PG, Stuber M, Botnar RM, Kissinger KV, Edelman RR, Manning WJ. Relationship between motion of coronary arteries and diaphragm during free breathing: Lessons from real-time MR imaging. Amer. J. Roentgenol. 1999 Apr;172(no. 4):1061–1065. doi: 10.2214/ajr.172.4.10587147. [DOI] [PubMed] [Google Scholar]
- [16].Kovalski G, Israel O, Keidar Z, Frenkel A, Sachs J, Azhari H. Correction of heart motion due to respiration in clinical myocardial perfusion SPECT scans using respiration gating. J. Nucl. Med. 2007;48:630–636. doi: 10.2967/jnumed.106.037390. [DOI] [PubMed] [Google Scholar]
- [17].McGill R, Tukey JW, Larsen WA. Variations of boxplots. Amer. Statist. 1978;32(no. 1):12–16. [Google Scholar]
- [18].Hollander M, Wolfe DA. Nonparametric Statistical Methods. Wiley; New York: 1999. [Google Scholar]
- [19].Lilliefors HW. On the Kolmogorov-Smirnov test for normality with mean and variance unknown. J. Amer. Statist. Assoc. 1967;62:399–402. [Google Scholar]
- [20].Wilcox RR. Introduction to Robust Estimation and Hypothesis Testing. 2nd ed. Elsevier; New York: 2005. [Google Scholar]
- [21].Narayanan MV, King MA, Pretorius PH, Dahlberg ST, Spencer F, Simon E, Ewald E, Healy E, MacNaught K, Leppo JA. Human observer ROC evaluation of attenuation, scatter and resolution compensation strategies for Tc-99m myocardial perfusion imaging. J. Nucl. Med. 2003;44:1725–1734. [PubMed] [Google Scholar]
- [22].Wheat JM, Currie GM. Impact of patient motion on myocardial perfusion SPECT diagnostic integrity: Part 2. J. Nucl. Med. Technol. 2004;32:158–163. [PubMed] [Google Scholar]
- [23].Patton JA, Slomka PJ, Germano G, Berman DS. Recent technologic advances in nuclear cardiology. J. Nucl. Cardiol. 2007;14(no. 4):501–513. doi: 10.1016/j.nuclcard.2007.06.003. [DOI] [PubMed] [Google Scholar]
- [24].King MA, Dey J, McNamara JE, Johnson K, Mukherjee JM, Pretorius PH, Lehovich A, Gu S, Walvick R, Sun Y, Ford JC. MRI based assessment of the extent to which stereo-tracking of markers on the chest can predict motion of the heart. Proc. IEEE Medical Imaging Conf. 2008:4306–4310. [Google Scholar]
- [25].King MA, Dey J, McNamara JE, Johnson K, Mukherjee JM, Pretorius PH, Sun Y. MRI investigation of the relationship between the motion of external markers on the body surface and motion of the heart within the chest. J. Nucl. Med. 2009;50:587. [Google Scholar]


