Abstract
Background
Surgeons frequently struggle to determine patient suitability for liver transplantation. Objective and comprehensive measures of overall burden of disease, such as sarcopenia, could inform clinicians and help avoid futile transplants.
Study Design
The cross sectional area of the psoas muscle was measured on CT scans of 163 liver transplant recipients. After controlling for donor and recipient characteristics using Cox regression models, we described the relationship between psoas area and post-transplant mortality.
Results
Psoas area correlated poorly with MELD score and serum albumin. Cox regression revealed a strong association between psoas area and post-transplant mortality (HR=3.7 per 1000 mm2 decrease in psoas area (p<0.0001). Upon stratification into quartiles based on psoas area (holding donor and recipient characteristics constant), one year survival ranged from 49.7% for the quartile with the smallest psoas area to 87.0% for the quartile with the largest. Survival at three years among these groups was 26.4% and 77.2%, respectively. The impact of psoas area on survival exceeded that all other covariates in these models.
Conclusions
Central sarcopenia strongly correlates with post-liver transplant mortality. Such objective measures of patient frailty such as sarcopenia may inform clinical decision making and potentially allocation policy. Further work is needed develop valid and clinically relevant measures of sarcopenia and frailty in liver transplantation.
INTRODUCTION
Better measures of post transplant survival are needed. The current liver transplant allocation system is based upon the Model for End-stage Liver Disease (MELD) score, a validated metric that accurately predicts waitlist survival, and has successfully decreased waitlist mortality among liver transplant candidates by directing organs to the most ill patients.1 As a result, clinicians frequently face difficult decisions regarding the suitability of these extremely ill individuals for liver transplantation. In an effort to avoid futile liver transplants, clinicians assess suitability by considering validated measures of post-transplant survival, such as age, hepatitis C status, hospitalization status, along with medical comorbidities.2, 3 Despite these considerations, a surgeon’s decision is largely related to a subjective assessment of global health status; what some clinicians call “the eye ball test”. Experienced clinicians are likely very good at this, but unfortunately it is difficult to describe and objectively measure, thus difficult the study. A better understanding of this subjective assessment may significantly inform clinical decision making regarding recipient selection.
One objective measure which may describe much of the subjective “eye ball test” is frailty. Frailty is defined as “the biologic syndrome of decreased reserve and resistance to stressors, resulting from cumulative declines across multiple physiologic systems, and causing vulnerability to adverse outcomes”.4 Although best described as a facet of aging, frailty is also understood to play a role in susceptibility and natural history of a wide range of chronic illnesses.5, 6 Frailty can be measured using an array of cognitive and physical tests, and muscle loss (sarcopenia) is one well described component of frailty.7-11 Sarcopenia has been traditionally defined as an aging process, but may be accelerated in chronic medical illness and malnutrition.4-6, 12 Measures of sarcopenia may be particularly attractive to transplant surgeons and policy makers because they are objective and reproducible. Furthermore, measures of muscle mass likely do not reflect acute severity of illness, but are rather chronic indicators of overall health. In all, measuring sarcopenia may underscore the subjective findings noted as part of the “eye ball test”.
In this manuscript, we describe a pilot study describing the relationship between sarcopenia and post-liver transplant survival. To do this, we used peri-operative CT scans to measure the size of the psoas muscle, a core muscle of the trunk susceptible to changes among chronically ill patients, but not acutely ill patients. 7, 8, 13 Our first hypothesis is that liver transplant patients will be sarcopenic and that total psoas area is a valid measure of this sarcopenia. Our second hypothesis is that sarcopenia is associated with outcomes following liver transplantation. Overall, with this work we introduce sarcopenia as a potentially important clinical characteristic of high risk surgical patients. Further study is needed to develop clinically relevant measures of sarcopenia, and to further elucidate the relationship between sarcopenia and transplant outcomes.
METHODS
This study was approved by the University of Michigan Institutional Review Board. We retrospectively reviewed the records of 509 adult patients (≥18 yrs) who underwent liver transplantation at the University of Michigan Medical Center between June 2002 and July 2008. Age, race, sex, etiology of liver disease, MELD score components, presence of portal venous thrombosis, height and weight at the time of operation, donor characteristics, preoperative serum albumin, and post-transplant mortality data were obtained for all patients. Among them, 207 had a CT scan of their abdomen performed within 90 days of transplant. Psoas muscle measurements were available for 192 of these patients. Further re-transplant patients and patients with portal vein thrombosis (N = 29) were eliminated from further analysis. This subpopulation (n=163) served as our study cohort.
Cross-sectional areas of the left and right psoas muscles at the level of the fourth lumbar vertebra (L4) were determined in our study population. This was accomplished by first identifying individual vertebral levels on each patient’s CT scan. We then selected the individual imaging slice at the superior aspect of L4 and outlined the borders of the left and right psoas muscle. The area of the resulting enclosed regions was then computed to generate the cross-sectional area of the psoas muscles. Our morphometric measures were also completed on a control population of 248 trauma patients. These patients underwent blunt trauma and the initial CT done as part of the trauma work-up was analyzed. These steps were completed in a semi-automated fashion using algorithms programmed in MATLAB v13.0.
Descriptive statistics were computed for the study cohort. Continuous variables were summarized by the mean and standard deviation, while frequency tables were produced for categorical variables. Relationships between TPA and age were assessed using standard linear regression techniques for both transplant patients and a control cohort of trauma patients. Similarly, relationships between TPA and both serum albumin and MELD score were assessed using linear regression.
The covariate-adjusted effect of psoas area on post-transplant mortality was ascertained through standard survival analysis methods, namely Cox regression. Patients began follow-up at the time of liver transplant and were followed until the earliest of death or loss to follow-up. Attempts to determine a specific cause of death were made but determined to not be possible in the majority of cases due to case complexity (multi-organ failure related to multiple potential etiologies). Adjustment covariates included recipient age, gender, race, diagnosis height, weight, creatinine, bilirubin, INR, albumin, and donor age. Our model assumes that the effect of total psoas area (TPA) on the post-transplant death hazard is constant (linear) across all TPA values. We carried out various checks to ensure that the TPA effect is being described accurately by our model. For example, we added a quadratic term to the model and found that it was highly non-significant (p=0.98). We then fitted a model with TPA categorized; the trends in the hazard ratios (HRs) corresponding to the TPA categories were supportive of linearity. Further, we examined models containing linear splines and found no evidence of non-linearity. Finally, we tested for interactions between TPA and all other significant covariates and found no significant interactions. Therefore, the original model was deemed to provide an appropriate representation of the effect of TPA on post-transplant mortality.
All analysis used SAS v9.2 (SAS Institute; Cary, NC).
RESULTS
Descriptive statistics of the study population (n=163) are shown in Table 1. The mean age at transplant was 53.2 ± 9.2 and the mean donor age was 40.2 ± 17.0. The mean lab MELD at the time of transplant was 19.3 ± 7.6. Psoas measurements for14.6%) subjects were obtained from scans done in the perioperative, pre-transplant period and psoas measurements for 164 85.4% patients were obtained from scans done in the perioperative, post-transplant period. The right side and left side psoas areas were highly correlated (Pearson correlation coefficient = 0.91; p<0.0001). Therefore, total psoas area (TPA), defined as the sum of right side and left side psoas area, is used for the remainder of the analysis. The mean psoas area was 1960.9 ± 706.5 mm2. The mean psoas density, measured and Hounsfield units (Hu), was 101.4 ± 20.1. A total of 42 patients (25.8 %) died during the period of observation (mean follow-up 4.4 years).
Table 1.
Patient Characteristics (N=163)
| Characteristic | mean ± SD |
|---|---|
| Age at tx | 52.3 ± 9.2 |
| Height (cm) | 171.3 ± 10.0 |
| Weight (kg) | 83.3 ± 20.5 |
| Body mass index | 28.3 ± 6.3 |
| Donor Age | 40.2± 17.0 |
| Preoperative Albumin | 2.8 ± 0.7 |
| Preoperative creatinine | 1.5 ± 1.1 |
| Preoperative INR | 1.6± 0.7 |
| Preoperative total bilirubin | 5.1± 5.1 |
| Lab_MELD | 19.3± 7.6 |
| Total Psoas Area (mm2) | 1960.9± 706.5 |
| Total Psoas Density (Hu) | 101.4± 20.1 |
| BMD | 175.7± 50.3 |
| n (percent) | |
|---|---|
| Race | |
| White African American Other race |
132 (81.0%) 18 (11.0%) 13 (8.0%) |
|
| |
| Event | |
| Death Censoring |
42 (25.8%) 121 (74.2%) |
|
| |
| Gender | |
| Female Male |
60 (36.8%) 103 (63.2%) |
|
| |
| Diagnosis | |
| ETOH HCC HCV PBC PSC Other |
19 (11.7%) 21(12.9%) 57 (35.0%) 9 (5.5%) 17 (10.4%) 40 (24.5%) |
Importantly, we assessed only patients who had a CT scan of the abdomen in the peri-operative period. Upon sensitivity analysis, we did note higher mortality among patients who underwent cross sectional imaging by CT scan (25.8% overall mortality) compared to patients who did not (N = 302, overall mortality 22.8%), though this difference was not statistically significant (p = 0.119 by log-rank test).
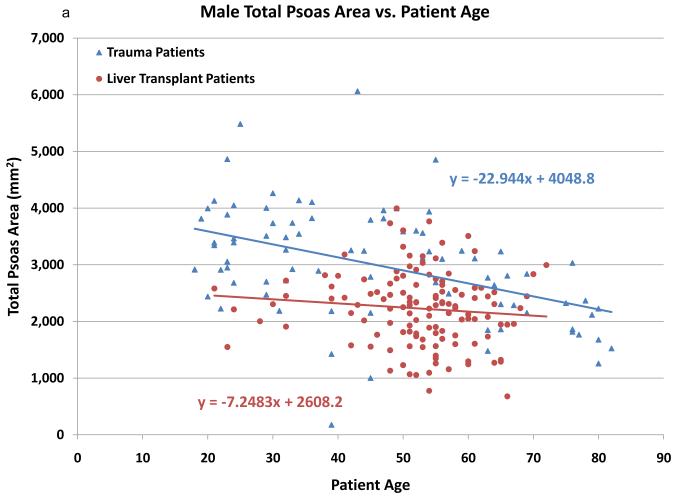
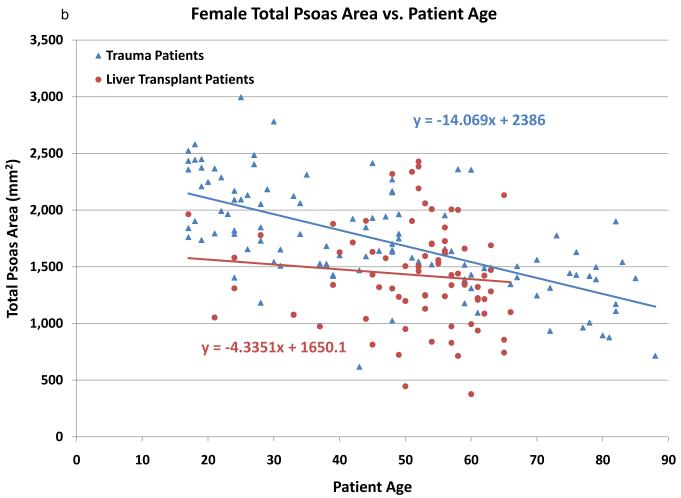
In an effort to validate the hypothesis that CT scans of the psoas muscle will reveal sarcopenia in liver transplant recipients, total psoas area (TPA) among liver transplant recipients was compared to a control group of 248 trauma patients. The trauma patients were significantly younger than the liver transplant patients (37.2 vs. 52.3, p=0.001). As noted in Figures 1a (males) and 1b (females), psoas area is significantly smaller in the liver transplant population. In addition, psoas area declines with increasing age for both trauma and liver transplant patients. Interestingly, the slope of decrease in psoas area is steeper in the trauma patients, while there is significantly less variation by age among the transplant patients.
Figure 1.
The cross sectional area (mm2) of the psoas muscle stratified by age among otherwise healthy trauma patients (blue) and liver transplant recipients (red). Males are shown in figure 1a and females in 1b. Both male and female liver transplant recipients have significantly smaller psoas area compared to trauma patients. Psoas area decreases with age in both groups, though the slope of this decreased is larger in the trauma patients.
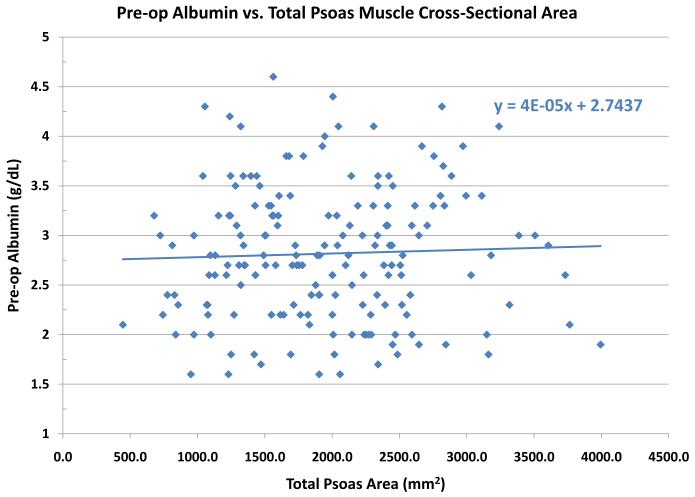
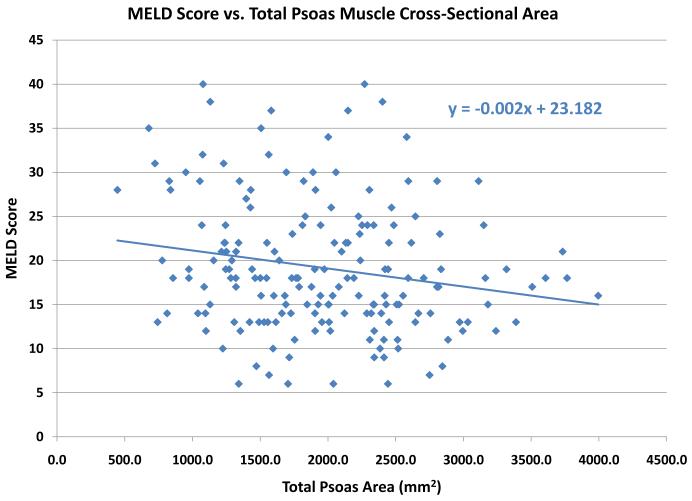
A histogram of TPA showed it was normally distributed (data not shown). Bivariate analysis revealed that TPA was significantly correlated with height (ρ= 0.41; p<0.0001), weight (ρ=0.34; p<0.0001), male gender (ρ=0.55; p<0.0001), and creatinine (ρ=−0.25; p=0.0004). Multiple linear regression using TPA as the response variable indicated that each of weight, gender and creatinine were each significant covariate-adjusted predictors of TPA (p<0.0001 for each). , Serum albumin is another well described marker of operative risk. We note that TPA is poorly correlated with serum albumin levels. (Figure 2) Similarly, we assessed the relationship between TPA and MELD score. There was a relatively weak relationship between MELD score and TPA, with a trend towards a higher TPA among low MELD patients. (Figure 3)
Figure 2.
The cross sectional area (mm2) of the psoas muscle stratified by preoperative serum albumin (g/dL). No clear relationship between TPA and pre-liver transplant serum albumin level was noted.
Figure 3.
The cross sectional area (mm2) of the psoas muscle stratified by preoperative MELD score. A weak relationship is noted between preoperative MELD score and psoas muscle area, with a trend towards larger muscle areas among low MELD patients.
As shown in Table 2, total psoas area had a significant (p<0.0001) effect on post liver transplant mortality, with an adjusted hazard ratio (HR) of HR=0.27 [95% confidence interval (CI) = (0.14, 0.53)] per 1000 mm2 increase in psoas area. Moreover, the model results may more easily be understood by considering that the risk of mortality increased as psoas area decreased (HR=3.7 per 1000 mm2 decrease in psoas area (p<0.0001). Therefore, comparing two liver transplant recipients that differ in TPA by 1000 mm2 but are equal in all other respects, the patient with the higher TPA faces a mortality rate which is 25% that of the patient with the lower TPA. The model seems accurate, considering that other known predictors of mortality (recipient age (HR=1.40 per decade, 95%CI 0.99-1.08) and donor age (1.21 per decade, 95%CI 1.00-1.41) are also correlated with mortality.
Table 2.
Risk Factors for Mortality following Liver Transplantation (Estimated parameters in the Cox model)
| Characteristic | HR (95%CI) | Chi-square statistic |
P-value |
|---|---|---|---|
| Total psoas area (cm2) | 0.274 (0.141, 0.531) | 14.667 | 0.0001 |
|
| |||
| Age at transplant | 1.036 (0.993, 1.080) | 2.624 | 0.105 |
|
| |||
| Height (per 10 cm) | 1.301 (0.811, 2.087) | 1.190 | 0.275 |
|
| |||
| Weight (per 5 kg) | 1.031 (0.948, 1.122) | 0.508 | 0.476 |
|
| |||
| Donor Age | 1.021 (1.002, 1.041) | 4.555 | 0.033 |
|
| |||
| Preoperative Albumin | 0.751 (0.433, 1.302) | 1.039 | 0.308 |
|
| |||
| Preoperative creatinine | 0.804 (0.585, 1.105) | 1.810 | 0.179 |
|
| |||
| Preoperative INR | 0.984 (0.561, 1.725) | 0.003 | 0.955 |
|
| |||
| Preoperative total bilirubin | 1.010 (0.942, 1.084) | 0.080 | 0.778 |
|
| |||
| Race (reference: White) | |||
| African American Other race |
0.451 (0.117, 1.732) 0.241 (0.029, 2.005) |
1.347 1.731 |
0.246 0.188 |
|
| |||
| Gender (reference: Male) | 0.645 (0.219, 1.905) | 0.629 | 0.428 |
|
| |||
| Diagnosis (reference: HCV) | |||
| ETOH HCC PBC PSC Other |
0.588 (0.186, 1.861) 0.782 (0.240, 2.549) 0.409 (0.082, 2.033) 0.338 (0.088, 1.302) 0.759 (0.300, 1.923) |
0.816 0.167 1.193 2.486 0.337 |
0.366 0.683 0.275 0.115 0.561 |
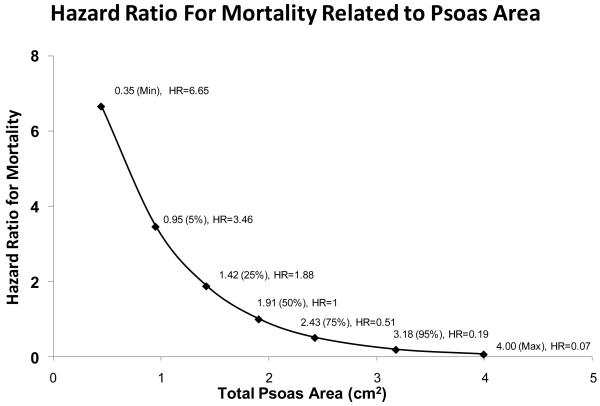
Figure 4 shows the covariate adjusted hazard ratio (overall survival) for TPA across the observed range of TPA. The reference TPA (HR=1) is TPA=1.9 cm2, which is the median TPA in our study population. As shown in Figure 4, the hazard ratio for a patient with TPA=1.42 was HR=1.88; i.e., a patient with TPA at the 25th percentile has almost twice the post-transplant mortality rate of a patient at the median TPA, covariate-adjusted.
Figure 4.
Effect of total psoas area (TPA) in post-liver transplant mortality, as quantified by the covariate adjusted hazard ratio (HR). The reference TPA (HR=1) is TPA=1.91 cm2, which is the median TPA in our study population. The hazard ratio for a patient with TPA=1.42 was HR=1.88; i.e., a patient with TPA at the 25th percentile has almost twice the post-transplant mortality rate of a patient at the median TPA, covariate-adjusted. For patients differing by 1000 mm2 with respect to TPA, the patient with the higher TPA faces a post-transplant mortality rate equal to 25% (HR=0.27) of the patient with the lower TPA.
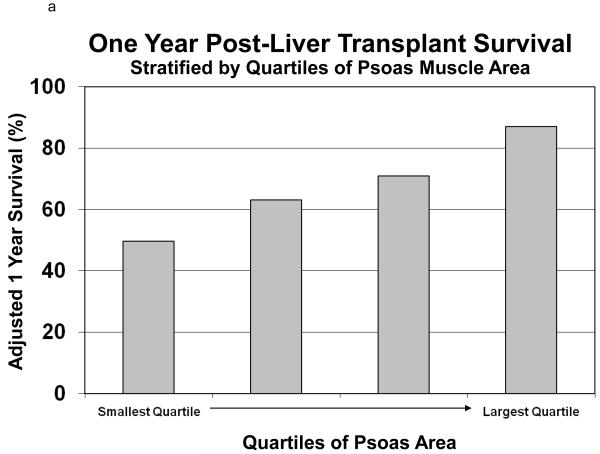
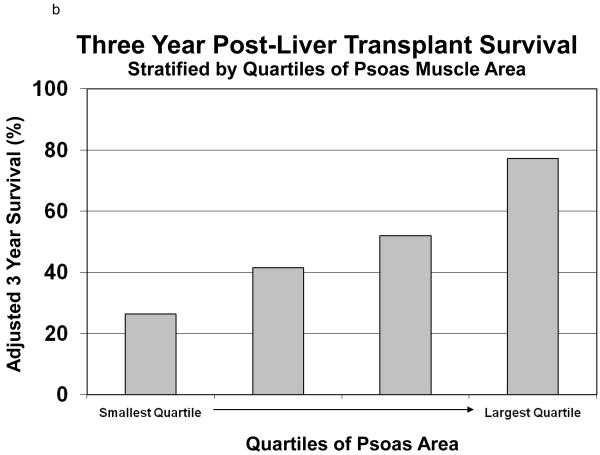
Using the same models, we calculated the covariate adjusted survival of recipients stratified by quartile of TPA. (Figure 5) Holding all other covariates equal among the quartiles of TPA, the one year survival ranged from 49.7% among the group with the smallest TPA compared with 87.0% among the group with the largest TPA. (Figure 5a) Similarly, the three-year survival ranges from 26.4% among the group with the smallest TPA compared with 77.2% among the group with the largest TPA. (Figure 5b)
Figure 5.
This figure shows the adjusted survival (one-year Figure 5a and three-year Figure 5b) of liver transplant recipients, stratified by quartiles of total psoas area (TPA). Holding all other covariates equal among the quartiles of TPA, the one year survival ranged from 49.7% among the group with the smallest TPA compared with 87.0% among the group with the largest TPA. (Figure 5a) Similarly, the three-year survival ranges from 26.4% among the group with the smallest TPA compared with 77.2% among the group with the largest TPA. (Figure 5b)
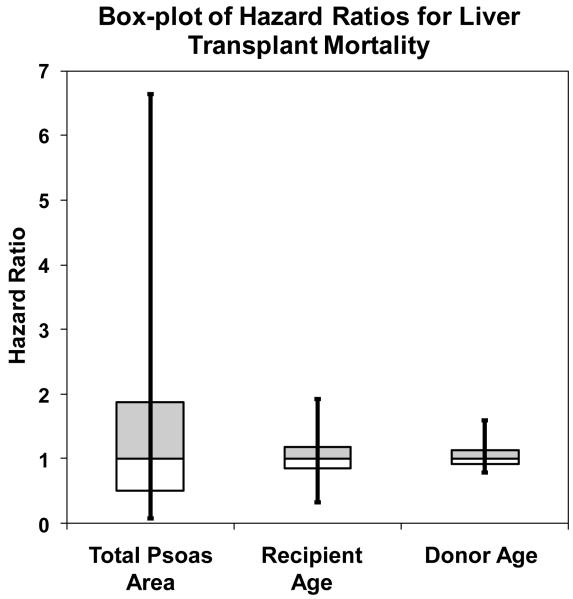
It is important to note that the probability of observing each of the TPA values is not equal. Therefore, in Figure 6 we provide a box-and-whisker plot of the adjusted HR for TPA, recipient age, and donor age. From Figure 6 we can see that differences in TPA values across the study population produce very large differences in post-transplant mortality risk, even after factoring out the impact of the adjustment covariates. When we compare TPA to other covariates (recipient and donor age), we note that TPA is associated with a much more profound variation in the HR for mortality.
Figure 6.
Box-whisker plot of the adjusted hazard ratio (HR) for total psoas area (TPA), recipient age, and donor age. The box includes the central 50% of the data, while the whiskers include the central 90%. The distribution is covariate-adjusted as a HR=1 is assigned for every adjustment covariate. Differences in TPA values across the study population produce very large differences in post-transplant mortality risk, even after factoring out the impact of the other covariates. When we compare TPA to other covariates (recipient and donor age), we note that TPA is associated with a more profound variation in the HR for mortality.
DISCUSSION
With the introduction of MELD based allocation, more liver transplant candidates are severely ill at the time of transplantation. Surgeons are frequently faced with difficult decisions regarding a patient’s suitability for transplantation. Surgeons consider a myraid of clinical factors when assessing a patient for transplant, but frequently at the core of this decision is a subjective patient assessment by an experienced clinician, the so called “eye ball test”. Unfortunately, these subjective assessments are not amenable to study. Potentially, what experienced surgeons maybe assessing is patient frailty and sarcopenia. Both of these are clear components of severe liver disease and intuitively are risk factors for poor outcomes. In this manuscript, we have demonstrated that sarcopenia, as measured by total psoas area, strongly correlates with post-transplant survival. This is an observation from a pilot study with important limitations. Nonetheless, this work introduces the concepts of sarcopenia and frailty to liver transplantation, and potentially to surgery, in general. With further work, objective measures of frailty (such as sarcopenia) have the potential to inform clinical decision making regarding suitability for transplantation and help optimize the utilization of scarce donor organs.
Consideration of a patient’s overall health status including comorbidities, nutritional status, and physical conditioning may better capture his or her medical condition than is possible with an analysis of liver disease alone. Integrative measurements such as this have been formalized into the concept of frailty, and sarcopenia is a significant component of this concept.4 Frailty has been found to be a more robust predictor of functional status in the elderly than age or comorbidities, with increases in an individual’s frailty greatly increasing risk of death.14 Similarly. Sarcopenia has been shown to be predictive of poor outcome following stroke and hip fracture.15, 16 Though most widely used to describe decline associated with aging, sarcopenia is also applicable in the diminished homeostatic reserve seen in chronic illnesses and organ failure.17 As such, sarcopenia may be an ideal characteristic for studying postoperative outcome in the ESLD population.
Sarcopenia may be a particularly attractive prognostic characteristic considering that many conventional frailty measures may be ill-suited to the pre-transplant state. Tests measuring physical stamina and mental acuity may be valid in the general population, but their application is less clear in ESLD patients. Hepatic encephalopathy can diminish an individual’s ability to answer simple questions, while ascites, bleeding diatheses, and fall risk further limit the utility of strength, balance, and endurance exams. It is unclear to what degree traditional frailty measures in this patient population would reflect the changes of primary liver disease, which could be reversed with liver transplantation, or instead correlate with global physiologic decline that may or may not improve with transplantation. Ongoing studies to address this question are underway at our transplant center and others. We propose that a more consistent measure of nutritional and functional state could be found by assessing the degree of sarcopenia using body morphometry. Previous work has established that physical exam and measurement of muscle depth correlate well with traditional frailty indices such as grip strength.18, 19 With this work, we have introduced an objective and reproducible measure of frailty (central sarcopenia on CT scan) correlating with liver transplant outcomes. We have chosen the psoas muscle because changes in the size of muscles of the trunk are thought to best reflect global health and long-term chronic illness.13, 20-22 Future work will need to focus on clinically relevant assessments of both sarcopenia (such as bedside ultrasound) and frailty (bedside frailty assessment). Moreover, it is not clinically practical to get cross-sectional imaging studies to assess muscle size of patients, thus future work will have to consider different approaches to measure patient muscle size. In addition, future work will need to assess other attributes of muscle deterioration such as fat infiltration and fibrosis of muscle.9 Nonetheless, the concept of frailty and sarcopenia are likely clinically important in not only a liver transplantation, but among other surgical realms.
Certainly, this work must be considered within the context of its limitations. Firstly, we report on a relatively small cohort of patients from a single center. Future studies should include a larger sample size and multiple institutions. Secondly, there is significant selection bias for patient inclusion in the study group. We were only able to include liver transplant candidates who had a CT scan of the abdomen in the peri-operative period. More specifically, over the observation period, 509 patients underwent liver transplantation while we were only able to include 163 in our analysis. Presumably, sicker patients would be more likely to receive a CT scan in the perioperative period. Upon sensitivity analysis, we did note higher mortality among patients who did receive a CT scan, though this difference was not statistically significant. In addition, we only compare mortality rates among patients who had a CT scan, thus the overall conclusions of our analyses remain valid. Nonetheless, future work will require prospective data accumulation to prevent such selection bias. Next, we only describe one component of frailty, sarcopenia. Such measures have been validated in a geriatrics population, but never previously studied in patients with liver disease or in the context of major surgery.4, 8, 9, 17 Future work will need to focus on the prospective and longitudinal assessment of validated measures of frailty, in addition to sarcopenia. In an effort to validate our measure of sarcopenia, we have compared liver transplant patients to control (trauma) patients. This comparison suggests a correlation of sarcopenia with chronic illness, but future work will focus on prospectively validating this measure with other accepted measures of frailty and sarcopenia. Potentially, simpler tests of global health status may be clinically more practical. Clinicians have suggested the use of albumin or the presence of ascites within this context in the past, though these measures have been shown to poorly discriminate among this population of severely ill individuals.23, 24 Finally, we focus on post-transplant survival and future work should investigate the potentially important relationship between quality of life and peri-operative sarcopenia.
Overall, this pilot study describes sarcopenia as a factor associated with mortality following liver transplantation. Measures of sarcopenia and frailty may provide important information to patients and clinicians, but additional study measuring sarcopenia and frailty prospectively is needed to more fully define the relationship between outcomes and frailty. It is likely that the path to severe complications and inferior survival among frail patients begins with one or two deviations from routine postoperative recovery, compounded by a diminished physiologic buffer, until a critical point is reached and a poor outcome becomes nearly inevitable. An objective and comprehensive measure of overall burden of disease, such as sarcopenia, could inform novel treatment pathways in an effort to avoid these poor outcomes. Beyond this, proactively measuring sarcopenia and frailty could even mark patients seen at pre-transplant clinic for highly targeted nutritional and physical therapy interventions to prevent or delay functional decline to the point that transplantation cannot be performed. Also, objective measures of frailty (such as central sarcopenia) have the potential to inform benefit based allocation models and help optimize liver transplant outcomes. Future work is needed develop valid and clinically relevant measures of sarcopenia and frailty in liver transplantation.
Acknowledgment
The authors recognize the work of Shaza N. Al-Holou, Sarah A. Lewin, David N. Ranney.
Supported by NIH grant #NIDDK (K08 DK0827508).
Abbreviation definitions
- MELD
Model for End-stage Liver Disease
- L4
fourth lumbar vertebra
- HR
hazard ratio
- Hu
Hounsfield units
- TPA
total psoas area (measured in mm2)
Footnotes
Publisher's Disclaimer: This is a PDF file of an unedited manuscript that has been accepted for publication. As a service to our customers we are providing this early version of the manuscript. The manuscript will undergo copyediting, typesetting, and review of the resulting proof before it is published in its final citable form. Please note that during the production process errors may be discovered which could affect the content, and all legal disclaimers that apply to the journal pertain.
Disclosure information: Nothing to disclose
Presented in part at the American Society of Transplant Surgeons Winter Meeting, Fort Lauderdale, FL, January 2010
REFERENCES
- 1.Wolfe RA, McCullough KP, Leichtman AB. Predictability of survival models for waiting list and transplant patients: calculating LYFT. Am J Transplant. 2009;9(7):1523–7. doi: 10.1111/j.1600-6143.2009.02708.x. [DOI] [PubMed] [Google Scholar]
- 2.Schaubel DE, Guidinger MK, Biggins SW, et al. Survival benefit-based deceased-donor liver allocation. Am J Transplant. 2009;9(4 Pt 2):970–81. doi: 10.1111/j.1600-6143.2009.02571.x. [DOI] [PMC free article] [PubMed] [Google Scholar]
- 3.Sharma P, Schaubel DE, Sima CS, et al. Re-weighting the model for end-stage liver disease score components. Gastroenterology. 2008;135(5):1575–81. doi: 10.1053/j.gastro.2008.08.004. [DOI] [PubMed] [Google Scholar]
- 4.Lang PO, Michel JP, Zekry D. Frailty Syndrome: A Transitional State in a Dynamic Process. Gerontology. 2009;55:539–549. doi: 10.1159/000211949. [DOI] [PubMed] [Google Scholar]
- 5.Fried LP, Tangen CM, Walston J, et al. Frailty in older adults: evidence for a phenotype. J Gerontol A Biol Sci Med Sci. 2001;56(3):M146–56. doi: 10.1093/gerona/56.3.m146. [DOI] [PubMed] [Google Scholar]
- 6.Marcell TJ. Sarcopenia: causes, consequences, and preventions. J Gerontol A Biol Sci Med Sci. 2003;58(10):M911–6. doi: 10.1093/gerona/58.10.m911. [DOI] [PubMed] [Google Scholar]
- 7.Cawthon PM, Fox KM, Gandra SR, et al. Do muscle mass, muscle density, strength, and physical function similarly influence risk of hospitalization in older adults? J Am Geriatr Soc. 2009;57(8):1411–9. doi: 10.1111/j.1532-5415.2009.02366.x. [DOI] [PMC free article] [PubMed] [Google Scholar]
- 8.Lang T, Streeper T, Cawthon P, et al. Sarcopenia: etiology, clinical consequences, intervention, and assessment. Osteoporos Int. 2009;21:543–559. doi: 10.1007/s00198-009-1059-y. [DOI] [PMC free article] [PubMed] [Google Scholar]
- 9.Goodpaster BH, Park SW, Harris TB, et al. The loss of skeletal muscle strength, mass, and quality in older adults: the health, aging and body composition study. J Gerontol A Biol Sci Med Sci. 2006;61(10):1059–64. doi: 10.1093/gerona/61.10.1059. [DOI] [PubMed] [Google Scholar]
- 10.Park SW, Goodpaster BH, Lee JS, et al. Excessive Loss of Skeletal Muscle Mass in Older Adults with Type 2 Diabetes. Diabetes Care. 2009;32:1993–1997. doi: 10.2337/dc09-0264. [DOI] [PMC free article] [PubMed] [Google Scholar]
- 11.Park SW, Goodpaster BH, Strotmeyer ES, et al. Accelerated loss of skeletal muscle strength in older adults with type 2 diabetes: the health, aging, and body composition study. Diabetes Care. 2007;30(6):1507–12. doi: 10.2337/dc06-2537. [DOI] [PubMed] [Google Scholar]
- 12.Lee JS, Auyeung TW, Kwok T, et al. Associated factors and health impact of sarcopenia in older chinese men and women: a cross-sectional study. Gerontology. 2007;53(6):404–10. doi: 10.1159/000107355. [DOI] [PubMed] [Google Scholar]
- 13.Pahor M, Manini T, Cesari M. Sarcopenia: clinical evaluation, biological markers and other evaluation tools. J Nutr Health Aging. 2009;13(8):724–8. doi: 10.1007/s12603-009-0204-9. [DOI] [PMC free article] [PubMed] [Google Scholar]
- 14.Buchman AS, Wilson RS, Bienias JL, et al. Change in frailty and risk of death in older persons. Exp Aging Res. 2009;35(1):61–82. doi: 10.1080/03610730802545051. [DOI] [PMC free article] [PubMed] [Google Scholar]
- 15.Longstreth WT, Jr., Bernick C, Fitzpatrick A, et al. Frequency and predictors of stroke death in 5,888 participants in the Cardiovascular Health Study. Neurology. 2001;56(3):368–75. doi: 10.1212/wnl.56.3.368. [DOI] [PubMed] [Google Scholar]
- 16.Tosteson AN, Gottlieb DJ, Radley DC, et al. Excess mortality following hip fracture: the role of underlying health status. Osteoporos Int. 2007;18(11):1463–72. doi: 10.1007/s00198-007-0429-6. [DOI] [PMC free article] [PubMed] [Google Scholar]
- 17.Cesari M, Leeuwenburgh C, Lauretani F, et al. Frailty syndrome and skeletal muscle: results from the Invecchiare in Chianti study. Am J Clin Nutr. 2006;83(5):1142–8. doi: 10.1093/ajcn/83.5.1142. [DOI] [PMC free article] [PubMed] [Google Scholar]
- 18.Woods NF, LaCroix AZ, Gray SL, et al. Frailty: emergence and consequences in women aged 65 and older in the Women’s Health Initiative Observational Study. J Am Geriatr Soc. 2005;53(8):1321–30. doi: 10.1111/j.1532-5415.2005.53405.x. [DOI] [PubMed] [Google Scholar]
- 19.Xue QL, Bandeen-Roche K, Varadhan R, et al. Initial manifestations of frailty criteria and the development of frailty phenotype in the Women’s Health and Aging Study II. J Gerontol A Biol Sci Med Sci. 2008;63(9):984–90. doi: 10.1093/gerona/63.9.984. [DOI] [PubMed] [Google Scholar]
- 20.Boirie Y. Physiopathological mechanism of sarcopenia. J Nutr Health Aging. 2009;13(8):717–23. doi: 10.1007/s12603-009-0203-x. [DOI] [PubMed] [Google Scholar]
- 21.Bouchard DR, Dionne IJ, Brochu M. Sarcopenic/obesity and physical capacity in older men and women: data from the Nutrition as a Determinant of Successful Aging (NuAge)-the Quebec longitudinal Study. Obesity (Silver Spring) 2009;17(11):2082–8. doi: 10.1038/oby.2009.109. [DOI] [PubMed] [Google Scholar]
- 22.Visser M. Towards a definition of sarcopenia--results from epidemiologic studies. J Nutr Health Aging. 2009;13(8):713–6. doi: 10.1007/s12603-009-0202-y. [DOI] [PubMed] [Google Scholar]
- 23.Angermayr B, Luca A, Konig F, et al. Aetiology of cirrhosis of the liver has an impact on survival predicted by the Model of End-stage Liver Disease score. Eur J Clin Invest. 2009;39(1):65–71. doi: 10.1111/j.1365-2362.2008.02063.x. [DOI] [PubMed] [Google Scholar]
- 24.Luca A, Angermayr B, Bertolini G, et al. An integrated MELD model including serum sodium and age improves the prediction of early mortality in patients with cirrhosis. Liver Transpl. 2007;13(8):1174–80. doi: 10.1002/lt.21197. [DOI] [PubMed] [Google Scholar]


