Abstract
The multicolor and multiplexing capabilities of semiconductor quantum dots (QDs) are most promising for improving the sensitivity and specificity of in vitro molecular and cellular diagnostics. Here, we report the use of multiplexed QDs and wavelength-resolved imaging to detect and characterize a class of low-abundant tumor cells in Hodgkin’s lymphoma. Known as the Hodgkin’s and Reed-Sternberg (HRS) cells, this class of malignant cells is a pathological hallmark in clinical diagnosis, but it comprises only about 1% of the heterogeneous infiltrating cells in lymph node tissues. To overcome this cellular heterogeneity and rarity problem, we have developed multicolor QD–antibody conjugates to simultaneously detect a panel of four protein biomarkers (CD15, CD30, CD45, and Pax5) directly on human tissue biopsies. This multiplexing approach allows rapid detection and differentiation of rare HRS cells from infiltrating immune cells such as T and B lymphocytes. We have also carried out clinical translation studies involving six confirmed Hodgkin’s lymphoma patients, two suspicious lymphoma cases, and two patients with reactive lymph nodes (but not lymphoma). The results indicate that a distinct QD staining pattern (CD15 positive, CD30 positive, CD45 negative, and Pax5 positive) can be used to not only detect Hodgkin’s lymphoma but also differentiate it from benign lymphoid hyperplasia.
Semiconductor quantum dots (QDs) are currently under intense development for use as a new class of fluorescent labels.1–4 In comparison with organic dyes and fluorescent proteins, quantum dots have unique optical properties such as size-tunable light emission, superior signal brightness, resistance to photobleaching, and simultaneous excitation of multiple fluorescence colors. These properties are believed to be most promising for improving the sensitivity and multiplexing capabilities of molecular pathology and in vitro diagnostics.5–7 In contrast to in vivo imaging applications where the potential toxicity of cadmium-containing QDs is a major concern,4 immunohistological staining is performed in vitro on clinical diagnostic materials. Indeed, recent work by several groups8–17 has demonstrated the advantages of multicolor QD detection for multiplexed cellular staining and heterogeneous immunoassays. However, QD-based multicolor imaging has not been developed for detecting and characterizing rare cells in the complex microenvironments of heterogeneous tumor tissue specimens and cell populations. The rationale is that the simultaneous use of multiple molecular biomarkers can improve both diagnostic sensitivity and specificity. 18 In addition, because multiplexed QD staining can be carried out on intact cells and tissue specimens, it is expected to provide correlated molecular and morphological information. This type of integrated biomarker and morphological data is not available from traditional analytical methods such as mass spectrometry, gene chips, protein microarrays, and polymerase chain reactions (PCR).15–22
Here, we report the use of multiplexed QD–antibody conjugates and wavelength-resolved imaging (spectral imaging)23,24 to detect and characterize a class of low-abundant Hodgkin’s and Reed-Sternberg (HRS) cancer cells in classical Hodgkin’s lymphoma. The presence of the mononucleated Hodgkin’s and the multinucleated Reed-Sternberg cells is a cellular hallmark that differentiates Hodgkin’s from non-Hodgkin’s lymphoma and is widely used for definitive diagnosis of this disease.25–28 However, the malignant HRS cells represent only less than 1% of the tumor infiltrating cells in clinical tissue specimens, as the vast majority of cells are T-lymphocytes, B-lymphocytes, histocytes, eosinophilic granulocytes, and plasma cells.27,28 Current methods for Hodgkin’s lymphoma diagnosis are based on morphological examination (H and E staining) and immunohistochemistry (IHC), but these methods are often limited by indecisive or ambiguous diagnosis (that is, unable to reach a clinical decision).27,28 To overcome the problems associated with tissue heterogeneity and low-abundant and rare cells, we have used multiplexed QDs to detect a panel of four protein biomarkers (CD15, CD30, CD45, and Pax5) for immunophenotyping studies of HRS and tumor infiltrating cells.29,30 The results indicate that this multiplexing approach allows rapid detection and identification of rare HRS cells within the complex microenvironments of tissue biopsies. In addition, we have carried out clinical translation studies involving six confirmed Hodgkin’s lymphoma patients, two suspicious lymphoma, and two patients with reactive lymph nodes but not lymphoma. We find that a distinct QD staining pattern (CD15 positive, CD30 positive, CD45 negative, and Pax5 positive) can be used to detect and differentiate Hodgkin’s lymphoma from benign lymph node inflammation.
EXPERIMENTAL SECTION
Lymphoma Tissue Specimens
Deidentified human tissue sections of archived formalin-fixed paraffin-embedded (FFPE) blocks were obtained from the Veteran Affairs Medical Center in Decatur, Georgia. Tissue slices (approximately 5 µm thick) were sectioned and placed on positively charged glass slides. The slides were preheated at 60–65 °C for 15 min and then went through the steps of deparaffinization using xylene. Hydration of the slides was performed using a series of ethanol solutions of decreasing concentrations (100%, 95%, 80%, and 70%, twice for each concentration, 2 min in each step). Antigen retrieval was performed using a decloaking chamber (125 °C for 30 s, then 90 °C for 10 s) with common decloaking buffers (Biocare Medical, Concord, CA). The slides were cooled in the decloaking buffer for 20 min, washed in DI water, and stored in 1×PBS plus buffer (containing 0.05% Tween 20).
Multiplexed QD Immunostaining
Multiplexed QD staining was performed, at room temperature, using an automated tissue processing and staining instrument (Nemesis 7200, Biocare Medical, Concord, CA). The use of this robotic system reduced slide-to-slide variations and allowed staining experiments in a high-throughput manner. In the preprogrammed procedure, the slide surface was blocked by 2% BSA/5% goat serum/1×PBS for 30 min at room temperature. The slides were incubated with a mixture of the primary antibodies CD30 (mouse monoclonal, clone Ber-H2, 1:25 dilution, Dako) and Pax5 (rabbit polyclonal, RB-9406-P1, 1:25 dilution, Thermo Fisher Scientific Inc., Fremont, CA) for 1 h. After washing with 1×PBS plus buffer twice, a mixture of the secondary antibody conjugated Qdots (goat antirabbit QD655 and goat antimouse QD605, Invitrogen) was applied to the slides for 2 h. The slides were washed with 1× PBS plus buffer three times. Then, another cycle of QD immunostaining was performed for two additional antigens, using a mixture of the primary antibodies CD15 (mouse monoclonal, clone C3D-1, 1:20 dilution, Dako, Carpinteria, CA) and CD45 (rabbit polyclonal, sc-25590, 1:25 dilution, Santa Cruz Biotechnology Inc., Santa Cruz, CA) and a mixture of goat antirabbit QD565 and goat antimouse QD525 (Invitrogen, Carlsbad, CA). Then, 4′,6-diamidino-2-phenylindole (DAPI) counterstaining (100 ng/mL) was performed, followed by washing with DI water. The slides were dehydrated and cover-slipped using mounting media (Ecomount, Biocare Medical, Concord, CA).
Spectral Imaging and Data Analysis
A multispectral imaging system (Nuance, CRI, Woburn, MA) was mounted on an inverted fluorescence microscope (Olympus I×71, Olympus America Inc., Center Valley, PA) for wavelength-resolved imaging and data acquisition. Near-UV excitation at 350 nm was obtained with a mercury lamp, and a long-pass filter was used to pass the QD fluorescence signals. A series of images (called image stacks or image cubes) were captured in the wavelength range of 500–800 nm at 10 nm increments with a liquid-crystal tunable filter. A spotted array of QDs on the glass slide was used to construct a library of individual QD spectra. Tissue background (autofluorescence) spectra were obtained from control (unstained) specimens.
Traditional Immunohistochemistry
Consecutive slides from the same tissue block were stained using standard DAB chromagen immunohistochemistry. One protein biomarker was stained on one tissue section. Briefly, after tissue pretreatment as described above and subsequent endogenous enzyme blocking for 15 min, the slides were loaded into the same autostaining machines. The MACH-4 detection system (Biocare Medical, Concord, CA) was used for enhanced sensitivity. The routine counterstaining step with hematoxylin was omitted so that monocolor images from control slides could be used for comparison. Images of IHC-stained tissues were acquired using a color CCD camera attached to an inverted Olympus microscope.
RESULTS
Multiplexed QD Staining
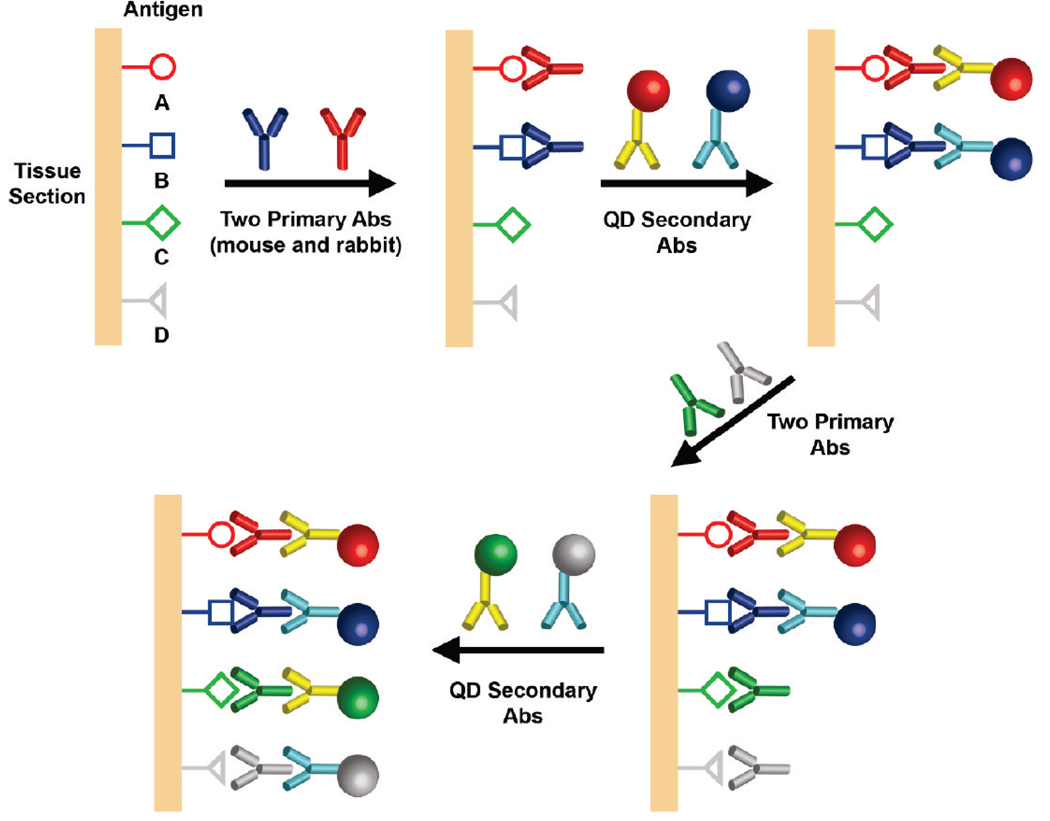
As illustrated in Figure 1, quantum dots conjugated with secondary antibodies are used in a sequential manner to build up the degrees of multiplexing. In comparison with the use of QD–primary antibody conjugates,5,6,17 the main advantage of our multicolor indirect method is its consistency and reproducibility: that is, reliable results are obtained from adjacent tissue sections. Also, this approach requires antibodies from only two animal species that are available in high quality and large quantities at low costs. These two advantages are both important in enabling large-scale application of QDs in clinical pathology. Some potential problems, however, are that the secondary antibody could dissociate from the primary antibody and that the primary antibody itself could dissociate from the tissue antigen. Both of these processes could occur during the washing steps as well as during the second round of staining. A potential strategy to overcome this problem is to cross-link the QD–antibody–antigen complex using common tissue fixatives such as formaldehyde, glutaraldehyde, or ethyl dimethylaminopropyl carbodiimide (EDC).31
Figure 1.
Schematic illustration of multiplexed QD tissue staining in which two primary antibodies from two animal species (e.g., primary rabbit and mouse antibodies) are used to recognize two tissue antigens. After washing, a mixture of two secondary antibody–QD conjugates is applied to stain the two primary antibodies. The same procedure is repeated using primary antibodies for additional antigens, followed by the use of secondary antibody QD conjugates.
It is important to note that an excess of QDs conjugated with secondary antibodies can be used to deplete the antigenic sites on primary antibodies when the binding mixture is incubated for an extended period of time (2 to 3 h). Under these conditions, the percentage of “empty” epitopes on the primary antibody is largely determined by the equilibrium constant of primary antibody and QD–secondary antibody binding, thereby avoiding the complications of time-dependent binding kinetics. As a result, during the second round of staining, QD binding takes place mainly at the new primary antibody sites (introduced during the second round). We have experimentally evaluated the performance of sequential QD staining using two protein biomarkers and have shown that-nonspecific QD binding signals are less than 5–10% of their specific binding signals, a level that is low enough for multiplexed QD studies on tissue specimens.32 Also, a similar 4-color QD staining method has been used to map the molecular and cellular heterogeneity of human prostate cancer, but the current work uses a new set of protein biomarkers and aims at addressing the analytical challenge in detection of rare tumor cells.
Biomarker Selection
A panel of four protein biomarkers is used for multiplexed QD detection of Hodgkin’s lymphoma. As summarized in Table 1, the first marker CD15 is a transmembrane protein expressed in HRS cells and certain types of epithelial cells.33 The second marker CD30 is a cytokine receptor belonging to the tumor necrosis factor (TNF) receptor superfamily, and it is expressed in HRS cells, anaplastic large cell lymphomas, and some activated T cells and B cells.34 The third marker CD45 is another transmembrane protein involved in costimulation of differentiated hematopoietic cells; it is expressed in mature activated T-cells and a subpopulation of resting T-cells but is absent in the HRS cells of classic Hodgkin’s lymphoma.35 Finally, the protein biomarker Pax5 is used for detecting the cell nuclei of B-cell lineage and classic Hodgkin’s lymphoma.36 As discussed below, these four protein biomarkers can be used in a multiplexed manner to detect and differentiate the malignant HRS cells from infiltrating immune cells such as T and B lymphocytes.
Table 1.
Summary of Protein Biomarkers and QD–Antibody Conjugates for Detection and Differentiation of Malignant Hodgkins’ and Reed-Sternberg (HRS) Cells from Infiltrating T and B cellsa
| biomarkers/cell type | CD15 | CD30 | CD45 | Pax5 |
|---|---|---|---|---|
| H/RS cell | + | + | − | + |
| T cell | − | − | + | − |
| B cell | − | − | + | + |
| cellular location | membrane and golgi | membrane and golgi | membrane/cytoplasmic | nuclear |
| QD emission spectra (wavelength) | 705 nm | 605 nm | 565 nm | 655 nm |
| coding color | white | red | green | blue |
Notes: The symbols + and − denote positive and negative biomarker expression, respectively.
Multiplexed Detection of HRS Cells
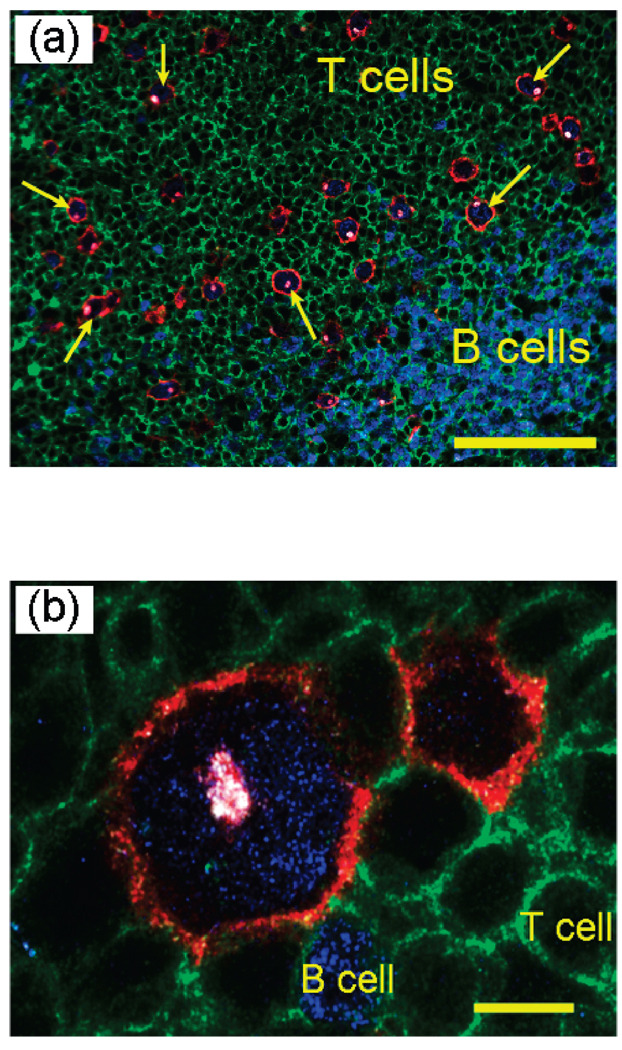
As shown in Figure 2, malignant HRS cells are detected and identified by a distinct staining pattern of multicolor QD probes. These cells show intense membrane (red circle) and Golgi (dot inside the red circle) fluorescence signals, corresponding to QD staining of CD30 (red) and CD15 (white) antigens. The HRS cells also show intense nuclear staining (Pax5, blue) but little or no CD45 staining (green). This unique multiplexing pattern allows HRS cells to be differentiated from infiltrating T cells (CD45 positive, stained green) and B cells (Pax4 positive, stained blue). Quantitative image analysis reveals that CD30 and CD15 are colocalized in HRS cells (especially in the Golgi, see Figure 2b), but the membrane staining signal of CD30 is much stronger than that of CD15, thus resulting in the predominantly “red” color observed at the HRS cell membrane.
Figure 2.
Multiplexed QD staining images of HRS malignant cells and infiltrating immune cells on lymph node tissue specimens of a Hodgkin’s lymphoma patient. (A) Malignant HRS cells (red membrane, blue nuclear, and read/whitish Golgi) are identified by a unique multiplexed staining pattern of CD30 positive (membrane staining), CD15 positive (Golgi staining), Pax5 positive (nuclear staining), and CD45 negative. They are differentiated from infiltrating B cells (blue nuclear staining) and T cells (green membrane staining). A few prominent HRS cells are indicated with arrows. Scale bar: 100 µm. (B) Detailed view showing the distinct staining patterns of HRS cells, B cells, and T cells. Scale bar: 10 µm.
Comparison with Single-Marker IHC
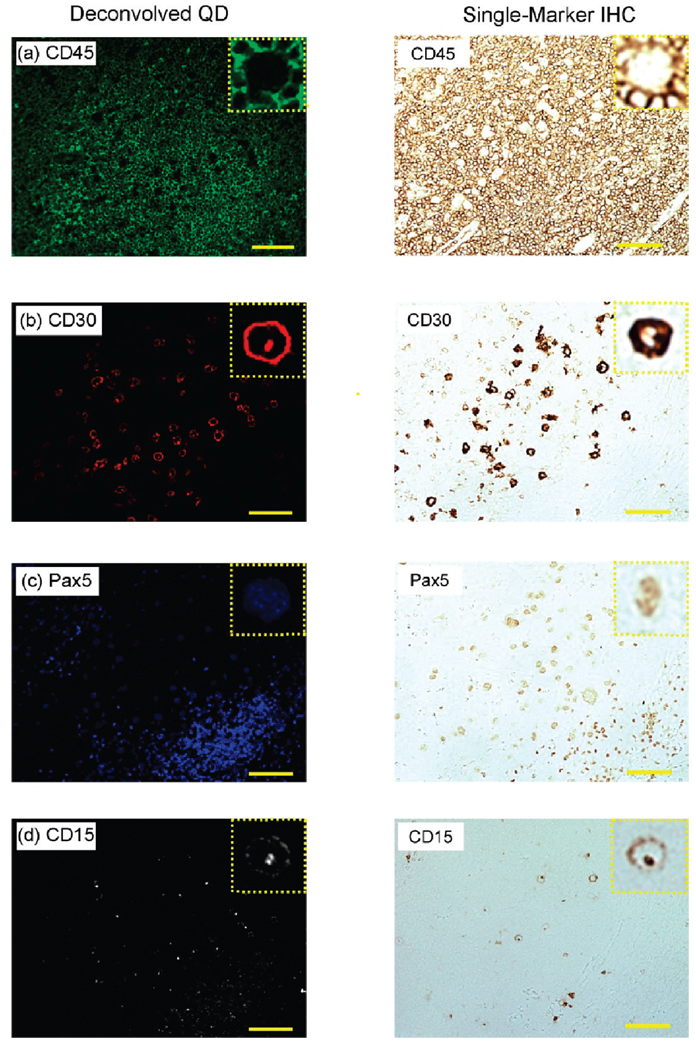
For cross validation, we have compared our multiplexed QD staining results with traditional single-color immunohistochemistry (IHC) using adjacent tissue sections. When cut in a consecutive manner, these adjacent tissue sections show similar cellular contents and morphological features. Thus, a series of five consecutive tissue slices were obtained from a Hodgkin’s lymphoma patient; one slice was used for multiplexed QD staining (four biomarkers, as described above), and the remaining four slices were used for conventional single-color IHC staining (one marker on each tissue section). The multiplexed QD image was separated by spectral deconvolution into four single-color images corresponding to the expression patterns of individual biomarkers (Figure 3, left). The deconvolved QD images are then compared with the single-color IHC images obtained from the same area of interest on adjacent tissue sections (Figure 3, right). It should be noted that the adjacent tissue sections are similar but not identical, so this comparison is only approximate. By and large, the deconvolved QD images contain similar features and patterns as the IHC images, indicating that multiplexed QD staining is well correlated with IHC. For example, the QD and IHC images of CD45 expression show consistently membrane-stained T cells, and CD30 and CD15 double staining is observed for malignant HRS cells with both QD and IHC. For the nuclear biomarker PAX5, both QD and IHC staining reveals more intense signals in the nuclei of B cells than that of HRS cells.
Figure 3.
Comparison of deconvolved QD images with conventional single-marker IHC using adjacent tissue sections of lymph node biopsies. The deconvolved QD images were obtained from multiplexed QD data by spectral imaging and separation. The single-marker IHC images were obtained from adjacent tissue sections following standard protocols. The protein biomarkers are (a) CD45, (b) CD30, (c) Pax5, and (d) CD15. Scale bar: 100 µm. Detailed comparison of single cells are shown in insets (expanded).
Lymphoma, Suspicious Lymphoma, and Reactive Lymph Nodes
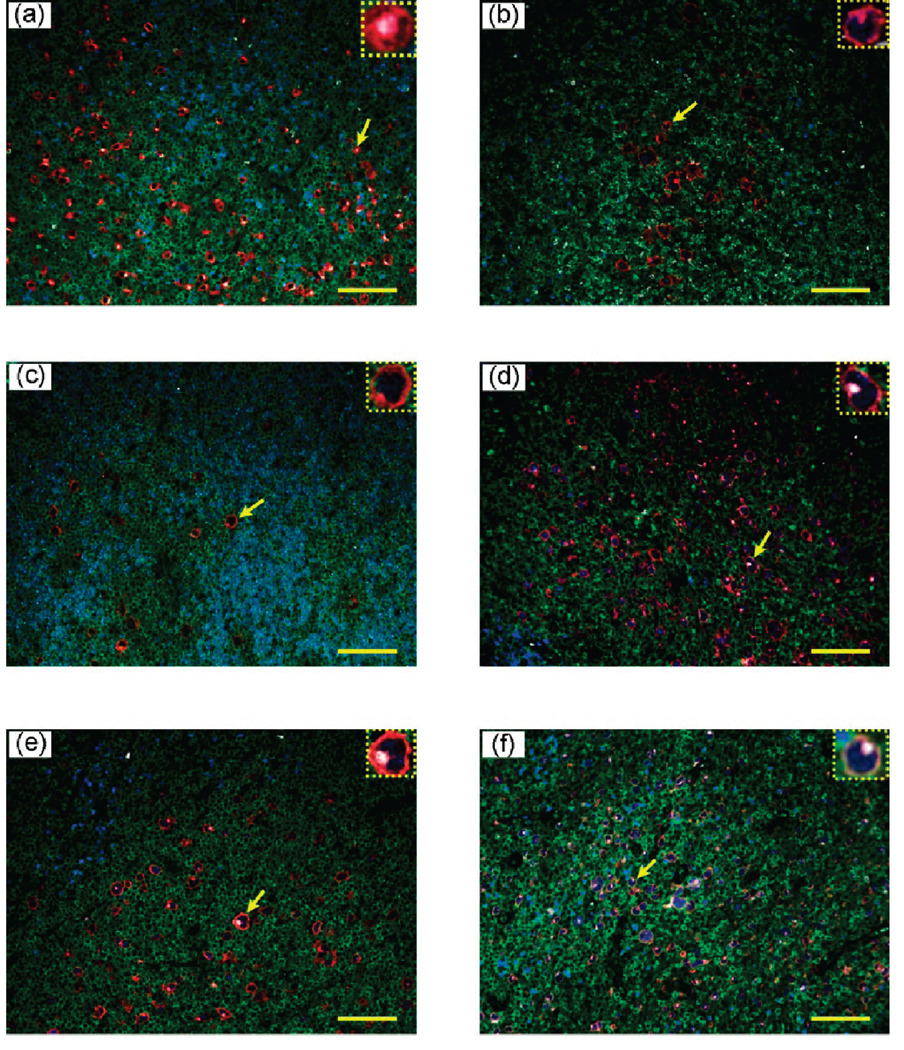
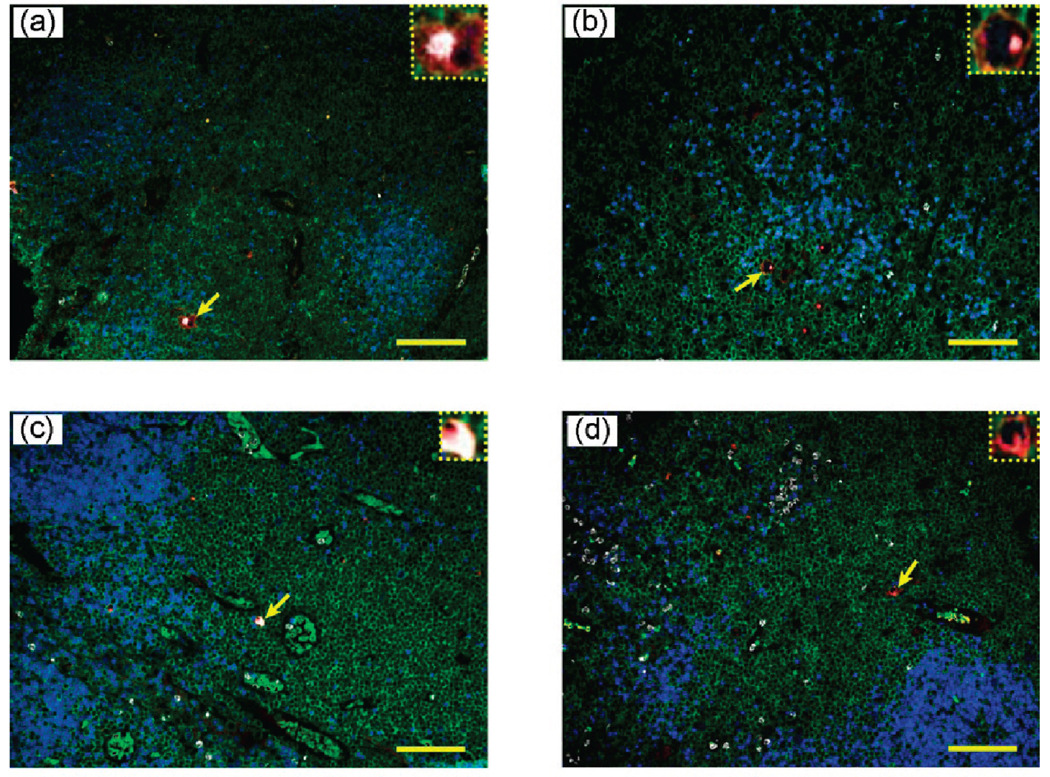
To evaluate the clinical utility of multiplexed QD staining, we have examined the lymph node biopsies of 10 human patients. In this small group, pathological examination indicates that six of them have definitive Hodgkin’s lymphoma, two have ambiguous (suspicious) lymphoma, and two have reactive lymph nodes (but not lymphoma). As shown in Figure 4, multiplexed QD studies rapidly identified all of the positive lymphoma patients, as judged by the observation of distinctively stained HRS cells. Significantly, this unique staining pattern is also observed in the two suspicious lymphoma patients, but the number of malignant HRS cells is extraordinarily small (Figure 5, top panels). This low number is likely responsible for diagnostic ambiguity with conventional methods. The ability to detect and identify such extremely rare cells on human clinical specimens could have important applications. In contrast, characteristic HRS cells are completely absent in patients with reactive lymph nodes (Figure 5, low panels). As shown in the insets, there is a small population of cells with CD15 (white) and CD30 (red) expressions; however, they do not simultaneously express the biomarker Pax5, so these cells are different from the malignant HRS cells identified in the lymphoma patients. The medical significance of these findings can only be established by blinded clinical trials, but such large-scale studies are beyond the scope of this technically oriented paper.
Figure 4.
Multiplexed QD staining images of lymph node biopsies from six patients of Hodgkin’s lymphoma. Malignant HRS cells were detected in all patients by the QD staining pattern of CD30 positive, CD15 positive, Pax5 positive, and CD45 negative (expanded insets). Confirming diagnosis was carried out by experienced pathologists at the Atlanta VA Medical Center. Scale bar: 100 µm.
Figure 5.
Multiplexed QD staining images of lymph node biopsies from two patients with “suspicious” lymphoma (a and b), and from two patients with reactive lymph nodes (c and d). The expanded insets reveal the presence of rare malignant HRS cells in (a) and (b) but the absence of such cells in the biopsies of reactive lymph node patients (c and d). Scale bar: 100 µm.
DISCUSSION
Diagnosis of classical Hodgkin’s disease is primarily determined by identification of Hodgkin (Reed-Sternberg) cells.25–28 However, these cells are in a very low percentage in many cases of actual specimens from the patients. Thus, it becomes a challenge to identify H/RS cells reliably from the noisy background of other cell populations. Conventional techniques such as H and E and IHC are limited by their capability of multiplexing; thus, they remain unable to solve this problem of “find[ing] a needle in a hay stack”.37 For example, negative CD45 expression is one of the major characteristics defining Hodgkin and Reed-Sternberg cells. One of the most frequent problems using conventional IHC is that the numerous adjacent CD45+ inflammatory cells can bring up interference on interpreting CD45 expression of the Hodgkin tumor cells. QD staining allows visualization of multiple biomarkers simultaneously. Some biomarkers such as CD15 or CD30 can be used to define the boundary of suspicious Hodgkin tumor cells. This advantage by QD staining can significantly increase pathologists’ confidence in determining whether CD45 staining is in the larger Hodgkin tumor cells or its inflammatory neighbors. In our experiments of QD multiplexing, we have clearly identified that the CD30+ CD15+ Pax5+ cells are also CD45− for the diagnosis of Hodgkin’s lymphoma.
The development of techniques for obtaining needle biopsy samples promises minimal invasiveness to the patients. On the other hand, the mass availability of biopsy samples limits the applications of conventional staining methods. Multiplexed QD staining can become a good answer, because it not only provides high sensitivity to detect rare cells of diagnostic value out of a large population of noisy cells but also reduces the requirement of previous sample materials. If this new technique of QD multiplexing can be put into use in clinical practice, then the patients of Hodgkin’s disease may be benefited by “on the spot” sampling and more reliable monitoring of disease status and therapeutic response. The treatment methods can be adjusted accordingly based on the information of monitoring by QD multiplexing. It will be interesting to define the sensitivity and specificity of this new technique with a larger set of samples of patient cases. A major step forward is the prediction of patient outcomes by means of molecular biomarkers expressed by the HRS cells or the tumor microenvironment. Recent work by Steidl et al.38 has discovered a gene signature of tumor-associated macrophages and monocytes that correlate with clinical outcome.
In conclusion, we have used multiplexed QD–antibody conjugates and wavelength-resolved imaging to study low-abundant HRS cells on lymph node biopsies of classical Hodgkin’s lymphoma patients. A major finding is that the use of four protein biomarkers (CD45, CD15, CD30, and PAX5) allows rapid detection and differentiation of rare RS cells from their complex microenvironments. The QD mapping results are consistent with standard immunohistochemistry and are validated by prior clinical diagnosis. The clinical utility of multiplexed QD cellular mapping is not limited to HRS cells in Hodgkin’s lymphoma but can be extended to detect cancer stem cells, tumor-associated macrophages (TAMs), and other rare cell populations, raising new opportunities in molecular cancer diagnosis and prognosis.
ACKNOWLEDGMENT
This work was supported by grants from the NCI Centers of Cancer Nanotechnology Excellence(CCNE)Program(U54CA119338) and the Bioengineering Research Partnerships Program (BRP) (R01CA108468). S.N. is a Distinguished Cancer Scholar of the Georgia Cancer Coalition (GCC).
References
- 1.Alivisatos AP. Nat. Biotechnol. 2004;22:47–52. doi: 10.1038/nbt927. [DOI] [PubMed] [Google Scholar]
- 2.Michalet X, Pinaud FF, Bentolila LA, Tsay JM, Doose S, Li JJ, et al. Science. 2005;307:538–544. doi: 10.1126/science.1104274. [DOI] [PMC free article] [PubMed] [Google Scholar]
- 3.Gao XH, Yang L, Petros JA, Marshall FF, Simons JW, Nie SM. Curr. Opin. Biotechnol. 2005;16:63–72. doi: 10.1016/j.copbio.2004.11.003. [DOI] [PubMed] [Google Scholar]
- 4.Smith AM, Duan H, Mohs AM, Nie SM. Adv. Drug Delivery Rev. 2008;60:1226–1240. doi: 10.1016/j.addr.2008.03.015. [DOI] [PMC free article] [PubMed] [Google Scholar]
- 5.Xing Y, Chaudry Q, Shen C, Kong KY, Zhau HE, Chung LWK, et al. Nat. Protoc. 2007;2:152–1165. doi: 10.1038/nprot.2007.107. [DOI] [PubMed] [Google Scholar]
- 6.Yezhelyev MV, Al-Hajj A, Morris C, Marcus AI, Liu T, Lewis M, Cohen C, Zrazhevskiy P, Simons JW, Rogatko A, Nie SM, Gao XH, O’Regan RM. Adv. Mater. 2007;19:3146–3151. [Google Scholar]
- 7.Smith AM, Dave S, Nie SM, True L, Gao XH. Expert Rev. Mol. Diagn. 2006;6:231–244. doi: 10.1586/14737159.6.2.231. [DOI] [PubMed] [Google Scholar]
- 8.Ghazani AA, Lee JA, Klostranec J, Xiang Q, Dacosta RS, Wilson BC, et al. Nano Lett. 2006;6:2881–1886. doi: 10.1021/nl062111n. [DOI] [PubMed] [Google Scholar]
- 9.Fountaine TJ, Wincovitch SM, Geho DH, Garfield SH, Pittaluga S. Modern Pathol. 2006;19:1181–1191. doi: 10.1038/modpathol.3800628. [DOI] [PubMed] [Google Scholar]
- 10.Sweeney E, Ward TH, Gray N, Womack C, Jayson G, Hughes A, et al. Res. Commun. 2008;374:81–186. doi: 10.1016/j.bbrc.2008.06.127. [DOI] [PubMed] [Google Scholar]
- 11.Tholouli E, Sweeney E, Barrow E, Clay V, Hoyland JA, Byers RJ. J. Pathol. 2008;216:275–285. doi: 10.1002/path.2421. [DOI] [PubMed] [Google Scholar]
- 12.Nie SM, Xing Y, Kim GJ, Simons JW. Annu. Rev. Biomed. Eng. 2007;9:257–288. doi: 10.1146/annurev.bioeng.9.060906.152025. [DOI] [PubMed] [Google Scholar]
- 13.Chen C, Peng J, Xia HS, Yang GF, Wu QS, Chen LD, Zeng LB, Zhang ZL, Pang DW, Li Y. Biomaterials. 2009;30:2912–2918. doi: 10.1016/j.biomaterials.2009.02.010. [DOI] [PubMed] [Google Scholar]
- 14.Chen H, Xue J, Zhang Y, Zhu X, Gao J, Yu B. J. Mol. Histol. 2009;40:261–282. doi: 10.1007/s10735-009-9237-y. [DOI] [PubMed] [Google Scholar]
- 15.Hu M, Yan J, He Y, Lu H, Weng L, Song S, Fan C, Wang L. ACS Nano. 2010;4:488–494. doi: 10.1021/nn901404h. [DOI] [PubMed] [Google Scholar]
- 16.Peng C, Li Z, Zhu Y, Chen W, Yuan Y, Liu L, Li Q, Xu D, Qiao R, Wang L, Zhu S, Jin Z, Xu C. Biosens. Bioelectron. 2009;15:3657–3662. doi: 10.1016/j.bios.2009.05.031. [DOI] [PubMed] [Google Scholar]
- 17.Huang DH, Peng XH, Su L, Wang DS, Khuri FR, Shin DM, Chen Z. Nano Res. 2010;3:61–68. [Google Scholar]
- 18.Phan JH, Moffitt RA, Stokes TH, Liu J, Young AN, Nie SM, Wang MD. Trends Biotechnol. 2009;27:350–358. doi: 10.1016/j.tibtech.2009.02.010. [DOI] [PMC free article] [PubMed] [Google Scholar]
- 19.Liotta L, Petricoin E. Nat. Rev. Genet. 2000;1:48–56. doi: 10.1038/35049567. [DOI] [PubMed] [Google Scholar]
- 20.Petricoin EF, Ardekani AM, Hitt BA, Levine PJ, Fusaro VA, Steinberg SM, Mills GB, Simone C, Fishman DA, Kohn EC, Liotta LA. Lancet. 2002;359:572–577. doi: 10.1016/S0140-6736(02)07746-2. [DOI] [PubMed] [Google Scholar]
- 21.Michener CM, Ardekani AM, Petricoin EF, Liotta LA, Kohn EC. Cancer Detect. Prev. 2002;26:249–255. doi: 10.1016/s0361-090x(02)00092-2. [DOI] [PubMed] [Google Scholar]
- 22.Srinivas PR, Verma M, Zhao YM, Srivastava S. Clin. Chem. 2002;48:1160–1169. [PubMed] [Google Scholar]
- 23.Mansfield JR, Gossage KW, Hoyt CC, Levenson RM. J. Biomed. Opt. 2005;10:41207. doi: 10.1117/1.2032458. [DOI] [PubMed] [Google Scholar]
- 24.Levenson RM. Lab Med. 2004;35:244–252. [Google Scholar]
- 25.Kuppers R. Nat. Rev. Cancer. 2009;9:15–27. doi: 10.1038/nrc2542. [DOI] [PubMed] [Google Scholar]
- 26.Schmitz R, Stanelle J, Hansmann ML, Kuppers R. Annu. Rev. Pathol. 2009;4:151–174. doi: 10.1146/annurev.pathol.4.110807.092209. [DOI] [PubMed] [Google Scholar]
- 27.Pileri AS, Ascani S, Leoncini L, Sabattini E, Zinzani PL, Piccaluga PP, Pileri A, Dr, Giunti M, Falini B, Bolis GB, Stein HJ. Clin. Pathol. 2002;55:162–176. doi: 10.1136/jcp.55.3.162. [DOI] [PMC free article] [PubMed] [Google Scholar]
- 28.Brauninger A, Schmitz R, Bechtel D, Renne C, Hansmann ML, Kuppers R. Int. J. Cancer. 2006;118:1853–1861. doi: 10.1002/ijc.21716. [DOI] [PubMed] [Google Scholar]
- 29.Listinsky CM. Am. J. Clin. Pathol. 2002;117 Suppl:S76–S94. doi: 10.1309/A9FA-RVFF-5RF7-DA0D. [DOI] [PubMed] [Google Scholar]
- 30.Nam-Cha SH, Montes-Moreno S, Salcedo MT, Sanjuan J, Garcia JF, Piris M. A. Mod. Pathol. 2009:1–10. doi: 10.1038/modpathol.2009.54. [DOI] [PubMed] [Google Scholar]
- 31.Pena JTG, Sohn-Lee C, Rouhanifard SH, Ludwig J, Hafner M, Mihailovic A, et al. Nat. Methods. 2009;6:139–141. doi: 10.1038/nmeth.1294. [DOI] [PMC free article] [PubMed] [Google Scholar]
- 32.Liu J, Lau SK, Varma VA, Moffitt RA, Caldwell M, Liu T, Young AN, Petros JA, Osunkoya AO, Krogstad T, Leyland-Jones B, Wang MD, Nie SM. ACS Nano. 2010;4:2755–2765. doi: 10.1021/nn100213v. [DOI] [PMC free article] [PubMed] [Google Scholar]
- 33.Hall PA, D’Ardenne AJ. J. Clin. Pathol. 1987;40:1298–1304. doi: 10.1136/jcp.40.11.1298. [DOI] [PMC free article] [PubMed] [Google Scholar]
- 34.Filippa DA, Ladanyi M, Wollner N, Straus DJ, O’Brien JP, Portlock C, Gangi M, Sun M. Blood. 1996;87:2905–2917. [PubMed] [Google Scholar]
- 35.Ashton-Key M, Isaacson PG. J. Pathol. 1997;181:462–463. doi: 10.1002/(SICI)1096-9896(199704)181:4<462::AID-PATH791>3.0.CO;2-2. [DOI] [PubMed] [Google Scholar]
- 36.Jensen KC, Higgins JPT, Montgomery K, Kaygusuz G, van de Rijn M, Natkunam Y. Mod. Pathol. 2007;20:871–877. doi: 10.1038/modpathol.3800831. [DOI] [PubMed] [Google Scholar]
- 37.Kuppers R, Hansmann ML, Diehl V, Rajewsky K. Mol. Med. Today. 1995;1:26–30. doi: 10.1016/1357-4310(95)80016-6. [DOI] [PubMed] [Google Scholar]
- 38.Steidl C, Lee T, Sah SP, Farinha P, Han G, Nayar T, Delaney A, Jones SJ, Iqbal J, Weisenbruger DD, Bast MA, Rosenwald A, Muller-Hermelink H-K, Rimsza LM, Campo E, Delabie J, Braziel R, Cook JR, Tubbs RR, Jaffe ES, Lenz G, Connors JM, Staudit LM, Chan WC, Gascoyne RD. New Eng. J. Med. 2010;362:875–885. doi: 10.1056/NEJMoa0905680. [DOI] [PMC free article] [PubMed] [Google Scholar]


