

Abstract
Purpose
To examine the benefit of using higher field strengths for BOLD MRI to detect changes in renal medullary oxygenation following pharmacological maneuvers.
Materials and Methods
Renal BOLD MRI, primarily at 1.5T, has been shown to be useful for monitoring changes in medullary oxygenation status. We performed the present studies on a 3.0T scanner using a multiple gradient-echo (mGRE) sequence with a multicoil array to acquire 16 T2*-weighted images within a single breath-hold. Data were obtained before and after administration of furosemide (20 mg iv).
Results
The baseline renal R2* (mean ± SE) at 3.0T was 37.4±1.2 Hz in the medulla, and 21.8 ± 1.2 Hz in the cortex. The BOLD response to furosemide (ΔR2*) at 3.0T was 11.8 ± 1.1 Hz in the medulla, and 3.0 ± 0.5 Hz in the cortex.
Conclusion
Higher magnetic field strength is beneficial for renal BOLD MRI studies. The cortico-medullary contrast on the R2* map was significantly improved at 3.0T, with no evidence of increased bulk susceptibility artifacts. Baseline R2* and ΔR2* in the renal medulla at 3.0T were both significantly higher compared to our previously reported data obtained at 1.5T.
Keywords: kidney, BOLD MRI, 3.0T, medulla, oxygenation
A low renal medullary oxygenation level is thought to be a predisposing factor in the development of ischemic diseases, such as acute renal failure (1). It is also believed that renal medullary hypoxia may play a role in the pathophysiology of hypertension (2,3) and diabetic nephropathy (4,5). We have shown that blood oxygenation level-dependent (BOLD) MRI can noninvasively evaluate intrarenal oxygenation levels in humans under normal conditions, and during physiological and pharmacological maneuvers at 1.5T field strength (5–9). Since 3.0T scanners capable of body imaging are becoming commercially available, we sought to evaluate whether the higher field strength would benefit renal BOLD studies.
The potential advantage of high field strength is that it increases the signal-to-noise ratio (SNR) and/or spatial resolution (10,11). However, such potential may not be realized when T1 lengthening, increased susceptibility-based line-broadening, and the relative performance of radiofrequency coils at higher field strengths are taken into account. In addition, acquisition parameter choices (e.g., TR and FA) for body applications are limited by the increased specific absorption rate at higher fields. The BOLD effect is known to be proportional to B0 for large vessels, and to B02 for small vessels and capillaries (12,13). The advantages of higher field strength for functional MRI (fMRI) of the brain based on BOLD MRI are already well established (14,15). On the other hand, susceptibility artifacts (such as those due to the presence of bowel gas) may be more severe at higher field strengths.
In this study we performed investigations at 3.0T similar to those we previously performed at 1.5T (8,9,16), by observing the effects of furosemide administration on renal medullary oxygenation levels. Furosemide is a loop diuretic that has been shown to improve medullary oxygenation, presumably because it selectively decreases oxygen consumption by blocking active transport in the thick ascending limbs (17). Because susceptibility effects scale with field strength, we hypothesized that the renal medullary R2* before furosemide administration would be significantly higher than that previously observed at 1.5T. Since our previous results suggest that medullary R2* values approach those in the cortex post-furosemide, we also hypothesized that the change in R2* post-furosemide (ΔR2*) would be significantly higher at 3.0T compared to 1.5T.
MATERIALS AND METHODS
Six male and two female healthy young volunteers (mean age = 25.1 ± 3.7 years old) with no known history of renal disease participated in this study. After the study was explained to the volunteers, they gave informed consent according to a protocol approved by our institutional review board. The subjects came to the study after abstaining from food and water for about 12 hours overnight. A coronal plane passing through the center of both kidneys was prescribed for scout images, and baseline BOLD MRI images were acquired along several axial planes. Twenty milligrams of furosemide were then injected intravenously. Post-furosemide images were acquired starting about five minutes following administration to measure the BOLD response.
We conducted the experiments on a GE Signa Vhi 3.0T whole-body scanner (Milwaukee, WI) using a multiple gradient-echo (mGRE) sequence with selective water excitation pulse (TR/TE/flip angle/BW = 65/7–40.1 msec/30/62.5 kHz at 3.0T) to acquire 16 T2*-weighted images within a single breath-hold of about 12 seconds. The matrix size was 256 × 256 with a field of view (FOV) of 36 cm and 0.75 phase FOV. A standard four-coil torso array was used for signal reception. The rate of spin dephasing R2* (= 1/T2*), which is closely related to the content of deoxyhemoglobin in blood, was used as a BOLD parameter. A decrease in R2* implies an increase in tissue pO2. We constructed R2* maps on the scanner platform, using FUNCTOOL, by fitting a single exponential function to the signal intensity vs. echo time (TE) data. Regions of interest (ROIs) covering at least 20 pixels were drawn on the anatomic template. Typically, 10–20 ROIs each in the cortex and medulla were obtained from several slices and both kidneys. The data were combined to obtain a single representative mean value of R2* per subject per time point. The statistical significance of the differences between pre- and post-furosemide R2* values was assessed by means of a two-tailed paired Student’s t-test.
RESULTS
Figure 1 shows a representative baseline BOLD MRI data set obtained in a single subject at 3.0T. Shown are 10 pairs of anatomic images (usually image #1 of the 16 T2*-weighted image series) and corresponding R2* maps from different slices covering the entire length of the kidney. Note the exquisite cortical-medullary contrast in the R2* map. There is evidence of susceptibility artifacts (shown by arrows), but they are limited to only a few cortical regions.
Figure 1.
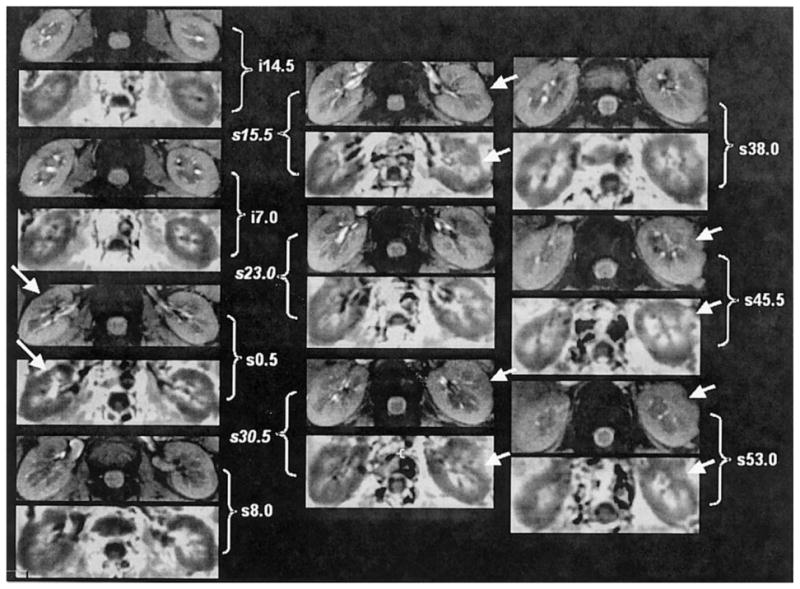
Images obtained with the mGRE sequence in one representative healthy subject. Ten pairs of baseline anatomic (top) and R2* (bottom) images from different slices covering the entire kidney. The anatomic image is usually the first image of the series of 16 GRE images. The R2* map was obtained by fitting the signal intensity vs. TE data to a single decaying exponential function. Note that in the R2* map, the medulla appears brighter than the cortex, implying a higher R2* value in the medulla, which in turn implies higher deoxyhemoglobin content or less tissue oxygenation. The arrows point to obvious bulk susceptibility-induced artifacts, probably due to the presence of bowel gas in close proximity.
Figure 2 shows a representative pre- and post-furosemide BOLD MRI data set at 3.0T. Anatomical images as well as corresponding R2* maps obtained pre- and post-furosemide are shown. The windowing was adjusted to be identical on both pre- and post-R2* maps. On the pre-furosemide R2* map, the medulla is relatively bright compared to the cortex, implying lower tissue oxygenation. On the post-furosemide R2* map of the same slice, the medulla appears close to being isointense with the cortex, indicating increased tissue oxygenation.
Figure 2.
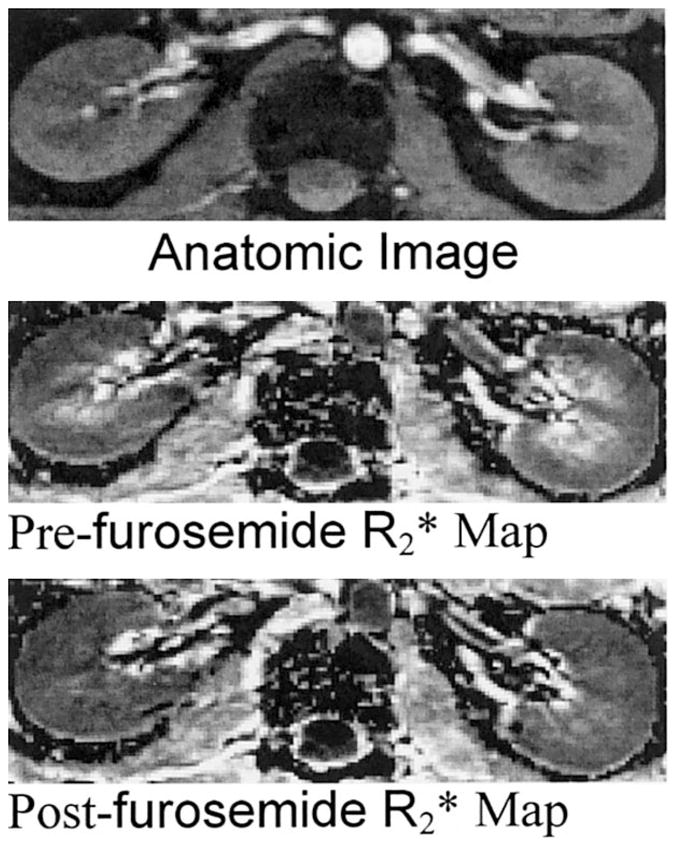
Representative images obtained with the mGRE sequence in a healthy subject pre- and post-furosemide administration: (top) anatomic image of the kidney (first image of the series of 16 GRE images), (middle) pre-furosemide R2* map, and (bottom) post-furosemide R2* map obtained at the same slice location. The windowing was held constant for both the maps. Note that the medulla appears much brighter than the cortex on the pre-furosemide R2* map, but looks close to isointense compared to the cortex on the post-furosemide R2* map, implying improved oxygenation in the latter.
The individual (average of all ROIs in each subject) and mean (averaged over all subjects) R2* values pre- and post-furosemide are shown in Fig. 3a. A statistically significant decrease in medullary R2* post-furosemide was observed at 3.0T. The magnitude of the R2* baseline is 37.4 ± 1.2 Hz in the medulla, and 21.8 ± 1.2 Hz in the cortex. The post-furosemide R2* is 25.6 ± 1.1 Hz in the medulla, and 18.7 ± 0.8 Hz in the cortex.
Figure 3.

a: Summary of individual changes in medullary and cortical R2* post-furosemide in healthy young volunteers at 3.0T. b: Summary of individual changes in medullary and cortical R2* post-furosemide in healthy young volunteers at 1.5T from a previously reported study (16).
DISCUSSION
Signal changes due to BOLD effects are directly proportional to the magnetic field strength, at least for large vessels. However, chemical shift, susceptibility, flow, and patient motion artifacts are more obvious at high field strengths (18,19).
This study demonstrates that higher magnetic field strength is beneficial for renal BOLD MRI studies. The BOLD effect was detected consistently in all subjects, and had a higher sensitivity at 3.0T (Fig. 3a). The cortico-medullary baseline contrast on the R2* map is significantly improved at 3.0T, with no evidence of increased level of bulk susceptibility artifacts (Fig. 1). The relative brightness in the medulla in the baseline R2* map is consistent with an enhanced BOLD effect in the medulla due to its relatively poor oxygenation status.
For comparison purposes, data from a previous study (16) performed at 1.5T (in a different group of volunteers) are shown in Fig. 3b. A statistically significant decrease in medullary R2* post-furosemide was observed at 1.5T. However, the magnitude of the baseline renal medullary R2* at 1.5T (21.8 ± 1.2 Hz) is only about half as large as that at 3.0T (Fig. 3a). The ΔR2* (pre- minus post-R2*) at 3.0T (11.8 ± 1.2 Hz) is also roughly twice as large as that at 1.5T (5.4 ± 0.9 Hz) (16).
For BOLD measurements, the choice of TE is important. For optimal SNR characteristics, it is usually desirable to limit the maximum TE to be approximately equal to T2* value. At 1.5T, the T2* of medulla is ~50 msec (1/20 s−1). For the present study, we used exactly the same pulse sequence and matched all of the acquisition parameters to be close to those previously used at 1.5T. The default values for interecho spacing for the bandwidth of ±62.5 kHz was ~2.2 msec. The starting TE value was 7 msec, and hence the default maximum TE was ~40 msec. At 1.5T we deliberately introduced a time between the adjacent echoes (~0.5 msec) to make the largest TE close to 50 msec. While the TE used at 3.0T was shorter than at 1.5T, it was not half the value (as suggested by doubling of R2* at 3.0T). Based on our current data, it may be possible to decrease the maximum TE to ~25 msec by doubling the acquisition bandwidth. However, this might compromise the SNR. An alternate approach may be to reduce the number of echoes acquired to eight, since we only need to fit the data to a simple exponential function.
The choice of TE may also influence the severity of susceptibility artifacts. Lower TEs should reduce the severity. However, as pointed out in this study, the severity of the bulk susceptibility at 3.0T was no worse than that observed at 1.5T, even with a maximum TE of 40 msec.
The use of a high field strength also offers a unique opportunity to increase spatial resolution, and thus minimize partial volume effects and improve the accuracy of quantitative intrarenal R2* measurements. However, further studies are warranted to evaluate the effects of increased spatial resolution. It is possible that both the SNR and the inherent BOLD sensitivity (20) would be compromised if the voxel size is reduced.
It is worthwhile to mention other factors that may influence BOLD MRI measurements at higher field strengths. For neuro fMRI, high-field applications are influenced by the high BOLD sensitivity, higher SNR, longer T1, and enhanced sensitivity to physiological noise. Since these measurements are based on signal-intensity variations, all of these factors are equally important. For renal applications in which R2* is used as the BOLD parameter, we believe the first factor is the most important. In a previous study (unpublished) we measured the SNR in the cortex and medulla using parameter-matched acquisitions at both field strengths. The SNR gain at 3.0T was only on the order of 30% compared to the theoretical value of 100%. This is probably due to the relative efficiency of the RF coil and detection systems. Differences in T1 should have no influence, because we measure R2* using multiple echoes, and each echo is weighted equally by T1. In terms of physiological noise, R2* measurements may be affected by the pulsatile flow and any patient motion. However, for our study, the data were acquired during a single suspended breath-hold, and the subject’s compliance in following breathing instructions was monitored with a respiratory monitor. Data were not included for analysis if the breath-hold was deemed inadequate, which therefore reduced the effect of patient motion. To minimize pulsatile flow effects, we could consider acquiring data with cardiac gating. However, that would increase the acquisition time and make breath-holding difficult.
In conclusion, the preliminary results presented here favor the use of 3.0T for renal BOLD MRI studies. The magnitude of the BOLD effect at 3.0T is approximately two times greater than the previously reported value at 1.5T. Furthermore, increased SNRs at higher field strengths may permit the use of partially parallel imaging strategies for faster acquisitions and/or higher spatial resolution. Decreased TEs will allow for shorter TRs, which could be further exploited to increase organ coverage per breath-hold.
Acknowledgments
This work was supported in part by a grant from the National Institutes of Health (NIDDK53221 to P.V.P.).
Footnotes
Presented at the 10th Annual Meeting of ISMRM, Honolulu, 2003.
References
- 1.Heyman SN, Brezis M, Reubinoff CA, et al. Acute renal failure with selective medullary injury in the rat. J Clin Invest. 1988;82:401–412. doi: 10.1172/JCI113612. [DOI] [PMC free article] [PubMed] [Google Scholar]
- 2.Cowley AW, Roman RJ, Fenoy FJ, Mattson DL. Effect of renal medullary circulation on arterial pressure. J Hypertens Suppl. 1992;10:S187–193. [PubMed] [Google Scholar]
- 3.Cowley AW, Jr, Mattson DL, Lu S, Roman RJ. The renal medulla and hypertension. Hypertension. 1995;25:663–673. doi: 10.1161/01.hyp.25.4.663. [DOI] [PubMed] [Google Scholar]
- 4.Heyman SN, Fuchs S, Brezis M. The role of medullary ischemia in acute renal failure. New Horiz. 1995;3:597–607. [PubMed] [Google Scholar]
- 5.Epstein FH, Veves A, Prasad PV. Effect of diabetes on renal medullary oxygenation during water diuresis. Diabetes Care. 2002;25:575–578. doi: 10.2337/diacare.25.3.575. [DOI] [PubMed] [Google Scholar]
- 6.Prasad PV, Chen Q, Goldfarb JW, Epstein FH, Edelman RR. Breath-hold R2* mapping with a multiple gradient-recalled echo sequence: application to the evaluation of intrarenal oxygenation. J Magn Reson Imaging. 1997;7:1163–1165. doi: 10.1002/jmri.1880070633. [DOI] [PubMed] [Google Scholar]
- 7.Prasad PV, Epstein FH. Changes in renal medullary pO2 during water diuresis as evaluated by blood oxygenation level-dependent magnetic resonance imaging: effects of aging and cyclooxygenase inhibition. Kidney Int. 1999;55:294–298. doi: 10.1046/j.1523-1755.1999.00237.x. [DOI] [PMC free article] [PubMed] [Google Scholar]
- 8.Prasad PV, Edelman RR, Epstein FH. Noninvasive evaluation of intrarenal oxygenation with BOLD MRI. Circulation. 1996;94:3271–3275. doi: 10.1161/01.cir.94.12.3271. [DOI] [PubMed] [Google Scholar]
- 9.Epstein FH, Prasad P. Effects of furosemide on medullary oxygenation in younger and older subjects. Kidney Int. 2000;57:2080–2083. doi: 10.1046/j.1523-1755.2000.00057.x. [DOI] [PubMed] [Google Scholar]
- 10.Haacke E, Brown RW, Thompson MR, Venkatesan R. Magnetic resonance imaging physical principles and sequence design. Vol. 343. New York: John Wiley & Sons, Inc; 1999. Signal, Contrast and Noise; p. 387. [Google Scholar]
- 11.Edelstein WA, Glover GH, Hardy CJ, Redington RW. The intrinsic signal-to-noise ratio in NMR imaging. Magn Reson Med. 1986;3:604–618. doi: 10.1002/mrm.1910030413. [DOI] [PubMed] [Google Scholar]
- 12.Ogawa S, Menon RS, Tank DW, et al. Functional brain mapping by blood oxygenation level-dependent contrast magnetic resonance imaging. A comparison of signal characteristics with a biophysical model. Biophys J. 1993;64:803–812. doi: 10.1016/S0006-3495(93)81441-3. [DOI] [PMC free article] [PubMed] [Google Scholar]
- 13.Fisel CR, Ackerman JL, Buxton RB, et al. MR contrast due to microscopically heterogeneous magnetic susceptibility: numerical simulations and applications to cerebral physiology. Magn Reson Med. 1991;17:336–347. doi: 10.1002/mrm.1910170206. [DOI] [PubMed] [Google Scholar]
- 14.Kruger G, Kastrup A, Glover GH. Neuroimaging at 1.5 T and 3.0 T: comparison of oxygenation-sensitive magnetic resonance imaging. Magn Reson Med. 2001;45:595–604. doi: 10.1002/mrm.1081. [DOI] [PubMed] [Google Scholar]
- 15.Gati JS, Menon RS, Ugurbil K, Rutt BK. Experimental determination of the BOLD field strength dependence in vessels and tissue. Magn Reson Med. 1997;38:296–302. doi: 10.1002/mrm.1910380220. [DOI] [PubMed] [Google Scholar]
- 16.Li LP, Storey P, Pierchala L, Li W, Polzin J, Prasad PV. Evaluation of reproducibility of intra-renal R2* measurements, and delta R2* measurements following administration of furosemide and during waterload. J Magn Reson Imaging. 2004;19:610–616. doi: 10.1002/jmri.20043. [DOI] [PMC free article] [PubMed] [Google Scholar]
- 17.Brezis M, Rosen S. Hypoxia of the renal medulla—its implications for disease. N Engl J Med. 1995;332:647–655. doi: 10.1056/NEJM199503093321006. [DOI] [PubMed] [Google Scholar]
- 18.Yang Y, Gu H, Zhan W, Xu S, Silbersweig DA, Stern E. Simultaneous perfusion and BOLD imaging using reverse spiral scanning at 3.0T: characterization of functional contrast and susceptibility artifacts. Magn Reson Med. 2002;48:278–289. doi: 10.1002/mrm.10196. [DOI] [PubMed] [Google Scholar]
- 19.Gonen O, Gruber S, Li BS, Mlynarik V, Moser E. Multivoxel 3D proton spectroscopy in the brain at 1.5 versus 3.0 T: signal-to-noise ratio and resolution comparison. AJNR Am J Neuroradiol. 2001;22:1727–1731. [PMC free article] [PubMed] [Google Scholar]
- 20.Frahm J, Merboldt KD, Hanicke W. Functional MRI of human brain activation at high spatial resolution. Magn Reson Med. 1993;29:139–144. doi: 10.1002/mrm.1910290126. [DOI] [PubMed] [Google Scholar]