Abstract
Objective
To validate the use of quantitative magnetic resonance (QMR) to measure fat and lean mass in conscious rats.
Methods
Fifty Osborne-Mendel rats (249-770 g) were scanned using the Echo Medical 2 MHz body composition analyzer. Each rat was scanned under six settings (three acquisition times, with and without determination of total water). Precision was determined by the calculated coefficient of variation (CV) of three consecutive scans. Accuracy was determined by comparing the first scan to chemical carcass analysis and analyzed by paired t-tests and least-squares regression analyses. Twenty-five rats were used in the validation study, and 25 in the cross-validation study.
Results
The precision for fat, lean and water at all settings was <1%. QMR significantly overestimated fat (~5%; P<0.0001), and underestimated both lean (~12.5%; P<0.0001) and total water (~5.5%; P<0.0001). All QMR measures were significantly correlated with carcass measures (r2>0.99; P<0.0001). Using prediction equations from the validation study with the cross-validation rats, there were no significant differences between QMR fat and carcass fat at any setting (P>0.400). For four of the six QMR settings, there were no significant differences between QMR and carcass lean (P>0.05). For total water, all QMR settings were significantly different than carcass (P<0.05), but only by ~1%.
Conclusions
QMR showed excellent precision for the determination of fat, lean and water. Despite overestimating fat and underestimating lean and water, all were highly related to carcass values. When tested in the cross-validation group, QMR fat could be accurately predicted at all settings; however, lean mass (two settings) and water were still slightly different (less than 1%).
Keywords: body composition, rats, QMR, magnetic resonance, fat, lean
Introduction
With the current epidemic of obesity and type II diabetes, much emphasis has been placed on developing animal models to determine the mechanisms of weight gain and loss, and to test potential treatments [1,2]. Just as in humans, the measurement of body weight alone is not adequate to study obesity in animal models. Changes in body weight can be achieved by alterations in any or all of the body compartments of fat and lean mass, and also in some cases, bone. In the study of obesity it is essential that changes in fat and lean mass are able to be measured, both in human and animal studies.
Rodents are the main vertebrate animal models for obesity and diabetes and the gold standard method for analyzing rodent body composition is chemical carcass analysis. In this method, body water is measured via desiccation (normally by oven or freeze drying); fat mass is determined by solvent extraction in a Soxhlet apparatus, with petroleum ether (or similar solvent), or by chloroform/methanol extraction; bone can be estimated from the ash remaining after burning the dry, fat-free sample at 600 °C. Lean mass is generally calculated as the fat-free dry mass obtained after fat extraction (minus the ash) plus the water content, or the nitrogen content measured by Kjeldahl analysis.
The obvious drawback to this method is that it is terminal and therefore only one measurement can be made per animal. Ideally, for obesity studies, longitudinal, intra-individual measures of body composition are needed to examine changes in fat and lean mass over time in response to different treatments. There are now several options for determining invivo measures of body composition, including dual-energy X-ray absorptiometry (DXA), isotope dilution, total body electrical conductivity (TOBEC), bio-electrical impedance spectroscopy (BIS), computed tomography (CT) and magnetic resonance imaging (MRI) [3].
Many of these techniques involve the use of anesthesia (DXA, BIS, CT, MRI, and sometimes TOBEC) which can affect the animal's behavior and food intake on subsequent days. Others, namely isotope dilution, TOBEC and BIS measure total body water (directly or indirectly) and then assume a constant hydration of lean mass to convert water to lean. Fat mass is not measured, but calculated as the difference between body weight and lean mass. Thus any errors in the estimation of lean mass will be magnified in the calculation of fat [4].
There has recently been a new development in body composition analysis in small animals using quantitative magnetic resonance (QMR). QMR is based on the principles of nuclear magnetic resonance (NMR) which was first introduced in 1946 by Felix Bloch and Edward Purcell. NMR uses radio waves to manipulate the spins of the nuclei of atoms to determine information about the molecules being tested. Any atom with an odd mass can be used, eg hydrogen-1, carbon-13, oxygen-17, which produce a magnetic moment when their atoms spin [5].
The QMR instrument in this study uses hydrogen (proton)-NMR principles. Basically, the protons in the animal are aligned by the magnetic field and then excited by radio waves. The time it takes for the protons to relax and how much energy is released are measured. These two properties of the protons are different depending on whether the protons are associated with fat or lean molecules. QMR then quantifies these protons into masses of fat and lean tissue.
Advantages of the QMR technique include fast scans and the fact that they are taken when the animals are conscious, which prevents the negative effects of anesthesia. Validations have already been performed for mouse QMR machines [6,7]; however, the accuracy and precision of QMR for the measurement of body composition in larger rodents, like rats, has not been reported.
The aim of this study was to assess the precision and accuracy of the EchoMedical™ rat QMR for the measurement of fat and lean mass in rats, and to cross-validate it with respect to a second, independent sample of rats.
Methods
Animals
Fifty Osborne Mendel rats (29 males and 21 females) were used for this study. The rats were between 2 and 15 months old and ranged in weight from 249 g to 770 g. Rats were housed in standard rat cages at 22±1 °C on a 12:12 light: dark cycle (lights on 0600 h). Animals had ad-libitum access to standard chow (Harlan Teklad Rodent Diet #2016; Madison, WI) and water. All procedures were approved by the University of Alabama at Birmingham Institutional Animal Care and Use Committee.
Quantitative magnetic resonance (QMR)
Rats were scanned using a 2MHz Whole Body Composition Analyzer (Echo Medical Systems, Houston, TX). Rats were placed into one of three Perspex tubes depending on their body weight (<500 g, <700 g and <900 g). A slightly smaller diameter tube, held in place by a Velcro strap, was inserted to confine the animal at the end of the tube, leaving enough room for the rat to turn around. The tubes were placed horizontally inside the QMR machine. A known sample of canola oil was scanned as the quality control on each day the machine was used, before any animals were scanned. There were a total of six possible settings under which to scan the rats. The machine could be set to measure total body water, or no water; and under each of the water settings, the acquisition could be set to 1T3, 3T9 or 9T18. As the acquisition numbers increased, the time of the scan was increased, resulting in a longer acquisition time. The scan times were as follows: 1T3 no water – 54 s; 1T3 plus water – 1 min 43 s; 3T9 no water – 2 min 19 s; 3T9 plus water – 3 min 4 s; 9T18 no water – 6 min 28 s; 9T18 plus water – 7 min 15 s. Rats were scanned under all of the six settings, although precision was not determined for the 9T18 scans due to the length of time required.
Chemical carcass analysis
Following the QMR scans, the rats were euthanized via CO2 inhalation. Carcass composition was determined using the modified method of Harris and Martin 1984 [8,9]. Briefly, euthanized animals were autoclaved and an equal amount of water added before homogenization. Fat content was determined using KCl-chloroform-methanol extraction on samples of the homogenate. Water content was measured by drying the homogenate for 7 days at 70 °C in porcelain crucibles, before being ashed overnight in a muffle furnace at 600 °C. All these tests were run in triplicate and averaged for each rat. Data were corrected for the equal weight of water added during the homogenization.
Validation study
Twenty-five rats (249-770 g) were used for the validation study. For the QMR scans there were a total of six possible settings (three acquisition settings, 1, 3, and 9) and two water settings (measure total water or not). For precision, the rats were scanned three times each at the 1 and 3 acquisition settings, both with and without water. For the longest acquisition setting (9T18) the rats were just scanned once with, and once without the water measurement, due to the increased scan time required. To determine accuracy, the first of the three repeated readings was used to compare against the chemical carcass analysis.
Cross-validation study
To determine whether the prediction equations produced from the validation study accurately predicted the chemical composition, a second set of 25 rats (254-677 g) were scanned once at each of the six settings described above. They were then euthanized and chemical carcass analysis performed in the same way as in the validation study.
Statistics
Precision was determined using the coefficient of variation (CV = (sd/mean)*100) for every rat at each setting. To determine accuracy, the QMR and chemical data were compared using paired t-tests, and regression analyses. To determine whether there was any bias, difference plots were used together with regression analysis. Data were analyzed using SAS statistical software (v. 9.1, Cary, NC), and comparisons were considered significant when P≤0.05.
Results
Validation precision
The precision (CV) of fat, lean and total water were all less than 1% (Table 1). There were no significant differences in the precision of the QMR to measure fat and lean mass between the water and no water settings at the 1T3 acquisition (P=0.29 and P=0.38 respectively) or at the 3T9 acquisition (P=0.36 and P=0.33 respectively). However the precision of the total water measurement was significantly better at the 3T9 acquisition (P=0.03). There were trends for the 3T9 acquisition setting to give better precision than 1T3 for both fat (P=0.08) and lean mass (P=0.10), however these were not significant.
Table 1.
Coefficients of variation (%) for all four settings on the QMR (no precision was performed at the highest resolution due to the excessive scan time involved). Data presented as mean ± standard error.
| Mass | 1T3 water | 1T3 no water | 3T9 water | 3T9 no water |
|---|---|---|---|---|
| Fat mass | 0.92 ± 0.26 | 0.68 ± 0.19 | 0.50 ± 0.10 | 0.66 ± 0.17 |
| Lean mass | 0.34 ± 0.09 | 0.25 ± 0.06 | 0.19 ± 0.03 | 0.25 ± 0.05 |
| Water mass | 0.74 ± 0.13* | 0.48 ± 0.06* |
significantly different at P<0.05
Validation accuracy
QMR significantly overestimated fat mass at all settings (P<0.0001) compared to chemical carcass fat by 5.23 to 5.75 g (~5%) (Table 2). None of the QMR fat measures from the different settings were significantly different from each other (P>0.05 after the Bonferroni correction). The average fat masses from all QMR settings were within 0.52 g (<0.5%) of each other.
Table 2.
Body composition data from chemical carcass analysis and QMR (all settings). Data presented as mean ± standard error.
| Body comp | 1T3 | 3T9 | 9T18 | ||||
|---|---|---|---|---|---|---|---|
| Carcass | water | no water | water | no water | water | no water | |
| Fat (g) | 103.57 ± 10.78 | 109.31 ± 11.18 | 109.09 ± 11.15 | 108.93 ± 11.07 | 109.31 ± 11.07 | 108.79 ± 11.11 | 109.02 ± 11.17 |
| Lean (g) | 326.74 ± 19.73 | 286.02 ± 16.97 | 286.11 ± 16.96 | 286.13 ± 17.07 | 286.07 ± 17.08 | 285.75 ± 17.03 | 285.92 ± 17.02 |
| Water (g) | 233.61 ± 13.56 | 220.44 ± 13.14 | 220.53 ± 13.28 | 220.65 ± 13.12 | |||
None of the QMR measures of lean mass were significantly different from each other (P>0.05) (Table 2); however, all were significantly lower than chemical lean mass (P<0.0001) by between 40.61 and 40.99g (~12.5%). The average lean masses from the different QMR settings were within 0.38 g (<0.2%) of each other.
None of the QMR measures of total water were significantly different from each other (P>0.05) and only varied by 0.21 g (<0.1%). All QMR measures were significantly lower than chemical total water (P<0.0001) by between 12.96 and 13.17 g (~5.5%).
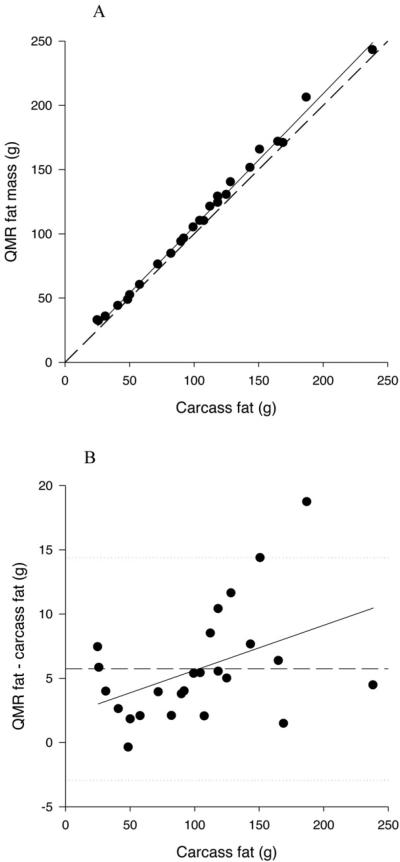
Despite overestimating fat mass, all measures of QMR fat were highly significantly related to carcass fat (P<0.0001) (Table 3; Figure 1A). The slopes of the relationships were all significantly less than 1 (P<0.05), ranging from 0.961 to 0.972, and the r2 ranged from 0.995 to 0.997. None of the intercepts were significantly different than 0 (P>0.110). There was a small, but significant bias in the relationship between QMR fat and carcass fat, with the overestimation being significantly greater with increasing fat mass (P=0.0297 and 0.0330 for 1T3 with and without water estimation respectively; Figure 1B).
Table 3.
Relationships between carcass and QMR data for body composition parameters.
| Body comp | 1T3 | 3T9 | 9T18 | ||||
|---|---|---|---|---|---|---|---|
| water | no water | water | no water | water | no water | ||
| Fat | β | 0.961 | 0.965 | 0.972 | 0.971 | 0.968 | 0.963 |
| P | <0.0001 | <0.0001 | <0.0001 | <0.0001 | <0.0001 | <0.0001 | |
| r2 | 0.995 | 0.996 | 0.996 | 0.996 | 0.996 | 0.997 | |
| Lean | β | 1.162 | 1.162 | 1.154 | 1.154 | 1.157 | 1.158 |
| P | <0.0001 | <0.0001 | <0.0001 | <0.0001 | <0.0001 | <0.0001 | |
| r2 | 0.999 | 0.999 | 0.998 | 0.998 | 0.998 | 0.998 | |
| Water | β | 1.030 | 1.020 | 1.032 | |||
| P | <0.0001 | <0.0001 | <0.0001 | ||||
| r2 | 0.998 | 0.998 | 0.996 | ||||
β – slope of the relationship.
Figure 1.
A. Relationship between QMR fat mass, measured at the 1T3 plus water setting, and carcass fat mass. The solid line represents the regression line, and the dashed line represents the line of identity.
B. Difference plot for QMR fat mass measured at the 1T3 plus water setting. The solid line represents the mean diference between QMR and carcass fat and the dotted lines represent plus and minus 2 sd.
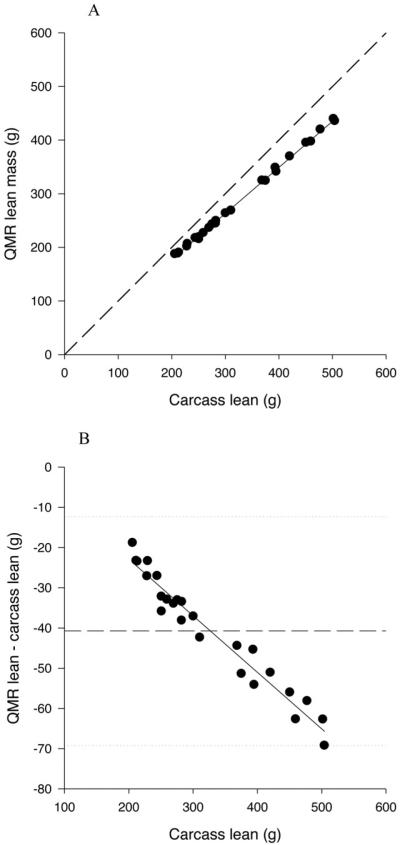
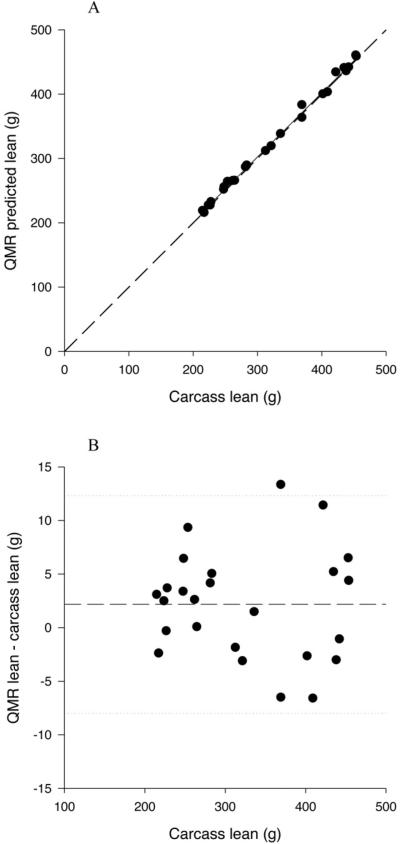
All QMR measures of lean mass were highly significantly related to carcass lean mass (P<0.0001) (Table 3; Figure 2A). All the slopes of the relationships were significantly greater than 1 (P<0.0001) ranging from 1.154 to 1.162; and the r2 ranged from 0.998 to 0.999. The intercepts for the relationships with the 1T3 QMR lean measurements (with and without water) were significantly less than 0 (P<0.05); however, the intercepts for the relationships with 3T9 and 9T18 QMR lean measures were not significantly different than 0 (P>0.15). There was a significant bias in the relationship between QMR lean and carcass lean with the underestimation increasing with increasing lean mass (P<0.0001 for 1T3 both with and without water estimation; Figure 2B).
Figure 2.
A. Relationship between QMR lean mass, measured at the 1T3 plus water setting, and carcass lean mass. The solid line represents the regression line, and the dashed line represents the line of identity.
B. Difference plot for QMR lean mass measured at the 1T3 plus water setting. The solid line represents the mean difference between QMR and carcass lean and the dotted lines represent plus and minus 2 sds.
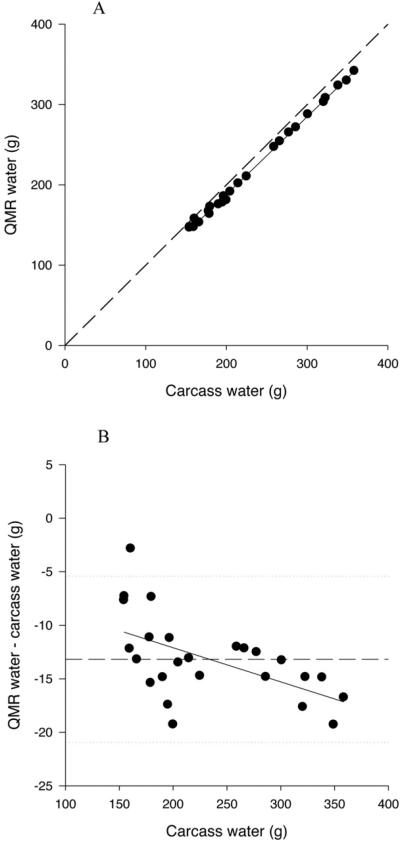
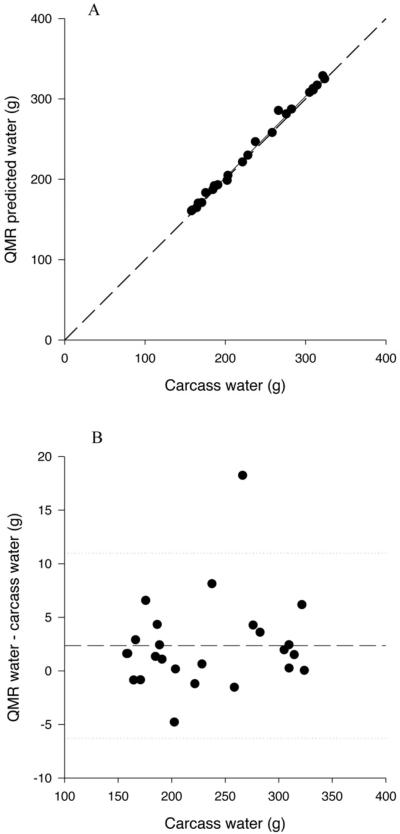
QMR measured total water was significantly and positively related to carcass water (P<0.0001) (Table 3; Figure 3A). The slopes of the relationships for 1T3 and 9T18 acquisitions were significantly greater than 1 (P<0.05); however, total water from 3T9 acquisitions was not significantly different than 1 (P=0.059). R2 ranged from 0.996 to 0.998. The intercepts for the relationships with 1T3 and 3T9 QMR water were significantly greater than 0 (P<0.05), however the intercept for QMR water by 9T18 was not significantly different than 0 (P>0.05). There was also a significant bias in the relationship between QMR water and carcass water with increased underestimation with increased water content (P=0.004 for 1T3; Figure 3B).
Figure 3.
A. Relationship between QMR total water, measured at the 1T3 plus water setting, and carcass water. The solid line represents the regression line, and the dashed line represents the line of identity.
B. Difference plot for QMR water measured at the 1T3 plus water setting. The solid line represents the mean difference between QMR and carcass water and the dotted lines represent plus and minus 2 sd.
Cross-validation accuracy
As in the validation study, QMR significantly overestimated fat mass (P<0.001) by 5.24 g to 6.43 g (~6%). QMR also significantly underestimated lean mass (P<0.0001) by 38.26 g to 39.23 g (~12%), and water (P<0.0001) between 10.38 g to 10.96 g (~4.5%).
The QMR values obtained from the cross validation rats were entered into the prediction equations obtained from the validation study (Table 4). These predicted values of fat, lean and water were then compared to the actual chemical values.
Table 4.
Prediction equations for fat, lean and water for all QMR settings.
| R2 | P | ||
|---|---|---|---|
| Carcass fat | 0.961*QMRfat(1+w)-1.53 | 0.995 | <0.0001 |
| 0.965*QMRfat(1-w)-1.67 | 0.996 | <0.0001 | |
| 0.972*QMRfat(3+w)-2.28 | 0.996 | <0.0001 | |
| 0.971*QMRfat(3-w)-2.58 | 0.996 | <0.0001 | |
| 0.968*QMRfat(9+w)-1.76 | 0.996 | <0.0001 | |
| 0.963*QMRfat(9-w)-1.45 | 0.996 | <0.0001 | |
| Carcass lean | 1.162*QMRlean(1+w) – 5.63 | 0.999 | <0.0001 |
| 1.162*QMRlean(1-w) – 5.79 | 0.999 | <0.0001 | |
| 1.154*QMRlean(3+w) – 3.52 | 0.998 | <0.0001 | |
| 1.154*QMRlean(3-w) – 3.36 | 0.998 | <0.0001 | |
| 1.157*QMRlean(9+w) – 3.93 | 0.998 | <0.0001 | |
| 1.158*QMRlean(9-w) – 4.44 | 0.998 | <0.0001 | |
| Carcass water | 1.03*QMRwater(1+w) + 6.47 | 0.998 | <0.0001 |
| 1.02*QMRwater(3+w) + 8.77 | 0.998 | <0.0001 | |
| 1.03*QMRwater(9+w) + 6.01 | 0.996 | <0.0001 |
(x±w) where x (1, 3 or 9) is the acquisition setting (1T3, 3T9 or 9T18), and w is water.
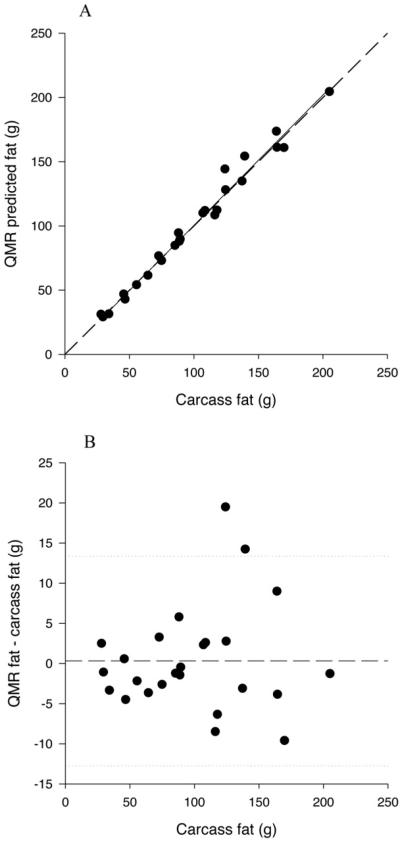
The predicted fat values from QMR (all settings) were not significantly different from the chemical fat values (P>0.400) (Table 5). The average difference across all settings was 0.36 g or 0.36%. Predicted QMR fat values (all settings) were significantly and positively related to carcass fat (P<0.0001; Figure 4A); none of the slopes were significantly different than 1 (P>0.200) and the intercepts were not significantly different than 0 (P>0.280).
Table 5.
Comparison of the QMR predicted values for fat, lean and water and the chemical carcass values for the cross-validation rats.
| Body comp | Predicted 1T3 | Predicted 3T9 | Predicted 9T18 | ||||
|---|---|---|---|---|---|---|---|
| Chemical | water | no water | water | no water | water | no water | |
| Fat (g) | 99.65 ±9.53 | 99.97 ± 9.75 | 100.67 ± 9.71 | 99.64 ± 9.74 | 99.85 ± 9.78 | 100.02 ± 9.73 | 99.90 ± 9.68 |
| Lean (g) | 325.07 ± 17.29 | 327.25 ± 17.28* | 326.60 ± 17.32 | 327.53 ± 17.27* | 327.18 ± 17.23 | 326.85 ± 17.32 | 326.66 ± 17.28 |
| Water (g) | 232.71 ± 11.78 | 235.07 ± 11.97* | 235.44 ± 11.76‡ | 234.75 ± 11.83* | |||
significantly different than chemical P<0.05.
significantly different than chemical P<0.001.
Figure 4.
A. Relationship between the predicted QMR fat mass, measured at the 1T3 plus water setting, and carcass fat mass in the cross-validation study. The solid line represents the regression line, and the dashed line represents the line of identity.
B. Difference plot for predicted QMR fat mass measured at the 1T3 plus water setting in the cross-validation study. The solid line represents the mean difference between predicted QMR fat and carcass fat and the dotted lines represent plus and minus 2 sd.
The predicted lean mass values from the 1T3 and 3T9 (with water) settings were still significantly greater than the chemical lean mass (P<0.05), but only by 2.18 g (0.67%) and 2.46g (0.76 %) respectively (Table 5). Predicted QMR lean from 1T3 and 3T9 (with no water) and also both 9T18 values were not significantly different from the carcass lean value (P>0.05) (average difference 1.75 g or 0.54%). All predicted QMR lean values were significantly and positively related to carcass lean (P<0.0001; Figure 5A); none of the slopes were significantly different than 1 (P>0.740) and the intercepts were not significantly different than 0 (P>0.530).
Figure 5.
A. Relationship between the predicted QMR lean mass, measured at the 1T3 plus water setting, and carcass lean mass in the cross-validation study. The solid line represents the regression line, and the dashed line represents the line of identity.
B. Difference plot for predicted QMR lean mass measured at the 1T3 plus water setting in the cross-validation study. The solid line represents the mean difference between predicted QMR lean and carcass lean and the dotted lines represent plus and minus 2 s.
The QMR predicted water values were significantly greater than carcass water (P<0.05) for all three settings. The difference ranged from 2.04 g (0.88%) to 2.73 g (1.17%) (Table 5). Predicted QMR water values were significantly and positively related to carcass water (P<0.0001; Figure 6A); none of the slopes were significantly different than 1 (P>0.230), and the intercepts were not significantly different than 0 (P>0.300).
Figure 6.
A. Relationship between the predicted QMR water, measured at the 1T3 plus water setting, and carcass water in the cross-validation study. The solid line represents the regression line, and the dashed line represents the line of identity.
B. Difference plot for the predicted QMR water measured at the 1T3 plus water setting in the cross-validation study. The solid line represents the mean difference between predicted QMR water and carcass water and the dotted lines represent plus and minus 2 sd.
There was no longer any significant bias in the QMR determination of fat mass (P>0.500; Figure 4B), lean mass (P>0.670; Figure 5B) or total water (P>0.400; Figure 6B) for any of the settings.
Discussion
In this study we assessed the precision and accuracy of the rat QMR to measure body composition in live, conscious rats. Scanning non-anesthetized animals prevents the deleterious effects of anesthesia on feeding and hence body weight and composition. The precision of this machine was excellent with average CVs all below 1%. The best precision was obtained for lean mass (0.19-0.34%), followed by total water (0.48-0.74%) and then fat mass (0.5-0.92%). These values compare very well with previous validations of QMR in mice. In a study of mice fed different diets, Tinsley et al. [6] measured CVs for fat of 0.46% and 1.28%; and 0.74% and 3.04% for lean mass, in dead and live mice respectively (averaged over all groups). In a second study, the precision for QMR in live mice was measured as 0.78% for lean and 1.58% for fat mass [7]. Thus, the precision values from this study of 0.19-0.34% for lean and 0.5-0.92% for fat compare very favorably with other QMR studies.
DXA precision for lean mass has been shown to be 0.4% [10] and <1.5% for rats [11], 0.86% in mice [12], 1.63% in lemmings [13] and 0.6% in snakes [14]. It is not easy to compare the precision of TOBEC as it is recommended to average several readings (often 10) and to use the average to calculate lean mass. However, Stenger [15] reported a CV of 1.37% for the E-value after removing three animals whose CV's were greater than 3%. In a recent study using BIS in rats, Smith et al. [9] reported CVs for lean between 0.9 and 2.7%. In terms of lean mass, the precision of QMR exceeded that for DXA, TOBEC and BIS.
When validating in-vivo methods of body composition analysis, the precision of fat mass is generally worse than for lean mass, due at least in part to the smaller amount present. This was true for fat mass in this study even though fat precision was still excellent. To our knowledge the only other CV for fat that is less than 1% was for a DXA study of dead rats [16]. Other DXA values for precision of fat mass include 2.5% [10] and 2.6-8.9% in rats [11], 2.2% in mice [12], 4.14% in lemmings [13] and 9.12% in snakes [14]. For BIS the precision in rats was similar to DXA at 2.1-5.4% [9].
There are fewer estimates of precision of total water; however, using BIS, Smith et al. [9] found precision of total water to be 0.9-2.7%. This is significantly higher than our QMR precision of 0.48-0.74%. The data for all three measured body components demonstrate that the precision of the rat QMR exceeded the precision of the other methods of body composition analysis.
In this study, QMR was found to overestimate fat mass and underestimate lean mass and total water. This is in agreement with previous validations of the mouse QMR, which also found an overestimation of fat and underestimation of lean [6,7]. This is not restricted to QMR as many methods used to measure body composition in vivo in different animals do the same; including DXA [11,12,16,17], TOBEC [18] and BIS [9]. The magnitude of the difference between carcass and measured values varies with the species used, the equipment and the body compartment measured. Measuring fat mass in mice with QMR has been shown to overestimate fat by 29% [7] and 23-33% [6] in live mice. The overestimation of fat in this study of approximately 5% is considerably better than the same technique for mice. This may be due to the greater amount of fat present in rats compared with mice. Studies in rats with DXA have shown an overestimation of fat by approximately one-third [16,17]. In mice, values range from 3.3 g overestimation (no percent given) [19] to a 100% overestimation [12]. DXA also overestimated fat in non-rodent studies; by 14.1% in snakes [14] and by 2.04% in cats and dogs [20]. BIS has been shown to overestimate fat in rats by 63.5% [9]. In comparison to other techniques, the overestimation of fat by 5% by QMR in this study is very modest.
The extent of underestimation of lean mass is generally not as severe as for fat mass. Using QMR in mice, there was an underestimation of 7.8% [7]; however, an earlier study in mice had a much larger discrepancy of 24-34% [6]. It is possible that there were changes made to the software and or hardware between these two studies that improved the discrepancy in lean mass. Using DXA, lean mass has been observed to be underestimated by 3% in mice [12], 1.6% in snakes [14] and 2.64% in cats and dogs [20]. The underestimation of lean mass in rats measured with BIS was 15.5% [9]. In this study QMR underestimated lean mass by 12.5%, which is similar to that observed with BIS and in the middle of the two mouse QMR validations.
Despite these absolute differences between carcass and QMR values, all measures of fat, lean and water were very tightly correlated with chemical carcass values (r2>0.99). Whilst it is not unusual to get r2 that high for the comparison of lean mass, it is not common to get such good relationships with fat mass. These relationships provided the prediction equations that were used on the cross-validation data.
In the cross-validation study, the absolute QMR values were entered in to the prediction equations to get predicted values of fat, lean and water that were then compared with the carcass values. If the prediction equations work, there should be no significant difference between the predicted values and the carcass values. Predicted fat mass was no longer significantly different from carcass fat and the difference was reduced from 5% to less than 0.4% for all settings. In addition, the use of the prediction equations eliminated the bias in the data, meaning that there was no longer any effect of increasing fat on the difference. This shows that the QMR can accurately predict fat mass in rats.
The data comparing predicted lean and carcass lean in the cross-validation study is more confusing. In four of the six settings, the predicted QMR lean mass was not significantly different from the carcass values. The difference was reduced from a 12.5% underestimation in the validation study to a 0.54% overestimation. However, at the 1T3 and 3T9 plus water settings, the predicted QMR lean masses were significantly higher than carcass lean, although only by 0.67 and 0.76% respectively. It appears that the use of the prediction equations may have overcompensated. Strictly speaking, this suggests that at these particular settings, the QMR did not accurately predict lean mass. However, the predicted lean values for the settings that did not validate were only 0.13 and 0.22% higher than those that did. This translates to a difference of only 0.43 g. In addition, all of the relationships with carcass lean had slopes that were not significantly different than 1 and intercepts that were not significantly different than 0. All the bias observed in the validation study was removed using the prediction equations for all six settings. Whilst it may be better to use the settings that did validate properly, the small difference between those that did and those that did not suggest that they can be used to predict lean mass.
The predicted QMR water values from all three settings were still significantly different than the carcass water values, going from a 5.5% underestimation to a slight, but significant, overestimation of 0.88 to 1.17%. There did appear to be an outlier in the three settings; however, it was not the same animal at each setting. In addition, the removal of the outlier did not make the difference non-significant. All the slopes of the regressions between predicted QMR water and carcass water were not significantly different than 1, which indicates that if carcass water is, for example, 15 g more in an animal, then the predicted QMR water will be 15 g higher. In addition, the intercepts of the relationships were not significantly different than 0, indicating that they passed through the origin. These two parameters would appear to indicate that QMR is validated for water, despite the slight difference in values. The bias seen in the validation study was also resolved. The difference between QMR predicted water and carcass water (0.88-1.17%) was only slightly greater than the precision of the QMR for measuring water (0.48-0.74%). It is possible that the significant differences observed for some lean and all water measurements are due to the extremely high precision of the machine.
In conclusion, the rat QMR is very precise in measuring fat, lean and total water with the precision estimates being better than DXA, TOBEC and BIS. Despite differences between QMR and carcass values, all parameters were strongly correlated with their carcass values, with some bias. Using the prediction equations removed all bias from the measurement of fat, lean and water and fat was shown to validate completely with no significant differences between predicted QMR and carcass fat. Lean mass validated for 4 of the 6 settings; however, the other two were only slightly different. Water did not validate in terms of absolute difference, but the values were only approximately 1% different. The rat QMR can precisely measure fat, lean and total water and can accurately measure fat and lean mass. This adds another tool for researchers to measure in vivo body composition quickly and without the need for anesthesia.
Acknowledgements
We would like to thank Dr. Bray and the Pennington Biomedical Research Center for supplying us with the original Osborne Mendel rats to start our colony. This work was supported in part by the UAB Clinical Nutrition Research Center (P30DK56336), the Diabetes Research and Training Center (P60DK079626), and the Alabama Neuroscience Blueprint Core Center (P30NS057098). DLS was supported by T32DK062710. The opinions expressed herein are those of the authors and not necessarily those of the NIH or any other organization with which the authors are affiliated.
References
- 1.Speakman J, Hambly C, Mitchell S, et al. The contribution of animal models to the study of obesity. Laboratory Animals. 2008;42:413–32. doi: 10.1258/la.2007.006067. [DOI] [PubMed] [Google Scholar]
- 2.Tschop M, Heiman ML. Rodent obesity models: an overview. Exp Clin Endocrinol Diabetes. 2001;109:307–19. doi: 10.1055/s-2001-17297. [DOI] [PubMed] [Google Scholar]
- 3.Johnson MS, Nagy TR. Animal Body Composition Methods. In: Heymsfield SB, Lohman TG, Wang Z, et al., editors. Human Body Composition. Second Edition ed. Human Kinetics; Champaign: 2005. pp. 141–50. [Google Scholar]
- 4.Morton JM, Kirkpatrick RL, Smith EP. Comments on estimating total body lipids from measures of lean mass. The Condor. 1991;93:463–5. [Google Scholar]
- 5.Hornak JP. The basics of MRI. 2002 www.cis.rit.edu/htbooks/mri.
- 6.Tinsley FC, Taicher GZ, Heiman ML. Evaluation of a quantitative magnetic resonance method for mouse whole body composition analysis. Obes Res. 2004;12:150–60. doi: 10.1038/oby.2004.20. [DOI] [PubMed] [Google Scholar]
- 7.Jones AS, Johnson MS, Nagy TR. Validation of quantitative magnetic resonance for the determination of body composition of mice. Int J Body Comp Res. 2009;7:67–72. [PMC free article] [PubMed] [Google Scholar]
- 8.Harris RB, Martin RJ. Recovery of body weight from below “set point” in mature female rats. J Nutr. 1984;114:1143–50. doi: 10.1093/jn/114.6.1143. [DOI] [PubMed] [Google Scholar]
- 9.Smith DL, Jr, Johnson MS, Nagy TR. Precision and accuracy of bioimpedance spectroscopy for determination of in-vivo body composition in rats. Int J Body Comp Res. 2009;7:21–6. [PMC free article] [PubMed] [Google Scholar]
- 10.Makan S, Bayley HS, Webber CE. Precision and accuracy of total body bone mass and body composition measurements in the rat using x-ray-based dual photon absorptiometry. Can J Physiol Pharmacol. 1997;75:1257–61. [PubMed] [Google Scholar]
- 11.Lukaski HC, Hall CB, Marchello MJ, et al. Validation of dual x-ray absorptiometry for body-composition assessment of rats exposed to dietary stressors. Nutrition. 2001;17:607–13. doi: 10.1016/s0899-9007(01)00577-9. [DOI] [PubMed] [Google Scholar]
- 12.Nagy TR, Clair AL. Precision and accuracy of dual-energy X-ray absorptiometry for determining in vivo body composition of mice. Obes Res. 2000;8:392–8. doi: 10.1038/oby.2000.47. [DOI] [PubMed] [Google Scholar]
- 13.Hunter HL, Nagy TR. Body composition in a seasonal model of obesity: longitudinal measures and validation of DXA. Obes Res. 2002;10:1180–7. doi: 10.1038/oby.2002.160. [DOI] [PubMed] [Google Scholar]
- 14.Secor SM, Nagy TR. Non-invasive measure of body composition of snakes using dual-energy X-ray absorptiometry. Comp Biochem Physiol A Mol Integr Physiol. 2003;136:379–89. doi: 10.1016/s1095-6433(03)00176-4. [DOI] [PubMed] [Google Scholar]
- 15.Stenger J, Bielajew C. Comparison of TOBEC-derived total body fat with fat pad weights. Physiol Behav. 1995;57:319–23. doi: 10.1016/0031-9384(94)00216-r. [DOI] [PubMed] [Google Scholar]
- 16.Jebb SA, Garland SW, Jennings G, et al. Dual-energy X-ray absorptiometry for the measurement of gross body composition in rats. Br J Nutr. 1996;75:803–9. doi: 10.1079/bjn19960187. [DOI] [PubMed] [Google Scholar]
- 17.Rose BS, Flatt WP, Martin RJ, et al. Whole body composition of rats determined by dual energy X-ray absorptiometry is correlated with chemical analysis. J Nutr. 1998;128:246–50. doi: 10.1093/jn/128.2.246. [DOI] [PubMed] [Google Scholar]
- 18.Trocki O, Baer DJ, Castonguay TW. An evaluation of the use of total body electrical conductivity for the estimation of body composition in adult rats: effect of dietary obesity and adrenalectomy. Physiol Behav. 1995;57:765–72. doi: 10.1016/0031-9384(94)00325-4. [DOI] [PubMed] [Google Scholar]
- 19.Brommage R. Validation and calibration of DEXA body composition in mice. Am J Physiol Endocrinol Metab. 2003;285:E454–E459. doi: 10.1152/ajpendo.00470.2002. [DOI] [PubMed] [Google Scholar]
- 20.Speakman JR, Booles D, Butterwick R. Validation of dual energy X-ray absorptiometry (DXA) by comparison with chemical analysis of dogs and cats. Int J Obes Relat Metab Disord. 2001;25:439–47. doi: 10.1038/sj.ijo.0801544. [DOI] [PubMed] [Google Scholar]


