

Abstract
In spite of compelling evidence implicating caspases in drug-induced apoptosis, how tumors modulate caspase expression and activity to overcome the cytotoxicity of anticancer agents is not fully understood. To address this issue, we investigated the role of caspases-3 and 7 in determining the response of breast and lung tumor cell lines to chemotherapy. We found that an early and late apoptotic response correlated with weak and strong cellular caspase-activation, respectively. The results highlight an underappreciated relationship of temporal apoptotic response with caspase-activation and drug-resistance. Moreover, the extent of tumor growth restoration after drug withdrawal was dependent on the degree of endogenous blockage of caspase-3 and caspase-7 cleavages. This points to an unrecognized role of caspase modulation in tumor recurrence and suggests that targeting caspase cleavage is a rational approach to increasing potency of cancer drugs.
Keywords: Apoptosis, caspase, paclitaxel, temporal response, drug resistance
Introduction
Breast and lung cancer are responsible for about 70-80 % of cancer deaths in the world (1, 2). Current treatment modalities involving local radiation and chemotherapy are severely limited at advanced disease stages (3), albeit effective for treating primary tumors when diagnosed early. At mid-stage cancer, where tumor cells begin to exhibit resistance to therapy, a thorough knowledge of the processes conferring chemo-protection to tumors is vital to improve efficacy and to stem disease progression to a malignant phase. This underscores the need for useful preclinical models focused on understanding the devious strategies adopted by tumors to overcome the cytotoxicity of chemotherapeutic agents. A common approach involves exposing parental tumor cell lines to increasing concentrations of chemotherapeutic agents and assaying for cell viability, proliferation, apoptosis, and other response indicators. Such studies have offered important insights into different modes of drug resistance adopted by tumors for survival (1, 4-6). Nonetheless, there is a dearth in knowledge of how tumors modulate major components of the apoptotic machinery, such as caspases, to promote malignancy (7, 8). Understanding the decisive role of caspases in the development of resistant tumor phenotypes is necessary to enhance current knowledge of death evasion by tumors and to provide effective strategies to treat cancers.
In this study, we explored the role of caspases in enabling tumors to overcome drug cytotoxicity by evaluating caspase cleavage patterns and inhibition in breast and lung tumor cell lines. We also determined the relationship between the distinct patterns of cell death and activation of effector caspases in the tumor cell lines. We found that inhibition of effector caspases limits the cytotoxicity of anticancer agents in a tumor cell-type dependent manner. Examination of drug-induced caspase activation revealed that the inhibition of effector caspase cleavage is an important strategy adopted by tumors to overcome drug cytotoxicity.
Materials and Methods
Cell lines and cell culture
The human non-small cell lung carcinoma lines, A549 & A427, and the mammary tumor cell line, 4T1-Luc, were obtained from American Type Culture Collection (Manassas, VA, USA) and maintained in Ham's F12, DMEM and RPMI medium, respectively, supplemented with 10% fetal bovine serum and 1% penicillin and streptomycin (Herndon, VA) as described in the literature (9). After growing to 100% confluence, cells were trypsinized (0.5 mL trypsin in 5 mL PBS) and incubated for 5 -10 min. The cells were then harvested by low speed centrifugation, washed in 1 mL media and seeded at 1 × 10⁴ cells per 200 μL of medium per well in a 96-well plastic plate (Nunc Inc. Rochester, NY). A portion of the cells (1 × 10⁵ cells/well) was also grown overnight on Lab Tek 8-chamber slides (Nunc Inc. Rochester, NY) for caspase-activity and apoptosis assays.
Cell proliferation assay
The effect of paclitaxel on tumor cell growth was evaluated using CyQuant® Cell Proliferation Assay Kit (Invitrogen). Briefly, after adhering cultured cells to the bottom of 96-well plate, the cell medium was aspirated and cells frozen at -70°C. After two freeze-thaw cycles, a volume of 200 μL of diluted working solution consisting of diluted (1:20) lysis buffer solution and diluted (1: 400) CyQuant® GR stock solution was added to each well and incubated for 10 min at room temperature. For drug treatment, the same procedure was adopted, except that cells were incubated with the appropriate paclitaxel concentrations prior to freeze-thaw cycle. Fluorescence intensity was recorded at 485 nm/528 nm (ex/em) using a micro plate reader (Perkin Elmer Wallac Victor™ 1420 Multilabel Counter). Separate reference standard curves were created for converting sample fluorescence intensity values into cell numbers.
Flow cytometry and apoptosis assays
To evaluate DNA content and distinguish populations of live, apoptotic and dead cells, trypsinized 24 h and 48 h drug-treated cells (A549, A427 and 4T1-Luc) were re-suspended in PBS to a concentration of 1 × 10⁶ cells/mL. A mixture of 1 μL YO-PRO® stock solution and 1 μL propidium iodide (PI) stock solution was added to the cell suspension. After 1 h incubation on ice, stained cells were analyzed by FACScan (Becton Dickinson, San Jose, CA) and gated to exclude fractured cells and debris. About 20,000 cells were examined for each determination. PI and YO-PRO® uptake were respectively determined in the FL2H and FL1H channels of a FACSCalibur flow cytometer. Flow data were analyzed by the BD Cell Quest™ Pro software (version 5.1). To further distinguish between late and early apoptotic cells, drug-treated cells were examined using a Vybrant apoptosis kit (Molecular Probes®). After inducing apoptosis in cultured cells with the appropriate doses of paclitaxel, the cells were incubated on ice with a mixture of YO-PRO® and PI for 30 min, washed with PBS and prepared for microscopy.
Caspase activity assay
Vybrant® FAM caspase-3 and 7 assay kit (Molecular Probes®) was used to evaluate membrane permeability and caspase activation. To detect active caspase, an affinity labeled inhibitor specific for caspase-3 and 7 (FLICA) associates a fluoromethyl group bearing a carboxyfluorescein group with the caspase DEVD recognition sequence. The FLICA inhibitor is cell permeant and non-cytotoxic. The unbound FLICA molecules diffuse out of the cell and are washed away. A green fluorescent signal indicates the amount of active caspase present at the time inhibitor is added. About 1 × 10⁴ cells were seeded per 200 μL of media per well in a Lab Tek 8-chamber slide and apoptosis was induced by 24 h paclitaxel treatment. A volume of 10 μL of 30× FLICA working solution was added to the cells and incubated for 1 h at 37°C in 5% CO2 protected from light. Cells were washed with 1× washing buffer and PBS. A Hoechst 3342 stain and PI were added to the cells and incubated for 30 min to stain for nucleic acids and necrotic cells, respectively. The reagents were then discarded and slides prepared for microscopy. To quantify the levels of basal and induced caspase-3 protein and the corresponding activity in different tumor cell lines, we used a fluorometric enzymatic assay, EnzChek® Caspase-3 (Molecular Probes, Eugene, OR). This measures proteolytic cleavage of the caspase-3 specific substrate, Z-DEVD-AMC (where Z represents a benzyloxycarbonyl group, and AMC, represents 7-amino-4-methylcoumarin). The substrate fluoresces weakly in the UV range (Ex/Em∼330/390 nm) but yields strong blue-fluorescent product (Ex/Em ∼ 342/441 nm) upon proteolytic cleavage and allows continuous monitoring of the activity of caspase-3 and its related proteases in cell extracts. Cell extracts from paclitaxel-treated (25 μM) and untreated A549, A427 and 4T1-Luc were treated with final substrate concentration of 200 μM and incubated at room temperature for 1 h. Fluorescence was measured with a micro plate reader using excitation at 360± 40nm, and emission at 460 ± 40 nm. Inhibition studies were done with 10 μM of a reversible caspase-3 inhibitor, Ac-DEVD, prior to treating cells with the substrate. Experiments were performed twice in triplicate (N= 6).
Western blot analysis
Whole cell lysates were prepared in a Chaps® Cell extract lysis buffer (Cell Signaling Technology®). Cells were re-suspended in buffer and disrupted by sonication, and after 3 freeze-thaw cycles, centrifuged at 14000 rpm for 10 min at 4°C. The cytosolic extract (supernatant) was transferred to a new tube and the pellet discarded. Protein content was quantified using the Bio-Rad protein assay (Hercules, CA) and the samples subjected to 15% SDS-PAGE. About 50 μg of lysates was loaded for each sample. After gel transfer to Hybond PVDF membranes (Amersham Bioscience, Uppsala, Sweden), blocking was done with 5% non fat milk and blots were probed with antibodies for caspase-3 and 7 (1:1000 full length rabbit caspase-3 and 7 polyclonal antibodies, Cell Signaling Technology®). Secondary detection was performed with goat-anti-rabbit HRP-linked IgG secondary antibody (1:3000 dilutions in 3% non fat milk). Internal loading control was carried out with β-actin and proteins were detected by enhanced chemiluminescence (Super Signal® Chemiluminescent Substrate, Peirce).
Immunocytochemistry
To determine the in situ expression of poly-ADP-ribose polymerase (PARP) and caspase-3 and 7 after apoptosis induction in tumor cells, immunocytochemical staining was done using the VectaStain®Elite ABC method (Vector Labs, Burlingame, CA). Briefly, drug-treated cells were fixed in Lab Tek 8-chamber slide with 4% paraformaldehyde/PBS/Ca solution for 15 min, blocked with 3% H2O2 for 5 min and with 10% vecta stain normal goat serum for 1 h at 37°C. Cells were incubated overnight at 4°C with the following primary antibodies: anti-PARP antibody against 85 kDa cleaved PARP fragment (1:200 dilution in goat serum, Sigma®, St. Louis, MO), cleaved caspase-3 rabbit monoclonal antibody against p17/p19 fragments of active caspase-3 (1:100 dilution in goat serum, Cell Signaling Technology®, Danvers, MA), and cleaved caspase-7 rabbit antibody against 20 kDa fragment of active caspase-7 (1:100 dilution in goat serum, Cell Signaling Technology®, Danvers, MA). After incubation, the primary antibodies were discarded and cells washed four times with PBS/Ca mixture, 5 min per wash. Biotinylated secondary anti-rabbit antibody was added to the cells and incubated for 1 h at room temperature and stained as described (10, 11), followed by Mayers Hematoxylin counter stain (Fisher). Appropriate controls were set up for each treatment. Cells were visualized on an Olympus FV100 microscope equipped with the appropriate band filters.
Statistical analysis
Statistical analysis was performed using nonlinear regression analysis in GraphPad Prism Software® (version 4.0 for windows, San Diego, CA). Treatment groups per cell type were compared by one-way ANOVA and different cell types were compared by F-test and Student's t-test.
Results
Paclitaxel induces a biphasic apoptotic response and increases hypodiploid nuclei in tumor cells in a time- and dose-dependent manner
To elaborate and explore whether paclitaxel induces biphasic apoptotic response in tumor cells, we performed FACS analysis of A427, A549 and 4T1-luc cells. Extensive reports using these cell lines and the availability of 4T1-luc and A549-in vivo tumor mouse models made these cells an attractive choice for this study (12-16). Hypodiploid nuclei with YO-PRO® stain distinguished apoptotic populations from PI- stained necrotic/dead populations. Increasing drug incubation time from 24 h to 48 h generally increased the percentage of apoptotic hypodiploid nuclei observed in all 3 tumor cell lines. A similar effect occurred by increasing concentrations from 12.5 to 25 μM (Figure 1, Row 1). Remarkably, however, we noticed distinct differences in tumor cell line response at 24 and 48 h drug treatments. At 25 μM and 24 h incubation, the highest percentage of apoptotic nuclei occurred in A549 cells (80%), followed by 4T1-luc cells (65%), and then, A427 (40%) (Figure 1, Row 2 A). We found this somewhat surprising because we had expected 4T1-luc cells to have more apoptotic nuclei based on viability and live/dead assays from previous studies (unpublished) that showed A427 to be the more drug sensitive-cell line. Interestingly, after 48 h drug incubation, we observed a higher percentage of apoptotic nuclei in 4T1-luc cells (80%) than in A549 cells (75%) (Figure 1, Row 2 B and Row 3, bar diagram). The difference in apoptotic rates between 4T1-luc and A549 at 24 and 48 h is indicative of a biphasic response involving an early and late apoptotic phase and potentially contributes to the overall differences in their sensitivity to paclitaxel.
Figure 1. Taxol induces a biphasic apoptotic response and increases hypodiploid nuclei in tumor cells (time and dose-dependency).
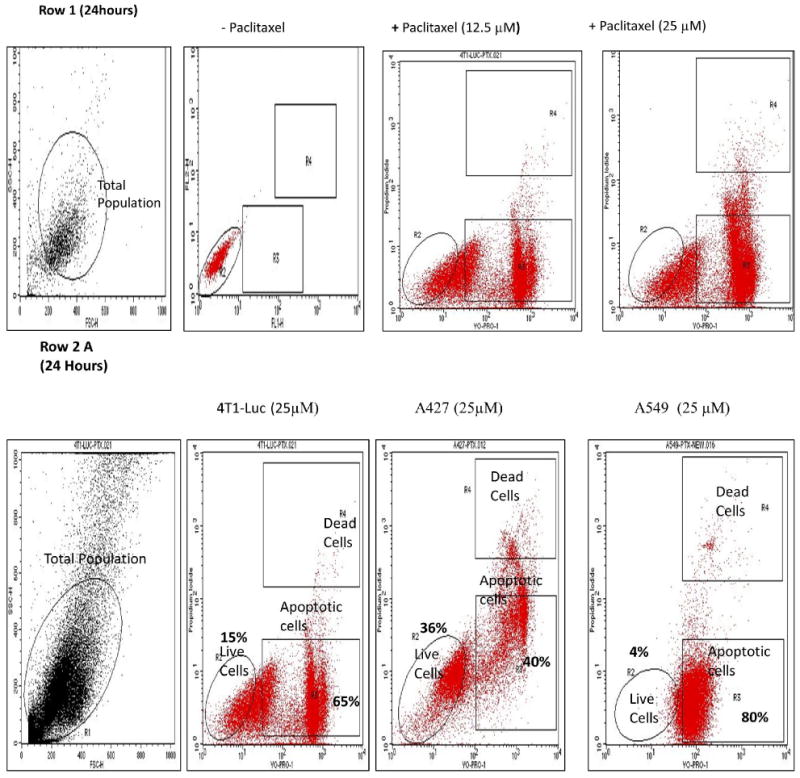
Drug treated cells (1 × 10⁶ cells/ml) were resuspended in buffer and stained by propidium iodide (PI) and YO-PRO® dyes. Nuclei staining by PI and YO-PRO® were analyzed in the FL2H/FL1H channels, respectively, of a FACSCalibur flow cytometer. A laser with 488 nm excitation was used to induce green and red fluorescence emission for YO-PRO® and PI, respectively. Hypodiploid nuclei with the former stain represent apoptotic cells. 20,000 total events were measured for each cell sample. Oval shape represents live cells within total population; top and bottom rectangles represent, dead and apoptotic cells, respectively, of the total population. Row 1: Representative FACS analyses of untreated and treated hypodiploid nuclei indicate taxol-induced apoptosis in cells in time and dose dependent fashion. Row 2: Increase in hypodiploid nuclei is cell specific. Data represents cells treated with 25 μM paclitaxel for 24 h and 48 h. (A) At 24 h the percentage of apoptotic nuclei is highest in A549-cells (80% of total), followed by 4T1-luc (65% of total), and the lowest in A427 cells (40%). (B) At 48 h, the highest percentage of apoptotic nuclei is observed in 4T-1 luc cells (80%), followed by A549 (75%), then A427 (70%). Different pattern of response at 24 h versus 48 h is indicative of an early and late phase of apoptotic response in the tumor cells and underscores different tumor response mechanisms to paclitaxel. Row 3: Comparison between groups treated for 24 h and 48 h with the same and different taxol dose reveal a time and concentration dependent response in tumor cells. The bar diagrams summarize the dose and time response at the indicated concentrations of taxol and show the mean values ± S.D. of hypodiploid nuclei with YO-PRO staining and PI-excluding cells. Statistical analysis was performed using one-way ANOVA/F-test and student's t-test to compare differences between groups. P$< 0.05 – Groups treated with the same concentration but different time points, P# < 0.05 – Groups treated with different concentrations but same time point. At 24 h, 12.5 μM of drug induces a similar response pattern as observed at 25 μM of drug- the higher apoptotic nuclei occurs in A549-cells (43%), followed by 4T1-luc (30%) and the lowest in A427 (15%). However at 48 h, a different response pattern is observed, albeit the differences % in apoptotic nuclei are minor: at 12.5 μM of drug, the highest apoptotic nuclei occurs in 4T1-luc (50%), followed by A549 (45%), and the lowest is observed in A427 (40%). The same response patter occurs at 25 μM: 4T1-Luc (80%), A549 (75%), A427 (70%).
Effector caspase-activity in breast and lung tumor cell lines correlates with apoptosis patterns
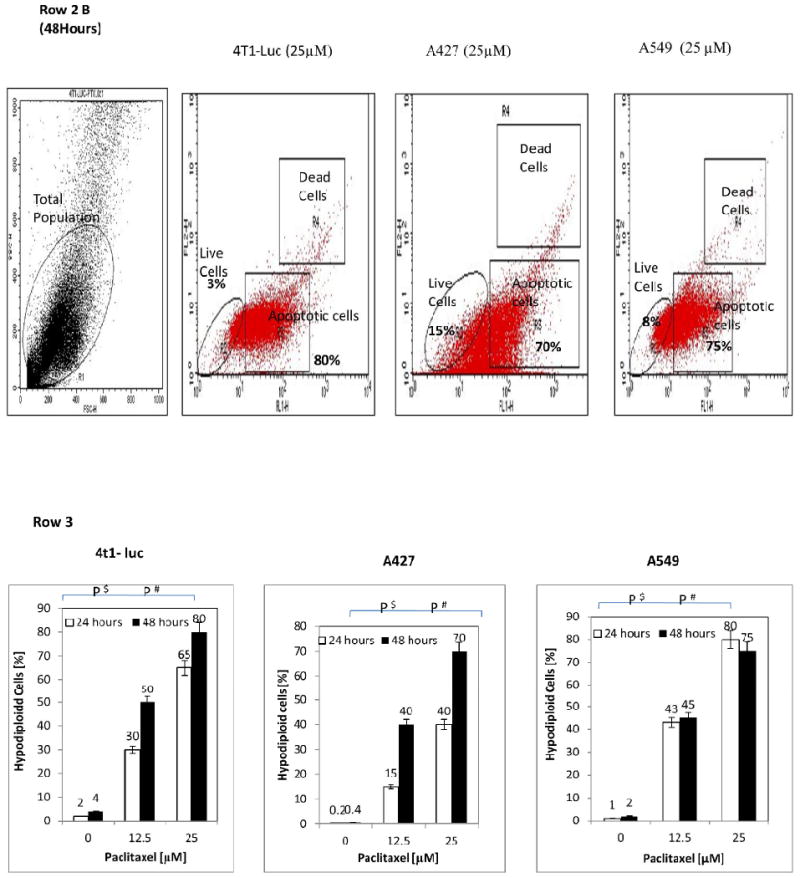
To delineate the role of effector caspase activity in tumor cell response to paclitaxel, we determined the qualitative expression of caspase-3 and its correlation with drug–induced apoptotic patterns in the tumor cell lines. Based on the results of our flow cytometry analysis, we expected 4T1-luc tumor cells, with advanced apoptosis, to have greater caspase activation. On the other hand, we anticipated A549 cells, with early stage apoptosis, to have weak caspase activation after 24 h paclitaxel therapy. Cells were stained with FLICA caspase 3 & 7 inhibitor reagent after drug treatment to monitor caspase-activity. To distinguish between late and early apoptotic cells, drug-treated cells were examined using Vybrant apoptosis assay as described in the Materials and Methods section. As anticipated, relatively stronger effector caspase activation was observed in 4T1-luc cells than in A549 cells (Figure 2 A and B, respectively). We also found a few necrotic cell populations in 4T1-luc cells stained for caspase 3 & 7 (Figure 2 A). Moreover, the patterns of staining also revealed a mixture of apoptotic, necrotic and dual stained cells in 4T1-luc cells (Figure 2 D). However, A549-cells did not exhibit this pattern but rather showed mostly apoptotic cells (Figure 2 E). We found an extensive membrane blebbing in 4T1-luc cell populations, suggesting a more advanced stage of apoptosis compared to A549 cells. Together, our results suggest that paclitaxel induces apoptosis in A549 cells through weak caspase activation but induces both apoptotic and non-apoptotic forms of death in 4T1-luc tumor cells through strong effector caspase activation.
Figure 2. Effector caspase-activity in breast and lung tumor cell lines correlates with apoptosis patterns.
Drug treated 4T1-luc and A549 cells were stained with FLICA caspase 3 & 7 inhibitor reagent (Molecular Probes, Vybrant® FAM Caspase-3 and 7 Assay Kit). Cells were examined for caspase 3 and 7–expression by an Olympus FV 1000 microscope with a 60X/1.2M, 0.13 – 0.21 NA water immersion objective, using a 488 nm laser at 15% transmission and 535 nm emission. Green fluorescence (Ex/Em ∼ 488/530 nm) signal is direct measure of active caspase present at the time inhibitor was added. Red fluorescence (Ex/Em ∼ 535/617 nm) shows necrotic cells. At 12.5 μM of drug for 24 h : (A) Strong effector caspase activation was observed in 4T1-luc cells with a few necrotic cell populations present. (B) Weak effector caspase-activation was observed in A549-cells. (C) Representative control from non-FLICA treated samples showed no caspase detection. For the Vybrant apoptosis assay, Green Stain/YO-PRO® dye shows apoptotic cells only, red stain/Propidium iodide shows necrotic cells, while yellow stain shows both apoptotic and necrotic cells (D) 4T1-luc cells show a mixture of apoptotic, necrotic and dual stained cells, suggesting that caspase-activation by paclitaxel leads to both apoptotic and non-apoptotic forms of death in this tumor cell line. (E) A549 cells mostly show apoptotic stained cells, indicating that apoptosis is the major form of cell death induced by weak caspase-activity in this tumor cell line. (F) Representative positive control population (ethanol-treated cells) shows mostly necrotic cells with no apoptotic stained cells observed. (G) Representative negative control shows neither apoptotic nor necrotic cells.
Differential cleavage of effector caspases in breast and lung tumor cell lines correlates with paclitaxel resistance patterns
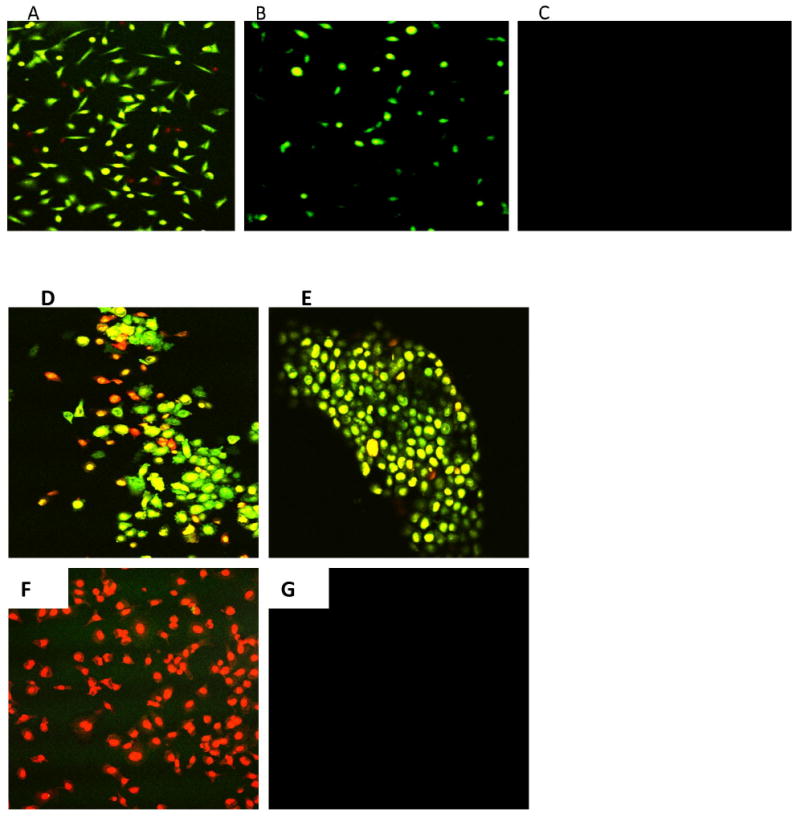
The above results provided primary evidence that caspase activity is predictive of tumor sensitivity to paclitaxel. To further ascertain that 4T1-Luc tumor cells actually expressed increased levels of caspase-3 protein on exposure to paclitaxel, in contrast to A549 and A427-cells with low caspase-3 protein levels, we determined the units of cleaved enzyme in the 3-cell lines by a fluorometric assay. A standard caspase-3 curve (Figure 3 A) was created by reacting serially diluted (3.28 units/mg protein) purified human caspase-3 with 100 μM of Z-DEVD-AMC substrate. Quantification of activated caspase-3 in lysates from the 3-tumor cell lines showed that 4T1-luc cells have the highest activation, with 28 units/mg of cleaved enzyme. In contrast, A459 and A427 cells, have low levels of active enzyme, with 0.66 and 0.1 units/mg of cleaved enzyme, respectively (Figure 3 B). Importantly, the high levels of enzyme units in 4T1-luc cells correlate with the observed pattern of apoptosis, described previously (Figure 2 D). This demonstrated that differences in apoptotic morphology in the tumor cell lines were due to different activated enzyme levels induced by paclitaxel. To complement the enzymatic assay, we performed western blot analysis to probe separately for drug-induced caspase-3 and caspase-7 cleavage. Our immunoblot results reveal high levels of cleaved caspase-3 in drug-treated 4T1-luc cells as indicated by strong bands (17 kDa and 19 kDa) for the caspase-3 activation domain (Figure 3 C). In contrast, drug-treated A549-cells showed poor cleavage of caspase-3 as indicated by a weak band for the activation domain (19 kDa). Interestingly, drug-treated-A427 cells showed no observable cleavage as indicated by absence of a 17/19 kDa fragment (Figure 3 C). In parallel with caspase-3 cleavage results, caspase-7 cleavage is enhanced in drug-treated 4T1-luc cells but inhibited in drug-treated A549 and A427 cells (Figure 3 D).
Figure 3. Paclitaxel induces differential cleavage of effector caspases in tumor cell lines.
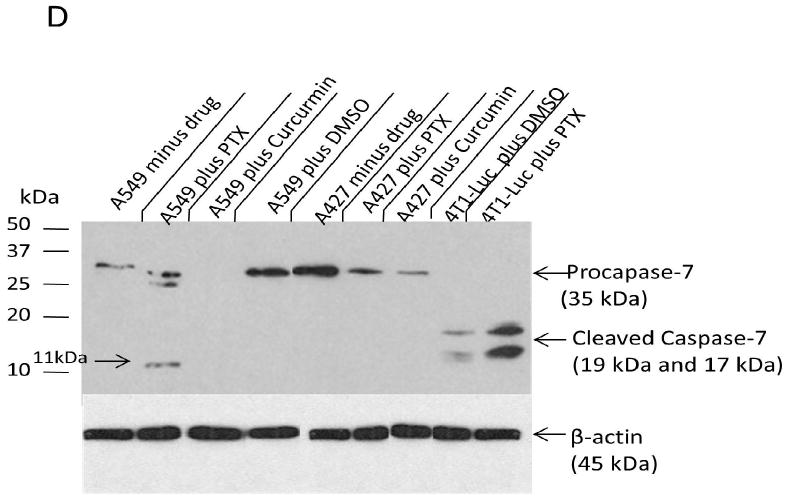
Harvested cell lysates from 3-tumor lines were incubated with caspase-3 specific substrate for 1 h and fluorescence measurements taken by micro plate reader. A standard caspase-3 curve was created by reacting serially diluted purified human caspase-3 (3.28 units/mg protein) with 100 μM of Z-DEVD-AMC substrate and the resulting fluorescence measured by micro plate reader using excitation at 360± 40nm, and emission at 460 ± 40 nm. (A) Enzymatic activity of cleaved caspase-3 over 1 h period reveals steady state kinetics. Linear portion of this standard curve was used to quantify units of cleaved enzyme in the tumor cell lines. (B) Quantification of activated caspase-3 in 3-tumor cell lines shows 4T1-luc cells have the highest activation, with 28 units of cleaved enzyme. In contrast, A459 and A427 cells, have low levels of active enzyme, with 0.66 and 0.099 units of cleaved enzyme, respectively. (C) Caspase-3 cleavage is enhanced in drug-treated 4T1-luc cells, but inhibited in drug-treated A549 and A427 cells. (i) Shows 1 h X-ray exposure of blotted membrane with caspase-3 & 7 proteins, (ii) Shows β-actin internal control and (iii) Shows 10-minute exposure of same membrane from (i). Western blot analysis reveals high levels of cleaved caspase-3 in paclitaxel (PTX)- treated 4T1-luc cells as indicated by strong bands (17kDa and 19kDa) for caspase-3 activation domain. In contrast, paclitaxel (PTX) treated A549-cells showed weak cleavage of caspase-3, while A427 cells showed no observable cleavage. Treatment of A427 and A549 cells with an alternative apoptogenic compound, curcumin, produced a similar effect, with no cleaved-caspase-3 observed in these cell lines. (D) Caspase-7cleavage, like caspase-3 cleavage, is enhanced in drug-treated 4T1-luc cells, but inhibited in drug-treated A549 and A427 cells. Western blot analysis shows high levels of cleaved caspase-7 in drug treated 4T1-luc cells. In contrast, A549-cells showed weak cleavage of caspase-7, while A427 cells showed no observable cleavage.
While no activation domain fragment (17/19 kDa) was observed in A549 cells, a small subunit (11 kDa) was produced, suggesting that paclitaxel induces some protein cleavage in A549, unlike in A427-cells. The weak cleavage of effector caspases in A549-cells suggests that it reacts to paclitaxel by mechanisms that are partially caspase-dependent by repressing caspase-activation or via a general down regulation of caspase-7, as indicated by the weak band for pro-caspase-7 in A549 compared to the slightly stronger band for A427 (Figure 3 D). The weak protein cleavage in resistant A59 cells is suggestive of a protective function of effector caspase cleavage inhibition during drug therapy.
Caspase-3 inhibition limits the anti-proliferative effect of paclitaxel on tumor cells in a cell-dependent fashion
Having demonstrated that varying caspase-3 and-7 activity levels in different tumor cell lines mediate their sensitivity to paclitaxel, we evaluated the potential of exogenous blocking of caspase-3 to improve tumor cell survival and to reduce the apoptotic effect of therapy in drug-sensitive tumor cells. We hypothesized that inhibiting caspase-3 activity concurrently with or before drug treatment will limit the toxic effect of paclitaxel on tumor survival. We predicted that resistant tumor cells with endogenous caspase-3 inhibition capacity will benefit the most from an exogenous boost in caspase-3 inhibition, thereby countering drug toxicity better than sensitive tumors. By analyzing tumor cell proliferation in the presence of caspase-3 inhibitor, we observed that at 6.25 μM of paclitaxel, A549 cells showed the most gain with about 55 % change in the number of proliferating cells, relative to controls. However, 4T1-luc cells showed a modest gain, with approximately 24 % change in cell number relative to controls (Figure 4 A). This pattern was replicable at concentrations ≤ 12.5 μM, but not at concentrations ≥25 μM, perhaps due to loss of inhibition at higher drug doses (data not shown). Possibly, the decrease in inhibition could be simply due to higher levels of drug-induced caspase activity. Surprisingly, A427-cells benefited the least, with only about 11% change in proliferation. Based on the results of our western and enzymatic assays, we had expected at least an equal, if not greater, gain in A427 cell proliferation compared to A549-cells, since both tumor cell lines appeared to have endogenous caspase-3 inhibition potential.
Figure 4. Caspase-3 inhibition limits the anti-proliferative effect of paclitaxel on tumor cells in a cell-dependent fashion.
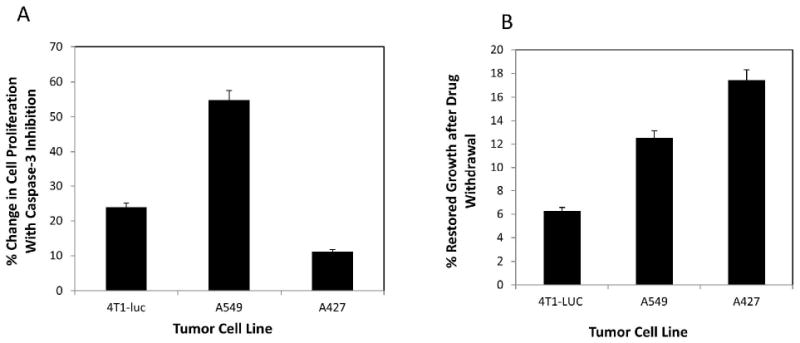
Tumor cells cultured in 96-well plates were incubated for 10 min with a final concentration of 10 μM Ac-DEVD-CHO, a reversible caspase-3 inhibitor, then treated with varying concentrations of drug and allowed to grow for 48 h. Cell proliferation was then measured using CyQuant® Cell Proliferation assay, as previously described. Appropriate controls were performed, without inhibitor and with a nonspecific inhibitor and experiments done in triplicate. N=3. Data represent mean values ± S. D. The % change in cell proliferation was determined relative to inhibitor controls. (A) At 6.25 μM of paclitaxel, A549 cells showed the most gain with about 55% change in the number of proliferating cells, relative to controls without the inhibitor, while 4T1-luc cells showed a modest gain, with approximately 24% change in cell number, relative to controls. A427-cells benefited the least, with about 11% change in proliferation, relative to controls. This pattern was replicable at concentrations ≤ 12.5 μM, but not at concentrations ≥25 μM, perhaps due to loss of inhibition at higher drug doses. (B) To complement studies in (A), cells treated with 6.25 μM of drug, were allowed to grow for 48 h, after which drug was washed off with phosphate buffered saline and cells re-cultured for another 48 h in fresh medium. Appropriate controls with non-drug treated cells were performed and each experiment done in triplicate. N=3. % Restored Growth was computed by the formula: 100% [1- (treatment/control)]. A427, with the least effector caspase activity, showed the most favorable response, with approximately 18% growth restoration after drug withdrawal, followed by A549-cells, with 12% growth restoration, while 4T1-luc cells showed the least viability, with 6% restored growth.
To verify that the minimal change observed in A427 cells was not simply due to loss of cells in the inhibition study, we performed a drug withdrawal study, where drug-treated cells were re-cultured with fresh medium and allowed to proliferate for 48 h after washing off the drug. We hypothesized that withdrawing paclitaxel from the culture medium after therapy should allow cells with less effector caspase cleavage to have more restoration in growth than those with efficient cleavage and that the growth trend should replicate the resistance pattern. As expected, A427 and A549- tumor cell lines, with the least effector caspase activity, showed the most favorable response, with approximately 18 % and 12 % growth restoration, respectively, while 4T1-luc cells showed the least viability, with 6 % restored growth (Figure 4 B). The results demonstrate that the minimal increase in A427 cell proliferation observed earlier in the inhibition study was not simply due to loss of A427 cells. Rather, A427 cells were less dependent on the functional status of caspase-3 for survival.
Dose-dependent activation of effector caspases by paclitaxel correlates with cleavage of endogenous caspase substrate, PARP
To demonstrate the connection of tumor response with downstream effectors of paclitaxel, we assessed the in situ cleavage of the endogenous effector caspase substrate, poly-(ADP-ribose)-polymerase (PARP). This is a DNA nick sensor that repairs damaged DNA by poly (ADP-ribosylation) and whose cleavage by caspases serves as a biochemical hallmark of apoptosis. We performed immunocytochemical analysis to measure the expression of activated caspase-3 and cleaved caspase-7, as well as the consequent proteolysis of PARP. We expected to see similar patterns as observed in our previous assays. Drug-treated A549 and 4T1-luc cells were fixed with 4 % paraformaldehyde/PBS/Ca solution and probed with the appropriate antibodies. The appropriate controls were performed for each treatment (Figure 5, Rows C, F and I). As anticipated, A549 cells exhibited dose-dependent activation of caspase-3, albeit a weak expression was observed, whereas 4T1-luc cells showed strong ubiquitous activation of caspase-3, especially at 25 μM of paclitaxel (Figure 5, Rows A and B). In line with our expectations, the expression pattern of caspase-7 replicated that of caspase-3 in both tumor cell lines, with A549 cells showing weak dose-dependent activation of caspase-7 and 4T1-luc cells displaying stronger caspase-7 expression at each drug dose (Figure 5, Rows D and E).
Figure 5. Dose-dependent activation of effector caspases by paclitaxel correlates with cleavage of endogenous caspase substrate, PARP.
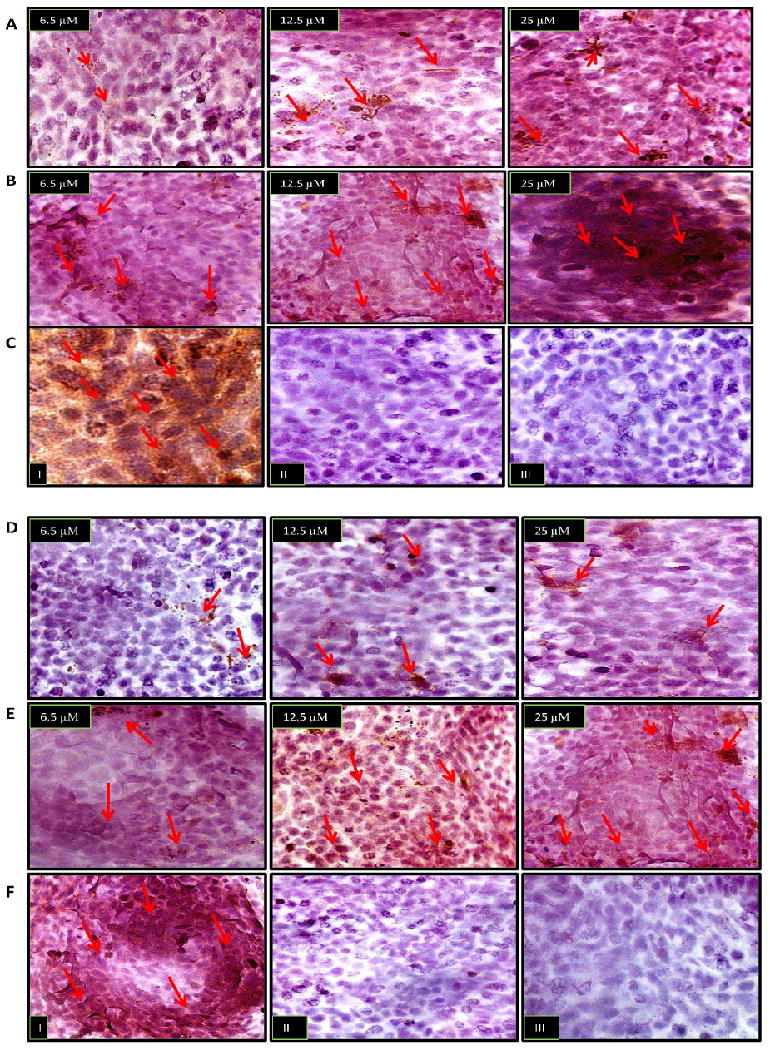
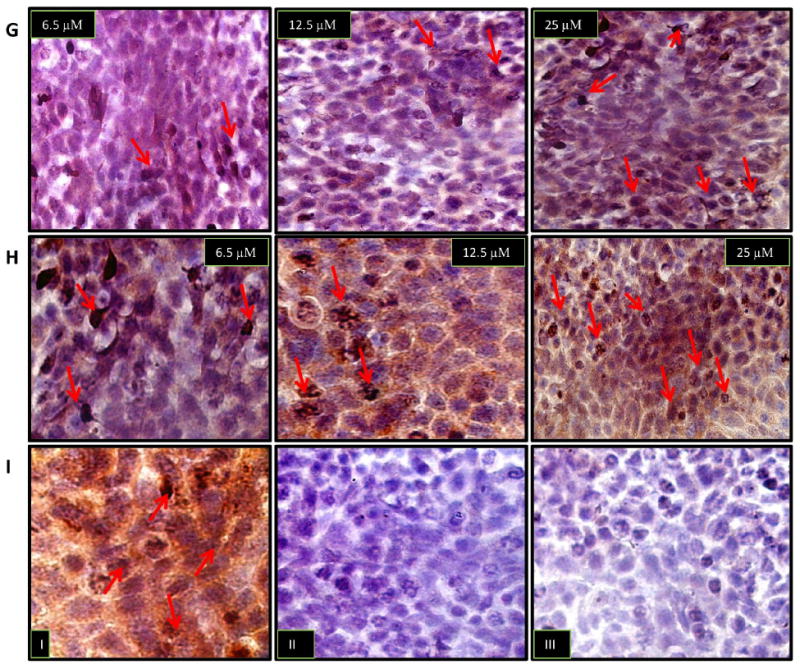
Immunocytochemical analysis was performed to assess the in situ cleavage of the endogenous effector caspase substrate, poly-(ADP-ribose)-polymerase (PARP), by activated caspase-3 and-7. In each image, arrows point to brown spots which reflect areas of caspase-3, caspase 7 and PARP expression. (Row A) A549 cells show dose-dependent activation of caspase-3, albeit a weak expression is observed. (Row B) 4T1-luc cells show a strong ubiquitous activation of caspase-3, especially at 25 μM of paclitaxel, compared to top image of A549-cells at 25 μM of drug. (Row C) Control populations: (I) Representative positive control with ethanol treated cells show strong ubiquitous caspase-3 activation (II) Representative negative control with caspase-3 binding peptide shows no expression of cleaved caspase-3 (III) control expression in the absence of cleaved caspase-3 primary antibody. (Row D) A549 cells show weak dose-dependent activation of caspase-7. (Row E) At each indicated drug dosage, 4T1-luc cells showed stronger caspase-7 activation, compared to A549 cells (top images). (Row F) Representative Control Populations: (I) positive control with ethanol treated cells show strong ubiquitous caspase-7 activation. (II) Negative control with caspase-7 binding peptide shows no expression of cleaved caspase-3 (III) control expression in the absence of cleaved caspase-7 primary antibody. (Row G) A549 cells show dose-dependent nuclear expression of cleaved PARP. (Row H) 4T1-luc cells show regions of dense nuclear activation of PARP in a dose dependent fashion. Row (I) – I, II and III show representative positive control, negative control with PARP binding peptide and without primary PARP antibody, respectively.
The more exciting finding, however, was the relatively denser nuclear staining of cleaved PARP, observed in 4T1-luc cells than in A549-cells, at each drug dose (Figure 5, Rows G and H). This finding suggests that, with less PARP cleavage in A549 cells, this tumor cell line had more store of functional PARP, affording it the opportunity to repair damaged DNA better than 4T1-luc cells. Thus, with the weak cleavage of effector caspases, A549-cells can maintain DNA integrity and limit the degree of death response induced by paclitaxel. On the other hand, efficient caspase-activation with consequent ubiquitous PARP cleavage renders 4T1-luc cells vulnerable to a full scale death response due to the greater degree of DNA damage. Taken together, our results suggest a model in which tumor sensitivity to paclitaxel is modulated by the differential activation or inhibition of effector caspases and their subsequent interactions with their respective substrates. Stronger activation confers drug sensitivity, whereas, inhibition or weak activation confers resistance.
Discussion
Aggressive expansion of lesions, which compromise cell proliferation, differentiation, and eventual morbidity, underpin the pathogenesis of cancer. Moreover, it is known that tumors have an intrinsic ability to manipulate the molecular machineries that induce the apoptotic process which results in the evasion of drug-induced death (17-20). Nonetheless, it is unclear how tumors co-opt major components of the apoptotic machinery, such as caspases, to gain resistance to chemotherapeutic agents (11, 21-25). To this end, we explored the role caspases play in helping tumor cells evade the cytotoxicity of drugs by addressing two questions: (1) what is the relationship between activation of caspase-3 and caspase-7 and the patterns of drug resistance and cell death in tumor cell lines and (2) to what extent does caspase-inhibition limit the toxic effect of drugs on tumor cell growth?
To address the first question, it was necessary to establish the patterns of cell death and drug resistance in different tumor cell lines. We chose breast and tumor lung cancer lines as model systems given the high incidence of tumor recurrence in patients suffering from these malignancies (21, 26). as well as the numerous reports of acquired drug resistance in these cancers (27-29). We used the well established chemotherapeutic agent, paclitaxel, to induce death in the cells. Our analyses reveal that breast and lung tumor cell lines exhibit a biphasic response involving an early and late apoptotic phase with major differences in sensitivity to drug. Whereas the breast tumor cells displayed relatively higher sensitivity, lung tumor cells appeared to be more resistant to chemotherapy. The differences in response patterns between the two tumor cell lines could be attributed to the ability of the tumor cell types to either activate or deactivate specific components of the death response pathway. In particular, the observed early and late response in lung versus breast tumor cell lines, perhaps, point to the activation of upstream and downstream components, respectively.
To determine the underlying mechanism of tumor response in the two cell lines, we evaluated the activation of caspses-3 and caspase-7, known to act downstream of the apoptotic pathway (30). We found that an early apoptotic response in lung tumor cells correlated with weak caspase-activation, whereas a late response correlated with strong caspase-activation in 4T1-luc cells. Considering that the more sensitive breast tumor cell line, with late apoptotic phase response, displayed >40 -200% units of drug-induced caspase activity than lung tumors, which had early phase response, our finding reveals an underappreciated relationship of temporal apoptotic response with caspase-activation and drug-resistance.
Noteworthy, an illuminating observation from this study is that the two cell lines appear to exhibit a dual threshold for caspase-driven execution of apoptosis. In the early phase of apoptosis, A549-cells have a lower threshold than 4T1-luc cells. Therefore, in spite of its weak caspase activation (Figure 3), the A549-cell line shows more signs of apoptosis (Figure 2E). The high threshold in 4T1-luc cells, however, requires strong caspase-activation to yield the apoptotic phenotype in the early phase (Figure 2A). In the late phase, the trend is reversed such that A549-cells require higher levels of caspase activation to induce apoptosis, thus the relative net change in A549-tumor cell apoptosis is minimal. In contrast, 4T1-luc cells, with a relatively lower threshold in the late phase, exhibit greater net change in apoptosis. The heterogeneity of death phenotypes in 4T1-luc cells underscores the fact that other pathways act in synergy with caspase-activation, to regulate cell death in this cell line.
Together, the results evoke a graded correlation between apoptosis and caspase activity, involving two alternating thresholds. We reason that this sophisticated strategy allows the more resistant A549-tumor cell to simulate molecular mimicry of apoptosis at the early phase. This survival mechanism yields lower net change in apoptosis, allows the cells to slip into a dormant state and evade the long-term effects of the chemotherapeutic agent. Therefore, withdrawal of drug or termination of drug treatment restores tumor cell growth (Figure 4 B). Essentially, through fine-tuned modulation of executioner caspase cleavage, A549-cells are able to ensure their survival. In contrast, for 4T1-luc cells, the initial high threshold means strong caspase activation to a point of no return, and this renders the cells susceptible to the toxic effects of paclitaxel.
Furthermore, we postulate that, with the early apoptotic response, lung tumor cells are more able to counter the therapeutic response by limiting activation of the apoptotic machinery, whereas the breast tumor cells with a late response are unable to have this effect. Observation of strong activation of downstream caspase targets in breast tumor cells such as PARP corroborates this model and underscores a major finding of our study. Thus, the difference between breast and lung tumor cancer cell response to chemotherapy resides potentially in the ability or inability to partially or completely block caspase-3 and 7-cleavage. In the case of lung tumors, blocking caspase cleavage confers resistance to paclitaxel, while in the case of breast tumor cells, lack of this cleavage inhibition or conversely, an efficient cleavage, renders tumor cells sensitive to drug treatment. Work by others implicating the inhibition of caspase-9 and-10 in promoting clonogenic survival during paclitaxel treatment provides a strong support for our observations (4, 30-32).
To strengthen the postulation that caspase inhibition is vital to paclitaxel resistance in tumor cells, we determined the degree to which exogenous inhibition of caspase-3 activation can limit the cytotoxicity of paclitaxel on tumor survival. In general, the paclitaxel-resistant lung tumor cells exhibited more gain in survival with exogenous caspase-3 inhibition than did breast tumor cells. Replication of this result on drug withdrawal reinforced the assumption that tumor cell resistance to paclitaxel occurs through complete blockage of caspase activation or through an ability to conceal the activation event by weak caspase cleavage – a form of inoculation. The concealed death process probably puts cells in a temporary apoptosis mode, which becomes reversible with drug depletion. Additional studies are needed to validate this model, which has strong clinical implications if proven true. For one, it emphasizes the danger of prolonged lapses in the time between therapy administrations because this allows cells to revert to their tumorigenic status.
Moreover, our observations point to the role of caspase modulation in tumor recurrence and suggest that targeting caspase cleavage is a rational approach to increasing potency of cancer drugs. Combined with the drug withdrawal results, we conclude that tumor cells which are intrinsically able to interfere with caspase-3 activity benefit the most from an external caspase-3 inhibition stimulus. Therefore, while targeting caspase inhibition has implications for clinical therapy, our findings underscore the need for specific inhibitor agents because tumors exhibit a varying range of responses to different inhibition methods. In addition, we suggest a focused study on the transcriptional and translational regulation of effector caspases in tumor cells. Given the plausibility of dual thresholds for therapeutic response, a solid grasp of the regulatory processes underlying caspase activity in tumors promises to unravel novel ways to effectively target caspases. Other avenues to explore include using agents that co-activate caspases and key lyososomal proteases implicated in tumor cell death (33). Tumor growth regulation is a concerted effort to limit death and promote proliferation, thus, combination therapy that seeks to enhance tumor death and limit proliferation will be a step in the right direction.
In spite of reports to the contrary (34), our findings emphasize the central role effector caspases play to facilitate tumor evasion of chemotherapy. While it is possible that defective caspase cleavage in lung tumor cell lines occurs as result of folding mutations in caspase-3, others have demonstrated these events to be rare and unlikely (35). Nonetheless, it is plausible that strategies such as stress responses and disruptions in the caspase-3 activation loop, as well as up-regulation of unidentified endogenous inhibitors play a decisive role in the development of resistance to paclitaxel. In summary, our study suggests that modulation of caspase cleavage is a strategy adopted by tumors to overcome paclitaxel-mediated cytotoxicity. Ultimately, a solid grasp of caspase regulation is essential to improve the efficacy of anticancer agents and to minimize tumor recurrence.
Acknowledgments
We thank Bao Xu, Dr. Duanwen Shen, and Dr. Sharon Bloch for valuable suggestions and discussions. We also thank the High Speed Cell Sorter Core of Alvin J. Siteman Cancer Center at Washington University School of Medicine in St. Louis, MO, which provided FACs analysis service for this study. The Siteman Cancer Center is supported in part by the NCI Cancer Center Support Grant #P30 CA91842. This study was supported in part by NIH grants (R01 CA109754, R01 EB1430, R33 CA100972, and R21 CA123537).
References
- 1.Parkin DM, Bray F, Ferlay J, Pisani P. Global cancer statistics, 2002. CA Cancer J Clin. 2005;55(2):74–108. doi: 10.3322/canjclin.55.2.74. [DOI] [PubMed] [Google Scholar]
- 2.Yoh K, Ishii G, Yokose T, et al. Breast cancer resistance protein impacts clinical outcome in platinum-based chemotherapy for advanced non-small cell lung cancer. Clin Cancer Res. 2004;10(5):1691–1697. doi: 10.1158/1078-0432.ccr-0937-3. [DOI] [PubMed] [Google Scholar]
- 3.Gee MS, Upadhyay R, Bergquist H, et al. Multiparameter noninvasive assessment of treatment susceptibility, drug target inhibition and tumor response guides cancer treatment. Int J Cancer. 2007;121(11):2492–2500. doi: 10.1002/ijc.22995. [DOI] [PubMed] [Google Scholar]
- 4.Janssen K, Pohlmann S, Janicke RU, Schulze-Osthoff K, Fischer U. Apaf-1 and caspase-9 deficiency prevents apoptosis in a Bax-controlled pathway and promotes clonogenic survival during paclitaxel treatment. Blood. 2007;110(10):3662–3672. doi: 10.1182/blood-2007-02-073213. [DOI] [PubMed] [Google Scholar]
- 5.Wieder T, Essmann F, Prokop A, et al. Activation of caspase-8 in drug-induced apoptosis of B-lymphoid cells is independent of CD95/Fas receptor-ligand interaction and occurs downstream of caspase-3. Blood. 2001;97(5):1378–1387. doi: 10.1182/blood.v97.5.1378. [DOI] [PubMed] [Google Scholar]
- 6.Thornberry NA. Caspases: key mediators of apoptosis. Chem Biol. 1998;5(5):R97–103. doi: 10.1016/s1074-5521(98)90615-9. [DOI] [PubMed] [Google Scholar]
- 7.Dlamini Z, Mbita Z, Ledwaba T. Can targeting apoptosis resolve the cancer saga? Future Oncol. 2005;1(3):339–349. doi: 10.1517/14796694.1.3.339. [DOI] [PubMed] [Google Scholar]
- 8.Green DR, Evan GI. A matter of life and death. Cancer Cell. 2002;1(1):19–30. doi: 10.1016/s1535-6108(02)00024-7. [DOI] [PubMed] [Google Scholar]
- 9.Lu X, Arthur G. The differential susceptibility of A427 and A549 cell lines to the growth-inhibitory effects of ET-18-OCH3 does not correlate with the relative effects of the alkyl-lysophospholipid on the incorporation of fatty acids into cellular phospholipids. Cancer Res. 1992;52(10):2813–2817. [PubMed] [Google Scholar]
- 10.Duan WR, Garner DS, Williams SD, et al. Comparison of immunohistochemistry for activated caspase-3 and cleaved cytokeratin 18 with the TUNEL method for quantification of apoptosis in histological sections of PC-3 subcutaneous xenografts. J Pathol. 2003;199(2):221–228. doi: 10.1002/path.1289. [DOI] [PubMed] [Google Scholar]
- 11.Sanghavi DM, Thelen M, Thornberry NA, Casciola-Rosen L, Rosen A. Caspase-mediated proteolysis during apoptosis: insights from apoptotic neutrophils. FEBS Lett. 1998;422(2):179–184. doi: 10.1016/s0014-5793(98)00004-0. [DOI] [PubMed] [Google Scholar]
- 12.Achilefu S, Bloch S, Markiewicz MA, et al. Synergistic effects of light-emitting probes and peptides for targeting and monitoring integrin expression. Proc Natl Acad Sci U S A. 2005;102(22):7976–7981. doi: 10.1073/pnas.0503500102. [DOI] [PMC free article] [PubMed] [Google Scholar]
- 13.Coxon JP, Oades GM, Kirby RS, Colston KW. Zoledronic acid induces apoptosis and inhibits adhesion to mineralized matrix in prostate cancer cells via inhibition of protein prenylation. BJU Int. 2004;94(1):164–170. doi: 10.1111/j.1464-4096.2004.04831.x. [DOI] [PubMed] [Google Scholar]
- 14.Hiraga T, Williams PJ, Ueda A, Tamura D, Yoneda T. Zoledronic acid inhibits visceral metastases in the 4T1/luc mouse breast cancer model. Clin Cancer Res. 2004;10(13):4559–4567. doi: 10.1158/1078-0432.CCR-03-0325. [DOI] [PubMed] [Google Scholar]
- 15.Zeng H, Wei Q, Huang R, et al. Recombinant adenovirus mediated prostate-specific enzyme pro-drug gene therapy regulated by prostate-specific membrane antigen (PSMA) enhancer/promoter. J Androl. 2007;28(6):827–835. doi: 10.2164/jandrol.107.002519. [DOI] [PubMed] [Google Scholar]
- 16.Zeng Z, Yuan X, Liu G, et al. Manipulation of proliferation and differentiation of human bone marrow-derived neural stem cells in vitro and in vivo. J Neurosci Res. 2007;85(2):310–320. doi: 10.1002/jnr.21131. [DOI] [PubMed] [Google Scholar]
- 17.Kerr LE, Birse-Archbold JL, Simon A, et al. Differential regulation of caspase-3 by pharmacological and developmental stimuli as demonstrated using humanised caspase-3 mice. Apoptosis. 2004;9(6):739–747. doi: 10.1023/B:APPT.0000045787.50848.e1. [DOI] [PubMed] [Google Scholar]
- 18.Li R, Moudgil T, Ross HJ, Hu HM. Apoptosis of non-small-cell lung cancer cell lines after paclitaxel treatment involves the BH3-only proapoptotic protein Bim. Cell Death Differ. 2005;12(3):292–303. doi: 10.1038/sj.cdd.4401554. [DOI] [PubMed] [Google Scholar]
- 19.Liebmann JE, Cook JA, Lipschultz C, et al. Cytotoxic studies of paclitaxel (Taxol) in human tumour cell lines. Br J Cancer. 1993;68(6):1104–1109. doi: 10.1038/bjc.1993.488. [DOI] [PMC free article] [PubMed] [Google Scholar]
- 20.Rossi D, Gaidano G. Messengers of cell death: apoptotic signaling in health and disease. Haematologica. 2003;88(2):212–218. [PubMed] [Google Scholar]
- 21.Perkins C, Kim CN, Fang G, Bhalla KN. Overexpression of Apaf-1 promotes apoptosis of untreated and paclitaxel- or etoposide-treated HL-60 cells. Cancer Res. 1998;58(20):4561–4566. [PubMed] [Google Scholar]
- 22.Perkins CL, Fang G, Kim CN, Bhalla KN. The role of Apaf-1, caspase-9, and bid proteins in etoposide- or paclitaxel-induced mitochondrial events during apoptosis. Cancer Res. 2000;60(6):1645–1653. [PubMed] [Google Scholar]
- 23.Ponnathpur V, Ibrado AM, Reed JC, et al. Effects of modulators of protein kinases on taxol-induced apoptosis of human leukemic cells possessing disparate levels of p26BCL-2 protein. Clin Cancer Res. 1995;1(11):1399–1406. [PubMed] [Google Scholar]
- 24.Schiff PB, Horwitz SB. Taxol stabilizes microtubules in mouse fibroblast cells. Proc Natl Acad Sci U S A. 1980;77(3):1561–1565. doi: 10.1073/pnas.77.3.1561. [DOI] [PMC free article] [PubMed] [Google Scholar]
- 25.Schiller JH, Harrington D, Belani CP, et al. Comparison of four chemotherapy regimens for advanced non-small-cell lung cancer. N Engl J Med. 2002;346(2):92–98. doi: 10.1056/NEJMoa011954. [DOI] [PubMed] [Google Scholar]
- 26.Parkin DM, Bray FI, Devesa SS. Cancer burden in the year 2000. The global picture. Eur J Cancer. 2001;37(Suppl 8):S4–S66. doi: 10.1016/s0959-8049(01)00267-2. [DOI] [PubMed] [Google Scholar]
- 27.Goncalves A, Braguer D, Kamath K, et al. Resistance to Taxol in lung cancer cells associated with increased microtubule dynamics. Proc Natl Acad Sci U S A. 2001;98(20):11737–11742. doi: 10.1073/pnas.191388598. [DOI] [PMC free article] [PubMed] [Google Scholar]
- 28.Hei TK, Hall EJ. Taxol, radiation, and oncogenic transformation. Cancer Res. 1993;53(6):1368–1372. [PubMed] [Google Scholar]
- 29.McCloskey DE, Armstrong DK, Jackisch C, Davidson NE. Programmed cell death in human breast cancer cells. Recent Prog Horm Res. 1996;51:493–508. [PubMed] [Google Scholar]
- 30.Nicholson DW, Ali A, Thornberry NA, et al. Identification and inhibition of the ICE/CED-3 protease necessary for mammalian apoptosis. Nature. 1995;376(6535):37–43. doi: 10.1038/376037a0. [DOI] [PubMed] [Google Scholar]
- 31.Park SJ, Wu CH, Gordon JD, et al. Taxol induces caspase-10-dependent apoptosis. J Biol Chem. 2004;279(49):51057–51067. doi: 10.1074/jbc.M406543200. [DOI] [PubMed] [Google Scholar]
- 32.Weigel TL, Lotze MT, Kim PK, et al. Paclitaxel-induced apoptosis in non-small cell lung cancer cell lines is associated with increased caspase-3 activity. J Thorac Cardiovasc Surg. 2000;119(4 Pt 1):795–803. doi: 10.1016/S0022-5223(00)70016-X. [DOI] [PubMed] [Google Scholar]
- 33.Broker LE, Huisman C, Span SW, et al. Cathepsin B mediates caspase-independent cell death induced by microtubule stabilizing agents in non-small cell lung cancer cells. Cancer Res. 2004;64(1):27–30. doi: 10.1158/0008-5472.can-03-3060. [DOI] [PubMed] [Google Scholar]
- 34.Huisman C, Ferreira CG, Broker LE, et al. Paclitaxel triggers cell death primarily via caspase-independent routes in the non-small cell lung cancer cell line NCI-H460. Clin Cancer Res. 2002;8(2):596–606. [PubMed] [Google Scholar]
- 35.Soung YH, Lee JW, Kim SY, et al. Somatic mutations of CASP3 gene in human cancers. Hum Genet. 2004;115(2):112–115. doi: 10.1007/s00439-004-1129-3. [DOI] [PubMed] [Google Scholar]