

Abstract
Background
Portal vein thrombosis (PVT) complicates the liver transplant operation and potentially affects waiting list survival. The implications on calculations of survival benefit, which balance both waiting list and posttransplant survival effects of PVT, have not been determined. The objective of this study is to describe the effect of PVT on the survival benefit of liver transplantation.
Methods
Using Scientific Registry of Transplant Recipients (SRTR) data on adult liver transplant candidates wait-listed between September 2001 and December 2007, Cox proportional hazards models were fitted to estimate the covariate-adjusted effect of PVT on transplant rate, waiting list survival and posttransplant survival. We then used sequential stratification to estimate liver transplant survival benefit by cross-classifications defined by MELD score and PVT status.
Results
The prevalence of reported PVT among 22,291 liver transplant recipients was 4.02% (N = 897). PVT was not a predictor of waiting list mortality (HR=0.90; p=0.23), but was a predictor of posttransplant mortality (HR=1.32; p=0.02). Overall, transplant benefit was not significantly different for patients with PVT vs. without PVT (p=0.21), but there was a shift in the benefit curve. Specifically, the threshold for transplant benefit among patients without PVT was MELD > 11, compared to MELD > 13 for PVT patients.
Conclusions
PVT is associated with significantly higher posttransplant mortality, but does not affect waiting list mortality. Among low-MELD patients, PVT is associated with less transplant survival benefit. Clinicians should carefully consider the risks of liver transplantation in clinically stable patients who have PVT.
Keywords: mesenteric thrombosis, liver transplant survival, waiting list mortality, posttransplant survival, MELD score
Introduction
The development of extrahepatic portal vein thrombosis (PVT) may markedly complicate the management of patients with chronic liver disease. Even though most patients are diagnosed with PVT incidentally during the workup of their liver disease, some may present with decompensation of previously stable disease (1, 2). PVT is thought to be associated with increased resistance to portal flow from architectural changes in the liver associated with cirrhosis. In addition, PVT may be associated with acquired or inherited abnormalities of coagulation (3–5). PVT is also frequently noted in the setting of cirrhosis and hepatocellular carcinoma and is generally associated with a poor prognosis (6). Overall, the prevalence of PVT among patients with cirrhosis ranges from 1% to 16%, and a substantial number of these patients present for liver transplant evaluation (1, 4, 7, 8).
Occlusive PVT also complicates the liver transplant operation and is known to be associated with a significantly higher posttransplant mortality rate (9, 10). However, little is known about the natural history of patients with chronic liver disease and PVT who are listed for transplantation. Historically, cirrhotic patients with PVT were considered to be at increased risk of death related to bleeding complications, but improvements in the prophylactic management of esophageal varices have reduced these risks (11, 12). Patients with PVT may have difficult-to-manage ascites and hepato-hydrothorax, among other complications of portal hypertension. Within this context, it seems logical that patients with cirrhosis complicated by PVT would have a higher risk of waiting list mortality, as suggested by recent results from our single-center study (13). If patients with PVT have significantly worse waiting list survival, then consideration for augmented access to transplantation would be appropriate, given the current emphasis on waiting list mortality risk. The Model for End-stage Liver Disease (MELD) score is currently the major criterion for deceased donor liver allocation. Although assignment of exception MELD score points to candidates with documented PVT seems logical, it may be appropriate to consider whether increased access to transplant should be granted to a group of patients with demonstrably inferior posttransplant outcomes. Therefore, in our current study, we compared the survival benefit of liver transplantation among patients with and without PVT by comparing posttransplant to waiting list mortality risk by PVT status. The findings of this analysis may have policy implications for patients with PVT on the liver transplant waiting list.
Methods
Data were obtained from the Scientific Registry of Transplant Recipients (SRTR) and based on patient-level data submitted by transplant centers in the United States to the Organ Procurement and Transplantation Network (OPTN). All liver transplant candidates initially wait-listed at age ≥18 years between September 2001 and December 2007 were included in the study cohort. After excluding patients for whom PVT status was missing (7.3%), the final study cohort consisted of n = 46,530 patients.
In the SRTR database, PVT status is reported at two different times. It is reported for liver transplant candidates (recorded as of the time of listing) and for transplant recipients (recorded as of the time of transplant). For the purposes of evaluating waiting list mortality, the PVT field from the candidate file was used. For analysis involving transplant recipients, the PVT field from the recipient file was used. On occasion, they PVT fields in the candidate and recipient files did not correlate (2.0% of patients). Considering it would be statistically invalid to use data from the recipient file for wait list outcome measurements, we did not specifically make adjustments when the two PVT covariates were not in agreement.
Each candidate was observed until death, censoring only for the earliest of living donor liver transplant, loss to follow-up, or the end of the observation period (December 31, 2007).
For the purposes of descriptive analysis, the study cohort of candidates was divided into two groups: liver transplant candidates with PVT (PVT candidates) and without PVT (non-PVT candidates). Univariate comparisons were made between the PVT and non-PVT groups for all candidates (Table 1). Similarly, the study cohort of recipients was divided into two groups: liver transplant recipients with PVT (PVT recipients) and without PVT (non-PVT recipients). Univariate comparisons were made between the PVT and non-PVT groups for all recipients (Table 2). For each deceased donor liver transplant, donor risk index (DRI) was computed as defined by Feng et al. (14).
Table 1.
Characteristics of Liver Transplant Candidates with and without PVT
| Candidate Characteristic | Candidate No-PVT (N = 45,573) | Candidate PVT (N = 957) | P value |
|---|---|---|---|
| Age at wait-listing (mean ± SD) | 52.5 ± 9.4 | 53.2 ± 9.5 | 0.0126 |
| Race | 0.0006 | ||
| White | 33223 (72.9%) | 707 (73.9%) | |
| African American | 3539 (7.8%) | 43 (4.5%) | |
| Asian | 1848 (4.1%) | 32 (3.3%) | |
| Hispanic | 6532 (14.3%) | 158 (16.5%) | |
| Other race | 427 (0.9%) | 17 (1.8%) | |
| MELD at listing (mean ± SD) | 17.6 ± 8.0 | 18.6 ± 8.1 | <0.0001 |
| Diagnosis | |||
| Hepatitis C | 19290 (42.3%) | 307 (32.1%) | <0.0001 |
| Hepatocellular carcinoma | 5248 (11.5%) | 97 (10.1%) | 0.184 |
| Body mass index | 27.9 ± 4.8 | 28.0 ± 5.0 | 0.3416 |
| Albumin | 3.0 ± 0.7 | 2.9 ± 0.7 | <0.0001 |
| Sodium | 136.4 ± 4.9 | 136.1 ± 5.1 | 0.0004 |
| Diabetes | 10120 (22.2%) | 268 (28.0%) | <0.0001 |
| Dialysis | 1587 (3.5%) | 33 (3.5%) | 0.2796 |
| Hospitalization status (at listing) | <0.0001 | ||
| Not hospitalized | 38341 (84.1%) | 716 (74.8%) | |
| Hospitalized not in the ICU | 4138 (9.1%) | 142 (14.8%) | |
| Hospitalized in the ICU | 1818 (4.0%) | 61 (6.4%) | |
| Percent transplanted | 22960 (50.4%) | 507 (53.0%) | 0.1117 |
Table 2.
Characteristics of Liver Transplant Recipients with and without PVT
| Recipient Characteristic | Recipient No-PVT (N = 21,394) | Recipient PVT (N = 897) | P value |
|---|---|---|---|
| Age at tx (mean ± SD) | 52.8 ± 9.5 | 54.0 ± 9.1 | 0.0002 |
| Race | 0.0012 | ||
| White | 15805 (73.9%) | 685 (76.4%) | |
| African American | 1865 (8.7%) | 46 (5.1%) | |
| Asian | 855 (4.0%) | 28 (3.1%) | |
| Hispanic | 2696 (12.6%) | 131 (14.6%) | |
| Other race | 173 (0.8%) | 7 (0.8%) | |
| MELD at transplant | 20.9 ± 9.0 | 21.8 ± 8.7 | 0.0044 |
| Donor risk index | 1.4 ± 0.4 | 1.4 ± 0.4 | 0.2516 |
| Body mass index | 27.9 ± 0.03 | 28.5 ± 0.16 | 0.0912 |
| Albumin | 3.0 ± 0.7 | 2.9 ± 0.7 | 0.0452 |
| Sodium | 135.5 ± 5.3 | 135.1± 5.2 | 0.0578 |
| Recipient ascites | 15533 (72.6%) | 691 (77.0%) | 0.0035 |
| Diabetes | 4580 (21.4%) | 234 (26.1%) | 0.0008 |
| Dialysis dependent | 1731 (8.1%) | 65 (7.3%) | 0.3625 |
| Hospitalization status | <0.0001 | ||
| Not hospitalized | 15797 (73.8%) | 608 (67.8%) | |
| Hospitalized not in ICU | 3555 (16.6%) | 174 (19.4%) | |
| Hospitalized in the ICU | 1992 (9.3%) | 115 (12.8%) | |
| Previous abdominal surgery | 9146 (42.8%) | 464 (51.7%) | <0.0001 |
| Payor (% public) | 8339 (39.0%) | 389 (43.4%) | 0.0083 |
Cox regression was used to estimate the covariate-adjusted effect of PVT on the rates of transplantation, waiting list mortality, and posttransplant mortality, with separate models fitted for each endpoint. Each model included an indicator for PVT status (1 = yes; 0 = no) and the following adjustment covariates: race, sex, age, body mass index (BMI), serum creatinine, bilirubin, international normalized ratio (INR), albumin, sodium, hepatocellular carcinoma diagnosis, etiology of liver disease, diabetes, dialysis, and previous malignancy.
For the time-to-transplant model, patients began follow-up at the date of initial placement on the waiting list and were followed until the earliest of death, transplant, loss to follow-up, or end of study. Patients receiving a living donor transplant were considered censored at the time of transplant. The model was stratified by MELD and donation service area (DSA). MELD score, creatinine, bilirubin, INR, sodium, and dialysis were coded as time-dependent covariates. Time intervals during which a patient was inactive were excluded from the analysis.
For the waiting list mortality model, follow-up was the same as in the time-to-transplant model. No covariates were time-dependent, and inactive time was included in the analysis.
To model posttransplant mortality, recipients began follow-up at the time of deceased donor liver transplantation. No covariates were time-dependent; MELD score, creatinine, bilirubin, INR, sodium, and dialysis were coded as of their final pretransplant values. In addition to the covariates listed above, the posttransplant mortality models also included the following recipient characteristics at the time of transplant: sex, age, etiology of liver disease, intensive care unit and life-support status, diagnosis of hepatocellular carcinoma, previous abdominal surgery, ascites, creatinine, albumin, year of transplant, payor status, BMI, ABO blood type compatibility, cold ischemia time, and components of the DRI, including: donor age, donor race, cause of death, donation following cardiac death status, and split liver status. Two posttransplant mortality models were fitted. In the first, the PVT hazard ratio (HR) was assumed to be constant throughout the posttransplant follow-up period. This assumption was relaxed in the second model, which allowed for distinct PVT HRs for the 0–30, 31–365 and > 365 day posttransplant time intervals. Further, within all post-transplant survival models, we investigated interactions between PVT, HCC, and clinical transplant volume (measured in quartiles).
The analysis of liver transplant benefit was carried out using sequential stratification, an extension of Cox regression for evaluating time-dependent treatments (e.g., transplantation) in the presence of time-dependent patient characteristics (e.g., MELD) (15–18).
A separate stratum was created for each deceased donor liver transplant. Each stratum included the transplant recipient and a matched set of “control” patients who, at the same number of days since listing, were active on the waiting list and had the same MELD score as the index patient at the time of transplant; were in the same age group; and were wait-listed in the same DSA as the index transplanted patient. Once entered into a stratum, matched controls were not censored by any of the following subsequent events: MELD score changes, removal from the waiting list, or subsequent receipt of a transplant. All strata were then combined, and Cox regression was used to estimate covariate-adjusted MELD × PVT status-specific HRs.
All statistical analyses were performed using SAS (v 9.3.1; SAS Institute; Cary, NC). This study was approved by the US Health Resources and Services Administration’s (HRSA) SRTR project officer. HRSA determined that this study satisfies the criteria for the institutional review board exemption described in the ‘Public Benefit and Service Program’ provisions of 45 CFR 46.101(b)(5) and HRSA Circular 03.
Results
PVT Among Wait-listed Liver Transplant Candidates
Characteristics of PVT and non-PVT candidates are presented in Table 1. The prevalence of reported PVT among 46,530 candidates wait-listed for liver transplant was 2.1% (n = 957). Liver transplant candidates with PVT were older (53.2 ± 9.5 vs. 52.5 ± 9.4, p = 0.0126), more likely to be white race (73.9% vs. 72.9 %, p = 0.0006), and had a higher mean MELD score at the time of listing (18.6 ± 0.1 vs. 17.6 ± 0.01, p < 0.0001). Candidates with PVT were less likely to have hepatitis C virus-related cirrhosis as a diagnosis (32.1% vs. 42.3%, p < 0.0001). In addition, candidates with PVT had a lower mean albumin (2.9 ± 0.07 vs. 3.0 ± 0.07, p < 0.0001), had a lower mean sodium (136.1 ± 5.1 vs. 136.4 ± 4.9, p = 0.0004), were more likely to be diabetic (28.0% vs. 22.2%, p < 0.0001), and were more likely to be hospitalized at the time of listing (21.2% vs. 13.1%, p < 0.0001).
The percentage of candidates with PVT that were transplanted (53.0%, n = 507) was not significantly different than the percentage of candidates without PVT that were transplanted (50.4%, n = 22,960). The mean time to transplant was 4.2 ± 0.8 years for PVT patients versus 4.5 ± 0.8 years for non-PVT candidates (p = 0.03). Among liver transplant candidates, a time-to-event model was created for transplant rate. Model adjustments included: age, race, MELD components, diagnosis, BMI, albumin, sodium, diabetes status, dialysis status, hospitalization status, history of previous malignancy, and PVT.
Results of the Cox regression analysis are illustrated in Figure 1. PVT was not independently associated with the covariate-adjusted liver transplant rate (HR = 1.01; p = 0.55) or waiting list mortality rate (HR = 0.90; p = 0.23); as depicted in Figure 1 (with the 95% confidence interval overlapping 1.0 in each case).
Figure 1. Covariate adjusted effect of portal vein thrombosis.
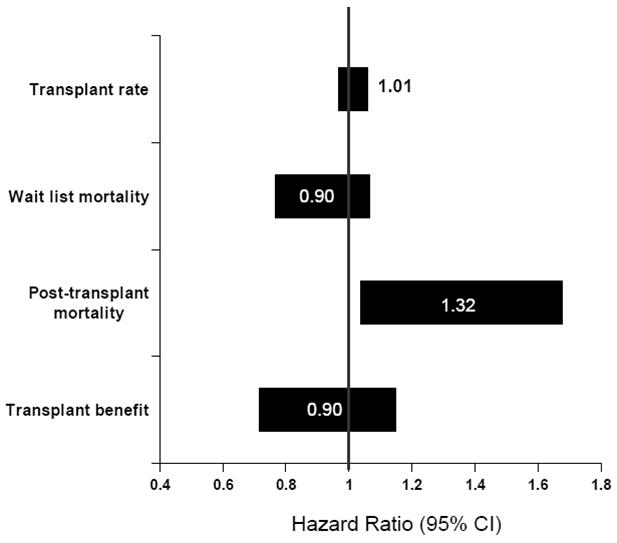
Covariate-adjusted effect in PVT on transplant rate, waiting list mortality, posttransplant mortality, and transplant benefit. A transplant benefit (HR mortality TX/WL) value of > 1 is associated with less benefit from transplantation and < 1 is associated with more benefit from transplantation compared with remaining on the liver transplant waiting list.
PVT Among Liver Transplant Recipients
The characteristics of PVT and non-PVT transplant recipients are presented in Table 2. The prevalence of reported PVT among 22,291 liver transplant recipients was 4.02% (n = 897). Liver transplant recipients reported with PVT were significantly older (54.0 ± 9.1 vs. 52.8 ± 9.5, p = 0.0002), were significantly more likely to be Caucasian (76.4% vs. 73.9%, p = 0.0012), and had significantly higher MELD at the time of liver transplant (21.8 ± 8.7 vs. 20.9 ± 9.0, p = 0.0044). There was no significant difference in the mean DRI between liver transplant recipients with and without PVT. Liver transplant recipients with PVT had significantly lower albumin (2.9 ± 0.7 vs. 3.0 ± 0.7, p = 0.0452), were more likely to have ascites (77.0% vs. 72.6%, p = 0.0035) and diabetes (26.1% vs. 21.4%, p = 0.0008). Liver transplant recipients with PVT were more likely to have been hospitalized at the time of transplant (32.2% vs. 25.9%, p < 0.0001), to have had previous abdominal surgery (51.7% vs. 42.8%, p < 0.0001), and to have had public insurance as a primary payer (43.4% vs. 39.0%, p = 0.0083).
The presence of PVT was associated with significantly higher covariate-adjusted posttransplant mortality risk (HR = 1.32; p = 0.02), as shown in Figure 1. Based on a second posttransplant model, which is described in Table 3, the presence of PVT was associated with a significantly higher adjusted posttransplant mortality only during the first year of follow-up, with HR = 1.50 (p = 0.008) from 0–30 days posttransplant, and HR = 1.52 (p = 0.0001) for days 31–365; HR = 0.94 (p = 0.73) more than one year following transplant.
Table 3.
Covariate-adjusted HR for Mortality Among Liver Transplant Recipients with PVT
| Time | Hazard Ratio | (95% CI) | P |
|---|---|---|---|
| 0–30 days | 1.50 | (1.11, 2.03) | 0.0080 |
| 31–365 days | 1.52 | (1.23, 1.87) | 0.0001 |
| > 365 days | 0.94 | (0.66, 1.35) | 0.73 |
To address the potential a clinically important issue of portal vein thrombosis in patients with a diagnosis of HCC, we investigated for potential statistical interactions between these two variables. No significant interaction was noted between PVT and HCC for any model. For example, the interaction term for PVT/HCC in a model of overall survival following liver transplantation was HR: 0.92, 95% CI 0.60–1.43, p = 0.7. Similarly, to address the potentially clinically relevant issue of transplant center clinical volume and post-transplant survival, we investigated for potential statistical interactions between center volume and survival among patients with PVT. No significant interaction was noted between PVT and center clinical volume in any post-transplant survival model.
PVT and Transplant Survival Benefit
Liver transplant survival benefit was estimated by sequential stratification and quantified by the covariate-adjusted posttransplant to waiting list mortality HR. Since it is known that the benefit of liver transplantation depends strongly on MELD, all models estimated MELD category-specific benefit HRs (17, 19).
First, we estimated the overall impact of PVT (i.e., averaged across all MELD categories) on liver transplant benefit. This was done through a model which, in addition to estimating MELD category-specific HRs, also included a transplant × PVT product term, through which the HR ‘multiplier’ associated with PVT was estimated. A PVT HR multiplier less than 1 (> 1) would indicate that PVT decreases (increases) the transplant benefit HR, which, in turn, would imply that PVT increases (decreases) transplant survival benefit. Overall, averaged across all MELD categories, transplant benefit was similar among patients with and without PVT (HR = 0.90; p = 0.21), as presented in Figure 1.
In addition to examining the overall association between PVT and liver transplant benefit, we sought to estimate the effect of PVT on benefit within MELD categories. This part of the analysis was carried out using a model with separate transplant/waiting list HRs for cross-classifications defined by PVT and MELD category. Based on this model, for patients with MELD 9–11, the posttransplant death rate was more than four times the death rate on the waiting list (HR = 4.37; p = 0.049). The difference between the PVT and non-PVT benefit HRs was non-significant for all other MELD categories (Figure 2).
Figure 2. Benefit of transplant in patients with and without PVT.
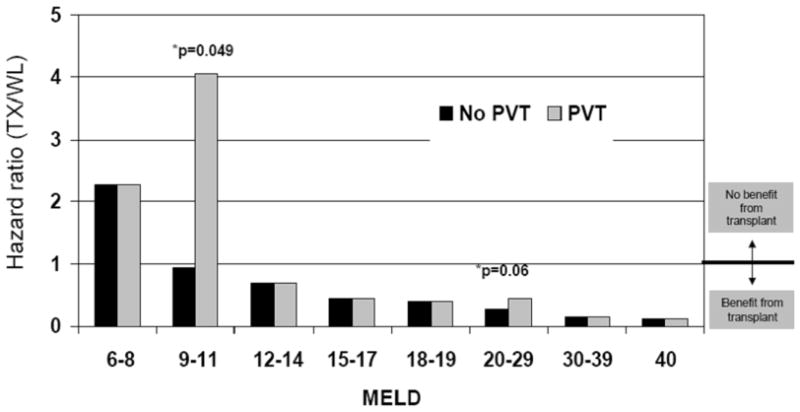
Covariate-adjusted benefit of liver of transplantation among patients with and without PVT, stratified by MELD score. Based on this model, for patients with MELD 9–11, the posttransplant death rate was more than four times the waiting list death rate (HR = 4.37; p = 0.049).
Based on Figure 2, it appears that the difference between PVT and non-PVT benefit HRs is more pronounced at low-MELD categories. However, the model described in the preceding paragraph is somewhat under-powered from at least two perspectives. First, it does not attempt to directly quantify such trends. Second, the power to detect significant PVT effects on MELD category-specific benefit is largely dictated by the category-specific number of PVT patients and number of transplants.
Therefore, we next fitted a more parsimonious model which assumed a piece-wise continuous decrease in the PVT-specific benefit HRs (estimated with linear splines). The purpose of this model was to estimate the MELD score at which the benefit HR = 1.0. Based on the results depicted in Figure 3, PVT was associated with a shift in the benefit curve. More specifically, the threshold for transplant benefit among patients without PVT was MELD > 11, while for patients with PVT, it was MELD > 13. Further, among low-MELD patients, liver transplant benefit was reduced by PVT.
Figure 3. Transplant Survival Benefit Stratified by MELD.
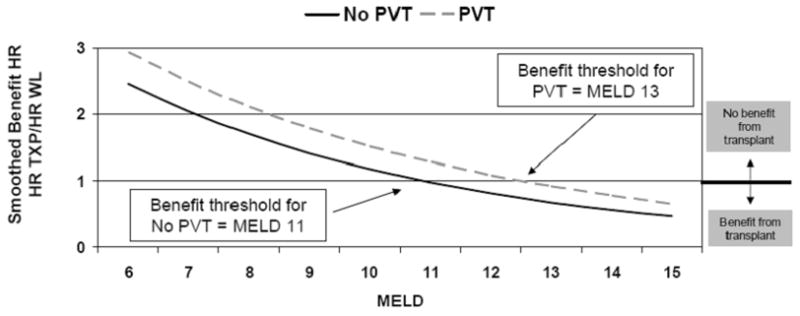
PVT is associated with a shift in the benefit curve. More specifically, the threshold for transplant benefit among patients without PVT was MELD > 11, while for patients with PVT, it was MELD > 13. Further, among low-MELD patients, liver transplant benefit was reduced by PVT.
Discussion
In this study, we assess the survival benefit of liver transplantation among patients with PVT. Compared with liver transplant candidates without PVT, candidates with PVT do not have different rates of liver transplantation or survival on the waiting list. In contrast, liver transplant recipients with PVT have significantly inferior survival. In addition, among low-MELD patients (MELD < 12), liver transplant benefit was significantly reduced by PVT, with a post-transplant mortality more than 4 times waiting list mortality. Conversely, irrespective of PVT status, patients with a MELD > 13 do benefit significantly from liver transplantation. Based on these observations, policy initiatives facilitating early access to transplantation for cirrhotic patients with PVT do not seem appropriate.
The optimal management of cirrhotic patients with PVT is not known. The presumed pathophysiologic implications of PVT include increased portal hypertension and decreased synthetic liver function related to decreased portal flow (1). Previous studies have documented inferior survival among cirrhotic patients with PVT, but these reports have not controlled for severity of illness and have been from individual centers with limited sample size (1–3, 20). Older reports documenting an increased risk of mortality with PVT from gastrointestinal bleeding may no longer be relevant considering recent advances in the endoscopic management of varices. Overall, unlike previous work, our current investigation represents a broad assessment of PVT at transplant centers across the United States in the recent era.
The timing of transplantation is central to the clinical management of patients with PVT. It seems logical to transplant PVT patients earlier (at a lower MELD), expecting that they may have a more difficult operation and also presumably a more challenging postoperative course (21). An alternative perspective is that patients with PVT should only be transplanted earlier if they have significantly higher mortality while on the waiting list. Importantly, we did not observe higher mortality among liver transplant candidates with PVT. In addition, we noted significantly less benefit of transplantation among those with low MELD scores. Thus, based on our findings, it is not advantageous to pursue early transplantation for these patients. This is an important observation which should guide the optimal management of these complex patients.
Our work shares the limitations typically associated with analyses of observational data. In studies where treatment is not randomly assigned, there is the potential that unmeasured patient characteristics may confound the results. Also, even though sophisticated methods to impute data were used, missing data affects the validity of our analysis (17). Importantly, our measure of benefit only considers patient survival and does not consider the potential implications of transplantation on quality of life. Another limitation of this analysis involves the relatively limited duration of posttransplant follow-up (median follow-up is 4.4 years). It is possible that with longer follow-up, perioperative mortality related to PVT may play less of a role than in the current study, and, as a result, cumulative posttransplant mortality may eventually be lower than that on the waiting list for low-MELD patients with PVT. However, we feel that this is unlikely, because with longer posttransplant follow-up, the impact of recurrent liver disease, renal dysfunction, and accelerated atherosclerosis may have a disproportionately adverse effect on posttransplant mortality. Patients with PVT and HCC would likely do particularly poorly, as PVT may is a marker of advanced HCC. Importantly, and very few patients with a diagnosis of HCC and PVT received transplants, and no statistical interaction was noted between PVT and HCC. Potentially, transplant centers with more experience may have significantly better posttransplant survival among their PVT patients. Surprisingly, no relationship was noted between transplant center volume and survival among liver transplant patients with PVT. Another important potential limitation of this manuscript involves the MELD calculation among patients with PVT. A portion of PVT patients may have been on warfarin therapy, and had an artificially elevated INR with resultant higher MELD score. This would potentially confound the matching methods used to calculate liver transplant survival benefit. Unfortunately, the SRTR database does not allow identification of patient on anticoagulation therapy.
The most important limitation of our investigation involves the characterization of PVT. In previous work, we assigned a specific definition to PVT to include only cases of occlusive thrombosis of the main portal vein. Such rigorous definition of PVT is not possible using OPTN data, and as a result, we are not able to confirm the reliability of the PVT data reported by transplant centers. For example, some transplant centers may report cases of non-occlusive PVT while others may limit PVT reporting to cases of occlusive PVT. Obviously, the clinical implications of occlusive versus non-occlusive PVT may be different. In an effort to assess the reliability of OPTN data on PVT, we conducted a chart review (July 2004 to December 2006) at our center of all patients transplanted (n = 233) over a 30-month period. These data were compared with our single-center SRTR data. All cases of PVT (n = 9) were correctly reported as occlusive PVT. Finally, with respect to waiting list mortality, PVT would have ideally been managed as a time-dependent covariate, but this was not possible (13). Despite these limitations, our analysis represents a much larger and more comprehensive assessment of PVT and offers unique insights into the role of liver transplantation for these patients with complex issues.
In summary, our analysis adds important information that can be used in the management of liver transplant candidates with PVT. The findings suggest that transplanting patients with a low MELD and PVT markedly increases their risk of mortality. Conversely, the most important observation from his manuscript is that the vast majority of patients with PVT significantly benefit from transplantation. Clinicians should carefully consider the risks of liver transplantation in clinically stable patients with cirrhosis and PVT, but clearly should pursue transplantation among PVT patients who are clinically unstable. Finally, early transplantation of patients with PVT (at a low MELD score) via requests for additional MELD points does not appear to be warranted.
Acknowledgments
These results were presented, in part, at the 2009 American Transplant Congress in Boston, MA. Michael J. Englesbe was supported by the National Institutes of Health – National Institute of Diabetes and Digestive and Kidney Diseases (K08 DK0827508). The Scientific Registry of Transplant Recipients is funded by contract number 234–2005-37009C from HRSA, US Department of Health and Human Services. The views expressed herein are those of the authors and not necessarily those of the US government.
Abbreviations
- PVT
portal vein thrombosis
- SRTR
Scientific Registry of Transplant Recipients
- MELD
Model for End-stage Liver Disease
- OPTN
Organ Procurement and Transplantation Network
- DRI
donor risk index
- BMI
body mass index
- INR
international normalized ratio
- DSA
donation service area
- HR
hazard ratio
- HRSA
Health Resources and Services Administration’s
References
- 1.Amitrano L, Guardascione MA, Brancaccio V, Margaglione M, Manguso F, Iannaccone L, et al. Risk factors and clinical presentation of portal vein thrombosis in patients with liver cirrhosis. J Hepatol. 2004;40(5):736–41. doi: 10.1016/j.jhep.2004.01.001. [DOI] [PubMed] [Google Scholar]
- 2.Ogren M, Bergqvist D, Bjorck M, Acosta S, Eriksson H, Sternby NH. Portal vein thrombosis: prevalence, patient characteristics and lifetime risk: a population study based on 23,796 consecutive autopsies. World J Gastroenterol. 2006;12(13):2115–9. doi: 10.3748/wjg.v12.i13.2115. [DOI] [PMC free article] [PubMed] [Google Scholar]
- 3.Janssen HL, Wijnhoud A, Haagsma EB, van Uum SH, van Nieuwkerk CM, Adang RP, et al. Extrahepatic portal vein thrombosis: aetiology and determinants of survival. Gut. 2001;49(5):720–4. doi: 10.1136/gut.49.5.720. [DOI] [PMC free article] [PubMed] [Google Scholar]
- 4.Denninger MH, Chait Y, Casadevall N, Hillaire S, Guillin MC, Bezeaud A, et al. Cause of portal or hepatic venous thrombosis in adults: the role of multiple concurrent factors. Hepatology. 2000;31(3):587–91. doi: 10.1002/hep.510310307. [DOI] [PubMed] [Google Scholar]
- 5.Goulding C, Uttenthal B, Foroni L, Duke V, Traore A, Kottaridis P, et al. The JAK2(V617F) tyrosine kinase mutation identifies clinically latent myeloproliferative disorders in patients presenting with hepatic or portal vein thrombosis. Int J Lab Hematol. 2008;30(5):415–9. doi: 10.1111/j.1751-553X.2007.00973.x. [DOI] [PubMed] [Google Scholar]
- 6.Carr BI, Buch SC, Kondragunta V, Pancoska P, Branch RA. Tumor and liver determinants of prognosis in unresectable hepatocellular carcinoma: a case cohort study. J Gastroenterol Hepatol. 2008;23(8 Pt 1):1259–66. doi: 10.1111/j.1440-1746.2008.05487.x. [DOI] [PubMed] [Google Scholar]
- 7.Molmenti EP, Roodhouse TW, Molmenti H, Jaiswal K, Jung G, Marubashi S, et al. Thrombendvenectomy for organized portal vein thrombosis at the time of liver transplantation. Ann Surg. 2002;235(2):292–6. doi: 10.1097/00000658-200202000-00019. [DOI] [PMC free article] [PubMed] [Google Scholar]
- 8.Sogaard KK, Astrup LB, Vilstrup H, Gronbaek H. Portal vein thrombosis; risk factors, clinical presentation and treatment. BMC Gastroenterol. 2007;7:34. doi: 10.1186/1471-230X-7-34. [DOI] [PMC free article] [PubMed] [Google Scholar]
- 9.Statistical model for one year patient survival following liver transplantation in the United States. 2007 [cited; Available from: www.ustransplant.org.
- 10.Rana A, Hardy MA, Halazun KJ, Woodland DC, Ratner LE, Samstein B, et al. Survival outcomes following liver transplantation (SOFT) score: a novel method to predict patient survival following liver transplantation. Am J Transplant. 2008;8(12):2537–46. doi: 10.1111/j.1600-6143.2008.02400.x. [DOI] [PubMed] [Google Scholar]
- 11.Valla DC, Condat B, Lebrec D. Spectrum of portal vein thrombosis in the West. J Gastroenterol Hepatol. 2002;17 (Suppl 3):S224–S7. doi: 10.1046/j.1440-1746.17.s3.4.x. [DOI] [PubMed] [Google Scholar]
- 12.Valla DC, Condat B. Portal vein thrombosis in adults: pathophysiology, pathogenesis and management. J Hepatol. 2000;32(5):865–71. doi: 10.1016/s0168-8278(00)80259-7. [DOI] [PubMed] [Google Scholar]
- 13.Englesbe M, Kubus J, Muhammad W, Sonnenday S, Welling T, Punch J, et al. Portal vein thrombosis and survival in patients with cirrhosis. Liver Transpl. 2009 doi: 10.1002/lt.21941. In Review. [DOI] [PubMed] [Google Scholar]
- 14.Feng S, Goodrich NP, Bragg-Gresham JL, Dykstra DM, Punch JD, DebRoy MA, et al. Characteristics associated with liver graft failure: the concept of a donor risk index. Am J Transplant. 2006;6(4):783–90. doi: 10.1111/j.1600-6143.2006.01242.x. [DOI] [PubMed] [Google Scholar]
- 15.Schaubel D, Wolfe R, Sima C, Merion R. Estimating the effect of a time-dependent treatment by levels of an internal time-dependent covariate: Application to the contrast between liver wait-list and posttransplant mortality. JASA. 2009;104(485):49–59. [Google Scholar]
- 16.Schaubel DE, Wolfe RA, Port FK. A sequential stratification method for estimating the effect of a time-dependent experimental treatment in observational studies. Biometrics. 2006;62(3):910–7. doi: 10.1111/j.1541-0420.2006.00527.x. [DOI] [PubMed] [Google Scholar]
- 17.Schaubel DE, Sima CS, Goodrich NP, Feng S, Merion RM. The survival benefit of deceased donor liver transplantation as a function of candidate disease severity and donor quality. Am J Transplant. 2008;8(2):419–25. doi: 10.1111/j.1600-6143.2007.02086.x. [DOI] [PubMed] [Google Scholar]
- 18.Schaubel DE, Guidinger MK, Biggins SW, Kalbfleisch JD, Pomfret EA, Sharma P, et al. Survival benefit-based deceased-donor liver allocation. Am J Transplant. 2009;9(4 Pt 2):970–81. doi: 10.1111/j.1600-6143.2009.02571.x. [DOI] [PMC free article] [PubMed] [Google Scholar]
- 19.Merion RM, Schaubel DE, Dykstra DM, Freeman RB, Port FK, Wolfe RA. The survival benefit of liver transplantation. Am J Transplant. 2005;5(2):307–13. doi: 10.1111/j.1600-6143.2004.00703.x. [DOI] [PubMed] [Google Scholar]
- 20.Gayowski TJ, Marino IR, Doyle HR, Echeverri L, Mieles L, Todo S, et al. A high incidence of native portal vein thrombosis in veterans undergoing liver transplantation. J Surg Res. 1996;60(2):333–8. doi: 10.1006/jsre.1996.0053. [DOI] [PMC free article] [PubMed] [Google Scholar]
- 21.Selvaggi G, Weppler D, Nishida S, Moon J, Levi D, Kato T, et al. Ten-year experience in porto-caval hemitransposition for liver transplantation in the presence of portal vein thrombosis. Am J Transplant. 2007;7(2):454–60. doi: 10.1111/j.1600-6143.2006.01649.x. [DOI] [PubMed] [Google Scholar]