

Abstract
Purpose
To investigate the utility of ultra-short echo time (UTE) sequence as pulmonary magnetic resonance imaging (MRI) to detect non-uniform disruption of lung architecture that is typical of emphysema.
Materials and Methods
MRI of the lungs was conducted with a three dimensional UTE sequence in transgenic mice with severe emphysema and their wild type littermates in a 3 T clinical MR system. Measurements of the signal intensity (SI) and transverse relaxation time (T2*) of the lung parenchyma were performed with various echo times (TEs) ranging from 100 μsec to 2 msec.
Results
Much higher SI of the lung parenchyma was observed at an UTE of 100 μsec compared to longer TEs. The emphysematous lungs had reduced SIs and T2* than the controls, in particular at end-expiratory phase. The results suggested that both SI and T2* in lung parenchyma measured with the method represent fractional volume of lung tissue.
Conclusion
The UTE imaging provided MR signal from the lung parenchyma. Moreover, the UTE sequence was sensitive to emphysematous changes and may provide a direct assessment of lung parenchyma. UTE imaging has the potential to assist detection of localized pathological destruction of lung tissue architecture in emphysema.
Keywords: ultrashort echo time, pulmonary MRI, emphysema, klotho mice
Introduction
Emphysema results from proteolytic destruction of the alveolar architecture resulting in loss of gas exchange tissue and permanently enlarged airspaces without obvious fibrosis, leading to nonuniform regional perturbation of morphological structure (1–3). Pulmonary function tests (PFTs), which measure whole lung function, have been widely accepted for the evaluation of pulmonary diseases. However, these tests have a wide range of normal values and the correlation with the pathologic severity of pulmonary disorders is relatively weak (1). These limitations are not surprising since contributions from regions of normal and varying degrees of abnormal function are combined in global measurements. Consequently, localized and early pathologic changes may not be detected by currently available PFTs. A key challenge in lung disease is the development of multi-variate noninvasive methods to assess disease parameters that predict clinical outcome and response to therapy (4).
High-resolution computed tomography (HRCT) is the standard imaging technique for assessing lung anatomy (5). It provides excellent anatomic detail for the detection and characterization of pulmonary emphysema (6,7). Increases in the low attenuation areas of HRCT images in patients with pulmonary disease have been reported to reflect the development of pathological emphysema (8). Technical developments in CT scanners have enabled larger volume coverage with higher resolution and lower noise; however, these advantages have also led to increased radiation exposure (9), a concern that has drawn wide attention (10).
Relationships between the tissue anatomy (density and air-tissue interface) and the NMR-derived parameters such as transverse relaxation times (T2*), magnitude of signal intensity (SI), and shapes of the NMR spectra have been well investigated ex-vivo in the excised rodent lungs since the early 1980s (11–15). The authors reported that the lung has very short T2* (12), its SI relates to the tissue density (14), and the spectral shape reflects underlying lung geometry (13). Beside the very short T2*, in vivo Magnetic resonance imaging (MRI) of the lung is challenging because of other fundamental difficulties associated with properties of the organ, including low proton density, and respiratory and cardiac motion artifacts (16,17). However, the development of more powerful hardware has been overcoming the issues (18,19). A gradient echo sequence and a single-shot fast spin echo sequence with reduced echo time (TE) can together provide a platform for MRI of the lung (20,21). Bankier et al. demonstrated that the gravity-dependent gradients of MR signals changed in different postures, in which the signal represented the parenchymal tissue/blood density (22). Recently, Failo et al. showed the correlation in the diagnostic quality between MRI with ‘very-short’ TE and CT in patients with cystic fibrosis (23). These studies clearly demonstrated that the potential to evaluate the lung parenchymal tissues increases as TE becomes shorter.
The utility of ultra-short TE (UTE) MRI in conjunction with projection acquisition of the free inducting decay (FID) allows us to reduce TE to less than 100 μsec to minimize signal decay caused by short transverse relaxation time (T2*). It brings higher MR signals from tissues which have short T2* and thus are unobservable in conventional methods with short TE (c.a. 2 msec). On the subtraction image between the images with an UTE (c.a. ~500 μsec) and a conventional range of TEs, the biological materials/tissues, such as tendon, bone or periostea are enhanced (24–26). Bergin et al. described UTE imaging with projection reconstruction for imaging human lungs (27) and demonstrated much higher signal intensity (SI) in the lung parenchyma and finer pulmonary structures. Using cardiac and respiratory gating, Gewalt et al. showed excellent UTE images of the lung in normal rats using a small animal imaging system (24). Kuethe et al. reported the ultra-high quality UTE images of the normal rat lung in vivo that resolve the thin membranes that separate lung lobes (28). Another study using a single point imaging method that could achieve an ultra-short TE (200 μs) demonstrated lower MR signal and shorter T2* in a mouse model of emphysema than those in the control (29). However, utilization of UTE MRI for lung imaging is still sparse in these days.
In this study we tested the hypothesis that SI of the lung parenchyma obtained using the UTE sequence represents lung tissue density, including static water and blood flow. We examined a transgenic mouse model of pulmonary emphysema compared to normal animals to investigate the primary source of the MR signal in the lung obtained by UTE method in a 3 T clinical MRI system.
Material and Methods
Overall Study Design
The protocols in this study were approved by the Institutional Animal Care and Use Committee. The homozygous mutant klotho mouse has a defect in klotho gene expression, and shows characteristic aging-like phenotypes including growth retardation and severe pulmonary emphysema (30,31). We used 5–6 week old klotho mice (n = 8, 8.3 ± 1.4 g b.w.) and their wild type littermates (n = 8, WT: 19.7 ± 2.0 g b.w.). A preliminary series of experiments was designed to investigate the feasibility of the UTE sequence and to optimize the imaging and analytical methods (Experiment I). These exploratory experiments then served to establish the experimental conditions in the subsequent detailed studies (Experiment II). All MRI was conducted using a 3 T whole-body MRI system (Achieva™, Philips Medical Systems, Best, Netherlands) with a small animal solenoid RF coil (63 mm in diameter and 100 mm in length; Philips Research Laboratories, Hamburg, Germany).
Experiment I
Under anesthesia with 1.5–2% isoflurane (IsoFlo®, Abbot Laboratories, North Chicago, IL) mixed in 100% oxygen, all animals (n = 3 per group) were placed supine with the thorax centered with respect to the center of the radio-frequency (RF) coil. For the purpose of reproducible positioning of the imaging region, low-resolution multi-slice images were first acquired of the entire lung in both the transverse and coronal planes using a fast spin echo sequence. Based on the results, a volume of interest (VOI) was positioned to encompass the entire lung at end-inspiratory phase. On the selected VOI, a non-gated three dimensional (3D) radial UTE sequence (32,33) was performed repeatedly with various TEs (0.11, 0.2, 0.3, 0.4, 0.5, 0.6, 0.7, 0.8, 1, 1.5, 2, 2.5, 3, 3.5 msec) in fixed scale of receiver gain. Total number of radials were 18496 with the profiles distributed isotropically over a sphere (“Koosh ball”). Each spoke was acquired in two acquisitions using center-out readout (33,34). For reconstruction, before Fourier transformation, the acquired data were resampled to a Cartesian grid using a k-space trajectory that accounts for gradient eddy current effects (35). The acquisition-window duration was 1.3 msec. The other imaging parameters were: 12 msec repetition time (TR), 10° flip angle, 53 cm field of view (FOV), 1443 matrix (isotropic), 1553.3 Hz spectral bandwidth, 2 number of excitation (NEX), and 3 m 15 s total scan time
Experiment II
Under anesthesia as described in Experiment I, a 1 cm 20-gauge nonmetallic endotracheal tube was placed via a tracheostomy. The cannulated animal (n = 5 per group) was then connected to a small animal ventilator (flexiVent, SCIREQ, Quebec, Canada) with a ~3 m tube in the supine position for MRI. To avoid the effect on either intraperitoneal or intrapulmonary pressure due to attachment of a respiratory sensor on the body, the tube was also connected to the pressure transducer of the MR system via a bifurcation for respiratory gating. A phantom containing 25 mmol/L gadolinium (Omniscan™, GE Healthcare, Princeton, NJ) was located next to the animal as a reference for SI. The animal was mechanically ventilated at approximately 28 breaths/min in which the durations of inhalation and exhalation were set as 1 and 1.2 sec, respectively. Usually, ‘tidal volume’ is set for small animal ventilation, however, the dead volume in the connecting tube is critically large relative to the lung volume in mice. Thus, we set the intrapulmonary pressure at end-inspiration to 17 cmH2O where the lungs at end-expiration (atmospheric pressure) were inflated until the intrapulmonary pressure became 17 cmH2O and held for 1 sec, then quickly exhaled back to end-expiration. On a VOI encompassing the entire lung, respiratory-gated UTE imaging was repeated with five different TEs (0.1, 0.3, 0.5, 0.8, 1.2 msec) at each end-expiration and end-inspiration. The same k-space trajectory as Experiment I was used. The acquisition-window duration was 1.3 msec. The other imaging parameters were: 12 msec TR, 10° flip angle, 43 cm FOV, 1443 matrix, 776.2 Hz spectral bandwidth, 2 NEX and 6 m 19 s total scan time
Image Analysis
To measure SI in Experiment I, four different circular regions of interest (ROIs, size = 2.5 mm2) were selected, taking care to avoid main pulmonary vessels, in the right lower pulmonary parenchyma on a resliced axial image (0.35 mm thickness, 12 regions total per group). SI was also analyzed in air to provide an estimate of noise in each image. T2* was calculated in each ROI in the slope of the logarithm of the noise-corrected SIs (36) versus the TEs.
In Experiment II, we first evaluated whether there was location difference in SI within the lung in all WT mice. For this purpose, we measured the length of each right and left lung in the cephalo-caudal axis on the obtained 3D image, then resliced axial images (0.28 mm thickness) were selected at every 20% location from the apex (20, 40, 60, and 80% location for each lung) as shown in Figure3a to measure SI and T2* on four circular ROIs, two for each right and left lung (size = 2.5 mm2, Fig 4). All SIs were normalized to the SI of the phantom. According to the result of this analysis, we compared the SI and T2* of the pulmonary parenchyma between the groups at a corresponding location in each respiratory phase.
Figure 3.
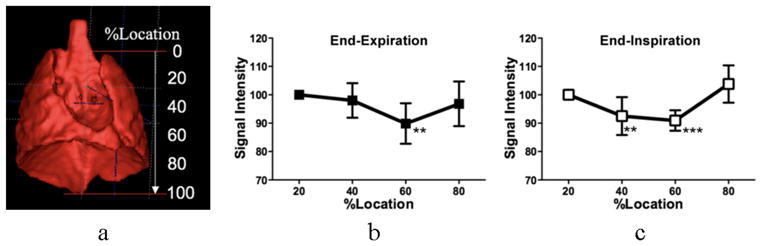
Typical volume rendering image of a thoracic cavity in a mouse indicating locations of the SI measurement (a), which was generated from a three dimensional UTE image. Location difference in SI of the lung parenchyma in the WT group at end-expiratory (b) and end-inspiratory (c) phases are shown. Data are expressed as averaged changes between right and left lungs relative to 20% location (from apex) in each respiration and represent mean ± standard deviation. ** P < 0.01; *** P < 0.001 by the Dannett multi-comparison test following ANOVA.
Figure 4.
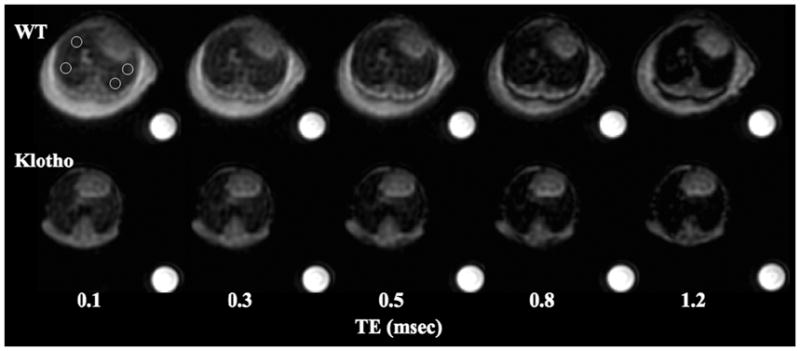
Series of axial resliced UTE images (0.28 mm thickness) of the lungs in the wild-type (WT) and klotho mice against various TEs. The images were obtained at 60% location from the apex at end-expiratory phase with respiratory gating showing SI decay of the parenchyma as TE becomes longer. The SI in the klotho mouse is lower at any given TEs. The phantom is 25 mmol/L Gd solution.
Histology
Following euthanasia by overdosing of the anesthesia, after the MR session, the lungs were allowed to collapse and were then re-inflated within the intact chest by tracheal instillation of 10% phosphate buffered formaldehyde under a constant hydrostatic pressure of 20 cmH2O and the tracheal cannula was clamped to maintain airway pressure (37). After a 60–100 min fixation in situ, the lungs were removed and immersed in 10% formaldehyde overnight, then in phosphate buffered saline for 2–3 days prior to further processing. Lung specimens were taken from regions in which the SI was measured, sectioned and stained with hematoxylin/eosine for microscopic examination.
Statistical Analysis
All values were expressed as mean ± standard deviation (SD). In Experiment I, a Student’s t-test was used to compare SI and T2* between the WT and klotho groups. In Experiment II, differences in the SI among the four locations were tested using a two-tailed analysis of variance (ANOVA) with Dunnett multiple-comparison test where the SI at 20% location was control. For the comparison of these parameters between the groups, two-tailed ANOVA with Tukey-Kramer multiple-comparison test was used. All statistical analyses were done by using commercial software (Prism™ 5.0, GraphPad Software, Inc., San Diego, CA).
Results
Experiment I
Figure 1a demonstrates typical UTE images of the lungs in the WT and klotho mice at two different TEs, one at an ultra-short (110 μsec) and another at a conventional range (2.2 msec). It is important to note that the images were not degraded by obvious motion artifact although neither cardiac nor respiratory gating was implemented. More SI was provided from pulmonary parenchyma as the TE was shortened in all animals. The lungs were darker in the klotho mice than the WT mice at any given TE. The SIs measured at multiple points within less than 1 msec showed the good exponential fitting (R2 < 0.9) at all ROIs from TE of 110 μsec to 2 msec (WT) or 1 msec (klotho), respectively (Fig. 1b). The T2* (msec) of the lung in the klotho mice were lower (0.70 ± 0.07, P < 0.001) compared with that in the WT (1.16 ± 0.15) in the non-gating UTE imaging.
Figure 1.
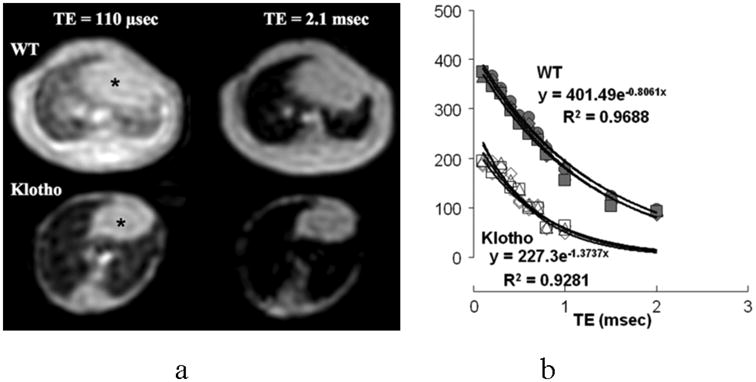
(a) Typical UTE images of the lung in the wild-type (WT) and klotho mice at two different TEs, one at an ultra-short (110 μsec) and another at a conventional range (2.2 msec). Both animals were imaged simultaneously. Note that the images are ‘motion insensitive’ although no gating was implemented. * heart.
(b) T2* decay curves of SIs in the lung parenchyma in the WT and klotho mice. Fitting equation and R2 value are indicated in one out of three animals in each group. The SIs could be measured at multiple points less than 1 msec, which shows excellent exponential decays. The klotho mice demonstrate lower SIs at any given TEs and reduced T2* compared to those in the WT mice.
Experiment II
Figure 2 demonstrates the representative resliced coronal images (0.28 mm thickness) with TE of 100 μsec and 1.2 msec at end-expiratory and end-inspiratory phases in a WT mouse. It shows higher SI at end-expiratory phase than at end-inspiratory phase at any given TEs. The map of SI change between the two TEs evidences that the SI of the lung parenchyma increased approximately 5 to 6 times. However, the SIs in the surrounding tissues such as the liver, skeletal muscle and myocardium increased less than 2 times in each respiratory phase.
Figure 2.
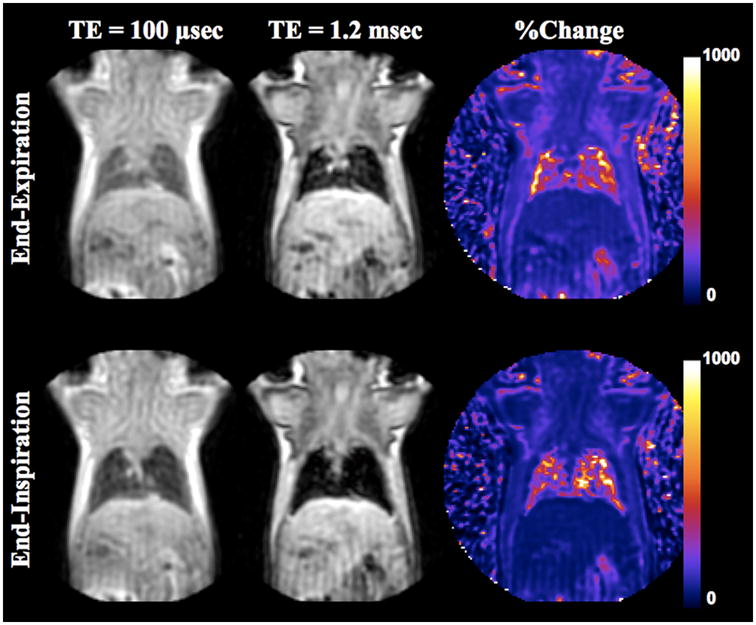
Coronal resliced UTE images (0.28 mm thickness) of a WT mouse at end-expiratory and end-inspiratory phases with the TE of 100 μsec and 1.2 msec. The images were obtained with respiratory gating. The lung appeared larger and darker at end-inspiratory phase than at end-expiratory phase. The %change maps in the SI exhibit 5–6 times increase in the lung parenchyma, which is much higher than that observed in the surrounding tissues (approximately ~2–3 times).
Figure 3 exhibits the relative SIs at different locations within the lung to that at 20% location from apex. Since there was no marked difference between right and left lungs and we could not observe gravitational change in such a small lung, we averaged out four SIs on a slab. It was found to be lower at 60% location (P < 0.01) at end-expiratory phase and 40% (P < 0.01) and 60% (P < 0.001) locations at end-inspiratory phase. This prominent change at end-inspiration might indicate that the lung inflated more at these locations. Therefore, the further comparisons of SI and T2* between the WT and klotho groups were performed at 60% location.
Typical resliced axial images (0.28 mm thickness) at 60% location in a WT showed higher SI than in a klotho at any given TEs from 100 μsec to 1.2 msec (Fig. 4). At TE of 100 μsec, the SI of the parenchyma was higher at end-expiratory phase than that at end-inspiratory phase (P < 0.01, Fig. 5a) in the WT group. Further, it was lower in klotho mice compare to WT mice at end-expiratory (P < 0.005). The signal decays against six TEs at both expiratory phases exhibited better exponential fit (R2: 0.98 ± 0.02) than those in Experiment I. In the WT group, the T2* (msec) was higher at end-expiratory phase (1.00± 0.13, P < 0.05, Fig. 5b) than end-inspiratory phase (0.79± 0.09) while there were no significant differences between the respiratory phases in the klotho group (0.73 ± 0.07 and 0.66 ± 0.06). Moreover, the T2* of parenchyma from klotho mice was 27% reduced (P < 0.001) compared with that in the WT mice at end-expiratory phase.
Figure 5.
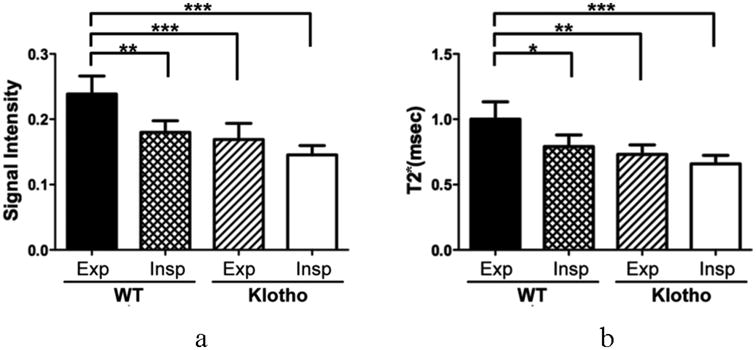
Corrected SI at the TE of 100 μsec (relative to the phantom; a) and T2* (b) at end-expiratory and end-inspiratory phases in the WT and klotho groups. Both values are lower at end-inspiratory phase in the WT. The klotho mice revealed reduced SI (P < 0.001) and T2* (P < 0.01) compared to those in the WT mice. Data are expressed as mean ± SD. * P < 0.05; ** P < 0.01; *** P < 0.001 by the Tukey multi-comparison test following ANOVA.
Histology
Figure 6 demonstrates representative histological sections of the lung parenchyma in a WT mouse and a klotho mouse that were imaged by the UTE imaging. The substantial enlargement of alveolar spaces was observed diffusely in the entire lung in all klotho mice while there was no comparable pathologic change in all WT mice, which were consistent with previous reports (31,38,39).
Figure 6.
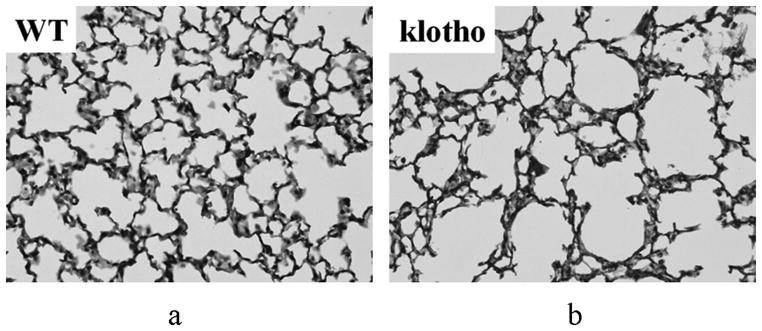
Micrographic histological images of the lung parenchyma in a WT (a) and klotho (b) mice (hematoxylin/eosine; original magnification ×400). The klotho mice exhibited larger air spaces with fewer alveolar walls, and smaller exponents in the shape and size distribution of the air spaces in the entire lobes.
Discussion
The pulmonary parenchyma has low tissue density and short T2* and is therefore usually not visible on conventional MR images (40). We applied an UTE sequence for imaging of normal and emphysematous lungs in mice in a 3T clinical MRI system. Using ultra-short TEs (< c.a. 500 μsec), we could obtain much more inherent MR signal from the lung parenchyma. The SI and T2* were higher at end-expiratory phase than those at end-inspiratory phase. Further, these values were reduced in the emphysematous lungs than those in the normal lungs at end-expiratory phase. Low SI and T2* in emphysema are thought to reflect alveolar airspace enlargement, which leads lower tissue volume fraction and increase of producing susceptibility effect in the lung.
The sequence we used applies a non-selective RF block pulse for excitation and a 3D radial FID readout for signal reception (32,33). The signal is acquired using a center-out sampling scheme, which corresponds to sampling the FID. All obtained images appeared “motion insensitive”, thanks to the trajectory through k-space in which the FID is sampled from the center of the k-space, the so called kooshball trajectory (33), and thus the centre of k-space is heavily oversampled (41,42). The MR signal of the lung parenchyma showed precise exponential decay in all animals against the TEs. The result implies that use of UTE is critical for accurate T2* measurement of the tissues specially having such a low range of T2*s (> c.a. 1 msec), which might provide more sensitive detection in case of, i.e. pathologic change.
When the lung is inflated, the elastic interstitial tissue within the alveolar walls and around the blood vessels and bronchi are stretched. Subsequently the perimeter of interstitial tissue increases and the tissue volume fraction decreases (43). In Experiment II, we used a PC-controllable small animal ventilator to adjust the respiratory frequency and the intrapulmonary pressure at peak inspiration. Our result showed that the SI and T2* at end-expiratory phase were approximately 30% higher than those at end-inspiratory phase in the normal lung, and thus indicated that the UTE imaging detected the tidal change in lung tissues even under non-pathologic condition. Although we could see the differences between the normal and emphysematous lungs, the SI/T2* measured with non-gated imaging (Experiment I) must be averaged out over the entire respiratory cycle. In addition, motion might have exaggerated signal decay although the motion was not obvious on the images. Therefore it is important to pay attention on respiratory conditions, which may be difficult to control in future human subjects.
The result suggested that the SI of the lung parenchyma on the UTE images is determined by at least two factors; 1) total interstitial tissues including blood in an unit lung volume (tissue density), and 2) T2* which relates to susceptibility effect arising from the massive interface between interstitial tissue and alveoli airspace in the lung. Blood oxygenation level dependent (BOLD) effect may also influence SI although it is trivial under the ventilated respiration with 100% oxygen as used in the present study.
Compared to normal lung, the emphysematous lung exhibited 29% reduced SI and 27 % lower T2* at end-expiratory phase. Both values also tended to be lower in the emphysema at end-inspiratory phase (19% and 17%, n.s.); however, the differences between the groups were greater at end-expiratory phase. Our result is consistent with previous reports in CT studies of patients with parenchymal disease that the measurements of lung attenuation better discriminate lesions and correlate with pulmonary function at end-expiration (44,45).
In emphysema, regional pathological changes induce regional variations in airflow and acinar emptying rates, leading to non-uniform attenuation on CT images (8,46). Although we did not quantify the histology, the klotho mice exhibited larger air spaces with fewer alveolar walls in the entire lobes. Previous literature using quantitative morphological analyses revealed that the architectural changes of pulmonary tissue observed in the klotho mice resemble those in patients with emphysema (38); it was reported that mean linear intercepts were approximately 16% higher in klotho mice (88 μm) compared to WT controls (76 μm). Hence, the changes in SI and T2* (27 ~ 32%) observed in the klotho mice were relevant to the result, therefore our method may suffice to detect such an architectural change. These results imply that UTE imaging may provide clinical implications to evaluate lung tissue architecture, and this potential needs to be further evaluated in direct comparison between the SI/T2* and structural quantitation of the lung parenchyma. Since emphysema is a progressive disorder with fluctuating symptoms, it would be valuable to objectively monitor lung structure using this or a related method as the parenchyma responds to interventions. Further evaluations are needed to establish a diagnostic value (sensitivity and specificity) of the method in various pulmonary diseases.
In conclusion, UTE imaging in conjunction with projection acquisition of the FID was feasible and provided higher SI in murine lung parenchyma than conventional proton MRI methods. The method could detect changes in fractional lung tissue and blood volume during mechanical ventilation and in one pathological condition. The same UTE sequence should prove feasible for imaging of human lungs as we conducted the current study using a 3T clinical MRI system. Using UTE imaging, the direct observation of the MR signal and quantitation of the short T2* component in the lung parenchyma would have the potential to assess interstitial tissues density/volume. The method can be a new diagnostic tool for the detection and characterization of non-uniform disruption of lung architecture as the low attenuation areas on CT images but without incurring the risks of radiation exposure.
Acknowledgments
This research was partly supported by National Institutes of Health Grant R01 AG19712.
References
- 1.Clausen JL. The diagnosis of emphysema, chronic bronchitis, and asthma. Clin Chest Med. 1990;11(3):405–416. [PubMed] [Google Scholar]
- 2.Pare PD, Brooks LA, Bates J, Lawson LM, Nelems JM, Wright JL, Hogg JC. Exponential analysis of the lung pressure-volume curve as a predictor of pulmonary emphysema. Am Rev Respir Dis. 1982;126(1):54–61. doi: 10.1164/arrd.1982.126.1.54. [DOI] [PubMed] [Google Scholar]
- 3.Petty TL, Silvers GW, Stanford RE. Mild emphysema is associated with reduced elastic recoil and increased lung size but not with air-flow limitation. Am Rev Respir Dis. 1987;136(4):867–871. doi: 10.1164/ajrccm/136.4.867. [DOI] [PubMed] [Google Scholar]
- 4.Croxton TL, Weinmann GG, Senior RM, Wise RA, Crapo JD, Buist AS. NHLBI Workshop Summary. Am J Respir Crit Care Med. 2003;(167):1142–1149. doi: 10.1164/rccm.200207-756WS. [DOI] [PubMed] [Google Scholar]
- 5.Hansell DM. High-resolution computed tomography in the evaluation of fibrosing alveolitis. Clin Chest Med. 1999;20(4):739–760. viii. doi: 10.1016/s0272-5231(05)70253-7. [DOI] [PubMed] [Google Scholar]
- 6.Kazerooni EA. Radiologic evaluation of emphysema for lung volume reduction surgery. Clin Chest Med. 1999;20(4):845–861. doi: 10.1016/s0272-5231(05)70258-6. [DOI] [PubMed] [Google Scholar]
- 7.Muller NL, Staples CA, Miller RR, Abboud RT. “Density mask”. An objective method to quantitate emphysema using computed tomography. Chest. 1988;94(4):782–787. doi: 10.1378/chest.94.4.782. [DOI] [PubMed] [Google Scholar]
- 8.Hoffman EA, Reinhardt JM, Sonka M, Simon BA, Guo J, Saba O, Chon D, Samrah S, Shikata H, Tschirren J, Palagyi K, Beck KC, McLennan G. Characterization of the interstitial lung diseases via density-based and texture-based analysis of computed tomography images of lung structure and function. Acad Radiol. 2003;10(10):1104–1118. doi: 10.1016/s1076-6332(03)00330-1. [DOI] [PubMed] [Google Scholar]
- 9.Maher MM, Kalra MK, Toth TL, Wittram C, Saini S, Shepard J. Application of rational practice and technical advances for optimizing radiation dose for chest CT. J Thorac Imaging. 2004;19(1):16–23. doi: 10.1097/00005382-200401000-00003. [DOI] [PubMed] [Google Scholar]
- 10.Kubo T, Lin PJ, Stiller W, Takahashi M, Kauczor HU, Ohno Y, Hatabu H. Radiation dose reduction in chest CT: a review. AJR Am J Roentgenol. 2008;190(2):335–343. doi: 10.2214/AJR.07.2556. [DOI] [PubMed] [Google Scholar]
- 11.Hayes CE, Case TA, Ailion DC, Morris AH, Cutillo A, Blackburn CW, Durney CH, Johnson SA. Lung water quantitation by nuclear magnetic resonance imaging. Science. 1982;216(4552):1313–1315. doi: 10.1126/science.7079763. [DOI] [PubMed] [Google Scholar]
- 12.Kveder M, Zupancic I, Lahajnar G, Blinc R, Suput D, Ailion DC, Ganesan K, Goodrich C. Water proton NMR relaxation mechanisms in lung tissue. Magn Reson Med. 1988;7(4):432–441. doi: 10.1002/mrm.1910070406. [DOI] [PubMed] [Google Scholar]
- 13.Christman RA, Ailion DC, Case TA, Durney CH, Cutillo AG, Shioya S, Goodrich KC, Morris AH. Comparison of calculated and experimental NMR spectral broadening for lung tissue. Magn Reson Med. 1996;35(1):6–13. doi: 10.1002/mrm.1910350103. [DOI] [PubMed] [Google Scholar]
- 14.Cutillo AG, Goodrich KC, Ganesan K, Watanabe S, Ailion DC, Albertine KH, Morris AH, Durney CH. Lung water measurement by nuclear magnetic resonance: correlation with morphometry. J Appl Physiol. 1995;79(6):2163–2168. doi: 10.1152/jappl.1995.79.6.2163. [DOI] [PubMed] [Google Scholar]
- 15.Case TA, Durney CH, Ailion DC, Cutillo AG, Morris AH. A Mathematical Model of Diamagnetic Line Broadening in Lung Tissue and Similar Heterogeneous Systems: Calculations and Measurements. J Magn Reson. 1987;73:304–314. [Google Scholar]
- 16.Alsop DC, Hatabu H, Bonnet M, Listerud J, Gefter W. Multi-slice, breathhold imaging of the lung with submillisecond echo times. Magn Reson Med. 1995;33(5):678–682. doi: 10.1002/mrm.1910330513. [DOI] [PubMed] [Google Scholar]
- 17.Hatabu H, Chen Q, Stock KW, Gefter WB, Itoh H. Fast magnetic resonance imaging of the lung. Eur J Radiol. 1999;29(2):114–132. doi: 10.1016/s0720-048x(98)00174-0. [DOI] [PubMed] [Google Scholar]
- 18.Takahashi M, Kubo S, Kiryu S, Gee J, Hatabu H. MR microscopy of the lung in small rodents. Eur J Radiol. 2007;64(3):367–374. doi: 10.1016/j.ejrad.2007.08.011. [DOI] [PubMed] [Google Scholar]
- 19.Quintana HK, Cannet C, Zurbruegg S, Ble FX, Fozard JR, Page CP, Beckmann N. Proton MRI as a noninvasive tool to assess elastase-induced lung damage in spontaneously breathing rats. Magn Reson Med. 2006;56(6):1242–1250. doi: 10.1002/mrm.21051. [DOI] [PubMed] [Google Scholar]
- 20.Amundsen T, Kvaerness J, Jones RA, Waage A, Bjermer L, Nilsen G, Haraldseth O. Pulmonary embolism: detection with MR perfusion imaging of lung--a feasibility study. Radiology. 1997;203(1):181–185. doi: 10.1148/radiology.203.1.9122390. [DOI] [PubMed] [Google Scholar]
- 21.Berthezene Y, Croisille P, Bertocchi M, Houzard C, Bendib K, Revel D. Lung perfusion demonstrated by contrast-enhanced dynamic magnetic resonance imaging. Application to unilateral lung transplantation. Invest Radiol. 1997;32(6):351–356. doi: 10.1097/00004424-199706000-00006. [DOI] [PubMed] [Google Scholar]
- 22.Bankier AA, Storey P, Mai VM, Edelman RR, Chen Q. Gravity-dependent signal gradients on MR images of the lung in supine and prone positions: a comparison with isogravitational signal variability. J Magn Reson Imaging. 2006;23(2):115–122. doi: 10.1002/jmri.20478. [DOI] [PubMed] [Google Scholar]
- 23.Failo R, Wielopolski PA, Tiddens HA, Hop WC, Mucelli RP, Lequin MH. Lung morphology assessment using MRI: a robust ultra-short TR/TE 2D steady state free precession sequence used in cystic fibrosis patients. Magn Reson Med. 2009;61(2):299–306. doi: 10.1002/mrm.21841. [DOI] [PubMed] [Google Scholar]
- 24.Gewalt SL, Glover GH, Hedlund LW, Cofer GP, MacFall JR, Johnson GA. MR microscopy of the rat lung using projection reconstruction. Magn Reson Med. 1993;29(1):99–106. doi: 10.1002/mrm.1910290117. [DOI] [PubMed] [Google Scholar]
- 25.Reichert IL, Benjamin M, Gatehouse PD, Chappell KE, Holmes J, He T, Bydder GM. Magnetic resonance imaging of periosteum with ultrashort TE pulse sequences. J Magn Reson Imaging. 2004;19(1):99–107. doi: 10.1002/jmri.10432. [DOI] [PubMed] [Google Scholar]
- 26.Helmes JE, Bydder GM. MR imaging with ultrashort TE (UTE) pulse sequences: Basic principles. Radiography. 2005;11:163–174. [Google Scholar]
- 27.Bergin CJ, Pauly JM, Macovski A. Lung parenchyma: projection reconstruction MR imaging. Radiology. 1991;179(3):777–781. doi: 10.1148/radiology.179.3.2027991. [DOI] [PubMed] [Google Scholar]
- 28.Kuethe DO, Adolphi NL, Fukushima E. Short data-acquisition times improve projection images of lung tissue. Magn Reson Med. 2007;57(6):1058–1064. doi: 10.1002/mrm.21230. [DOI] [PubMed] [Google Scholar]
- 29.Olsson LE, Lindahl M, Onnervik PO, Johansson LB, Palmer M, Reimer MK, Hultin L, Hockings PD. Measurement of MR signal and T2* in lung to characterize a tight skin mouse model of emphysema using single-point imaging. J Magn Reson Imaging. 2007;25(3):488–494. doi: 10.1002/jmri.20840. [DOI] [PubMed] [Google Scholar]
- 30.Kuro-o M, Matsumura Y, Aizawa H, Kawaguchi H, Suga T, Utsugi T, Ohyama Y, Kurabayashi M, Kaname T, Kume E, Iwasaki H, Iida A, Shiraki-Iida T, Nishikawa S, Nagai R, Nabeshima YI. Mutation of the mouse klotho gene leads to a syndrome resembling ageing. Nature. 1997;390(6655):45–51. doi: 10.1038/36285. [DOI] [PubMed] [Google Scholar]
- 31.Suga T, Kurabayashi M, Sando Y, Ohyama Y, Maeno T, Maeno Y, Aizawa H, Matsumura Y, Kuwaki T, Kuro OM, Nabeshima Y, Nagai R. Disruption of the klotho gene causes pulmonary emphysema in mice. Defect in maintenance of pulmonary integrity during postnatal life. Am J Respir Cell Mol Biol. 2000;22(1):26–33. doi: 10.1165/ajrcmb.22.1.3554. [DOI] [PubMed] [Google Scholar]
- 32.Glover GH, Pauly JM, Bradshaw KM. Boron-11 imaging with a three-dimensional reconstruction method. J Magn Reson Imaging. 1992;2(1):47–52. doi: 10.1002/jmri.1880020109. [DOI] [PubMed] [Google Scholar]
- 33.Wong ST, Roos MS. A strategy for sampling on a sphere applied to 3D selective RF pulse design. Magn Reson Med. 1994;32(6):778–784. doi: 10.1002/mrm.1910320614. [DOI] [PubMed] [Google Scholar]
- 34.Rahmer J, Bornert P, Groen J, Bos C. Three-dimensional radial ultrashort echo-time imaging with T2 adapted sampling. Magn Reson Med. 2006;55(5):1075–1082. doi: 10.1002/mrm.20868. [DOI] [PubMed] [Google Scholar]
- 35.Aldefeld B, Bornert P. Effects of gradient anisotropy in MRI. Magn Reson Med. 1998;39(4):606–614. doi: 10.1002/mrm.1910390414. [DOI] [PubMed] [Google Scholar]
- 36.Miller AJ, Joseph PM. The use of power images to perform quantitative analysis on low SNR MR images. Magn Reson Imaging. 1993;11(7):1051–1056. doi: 10.1016/0730-725x(93)90225-3. [DOI] [PubMed] [Google Scholar]
- 37.Takubo Y, Guerassimov A, Ghezzo H, Triantafillopoulos A, Bates JH, Hoidal JR, Cosio MG. Alpha1-antitrypsin determines the pattern of emphysema and function in tobacco smoke-exposed mice: parallels with human disease. Am J Respir Crit Care Med. 2002;166(12 Pt 1):1596–1603. doi: 10.1164/rccm.2202001. [DOI] [PubMed] [Google Scholar]
- 38.Sato A, Hirai T, Imura A, Kita N, Iwano A, Muro S, Nabeshima Y, Suki B, Mishima M. Morphological mechanism of the development of pulmonary emphysema in klotho mice. Proc Natl Acad Sci U S A. 2007;104(7):2361–2365. doi: 10.1073/pnas.0607882104. [DOI] [PMC free article] [PubMed] [Google Scholar]
- 39.Ishii M, Yamaguchi Y, Yamamoto H, Hanaoka Y, Ouchi Y. Airspace enlargement with airway cell apoptosis in klotho mice: a model of aging lung. J Gerontol A Biol Sci Med Sci. 2008;63(12):1289–1298. doi: 10.1093/gerona/63.12.1289. [DOI] [PubMed] [Google Scholar]
- 40.Hatabu H, Gaa J, Kim D, Li W, Prasad PV, Edelman RR. Pulmonary perfusion and angiography: evaluation with breath-hold enhanced three-dimensional fast imaging steady-state precession MR imaging with short TR and TE. AJR Am J Roentgenol. 1996;167(3):653–655. doi: 10.2214/ajr.167.3.8751673. [DOI] [PubMed] [Google Scholar]
- 41.Glover GH, Pauly JM. Projection reconstruction techniques for reduction of motion effects in MRI. Magn Reson Med. 1992;28(2):275–289. doi: 10.1002/mrm.1910280209. [DOI] [PubMed] [Google Scholar]
- 42.Cremillieux Y, Berthezene Y, Humblot H, Viallon M, Canet E, Bourgeois M, Albert T, Heil W, Briguet A. A combined 1H perfusion/3He ventilation NMR study in rat lungs. Magn Reson Med. 1999;41(4):645–648. doi: 10.1002/(sici)1522-2594(199904)41:4<645::aid-mrm1>3.0.co;2-v. [DOI] [PubMed] [Google Scholar]
- 43.Grassino AE, Roussos C. The Lung: Scientific Foundations. 2. Philadelphia: Lippincott-Raven; 1997. Static properties of the lung and chest wall; pp. 1187–1201. [Google Scholar]
- 44.Kauczor HU, Hast J, Heussel CP, Schlegel J, Mildenberger P, Thelen M. CT attenuation of paired HRCT scans obtained at full inspiratory/expiratory position: comparison with pulmonary function tests. Eur Radiol. 2002;12(11):2757–2763. doi: 10.1007/s00330-002-1514-z. [DOI] [PubMed] [Google Scholar]
- 45.Nishino M, Roberts DH, Sitek A, Raptopoulos V, Boiselle PM, Hatabu H. Loss of anteroposterior intralobar attenuation gradient of the lung: Correlation with pulmonary function. Acad Radiol. 2006;13(5):589–597. doi: 10.1016/j.acra.2005.10.025. [DOI] [PubMed] [Google Scholar]
- 46.Madani A, Van Muylem A, de Maertelaer V, Zanen J, Gevenois PA. Pulmonary emphysema: size distribution of emphysematous spaces on multidetector CT images--comparison with macroscopic and microscopic morphometry. Radiology. 2008;248(3):1036–1041. doi: 10.1148/radiol.2483071434. [DOI] [PubMed] [Google Scholar]