

Abstract
Oocytes are formed in utero; menopause occurs when the oocyte pool is depleted. The authors hypothesized that early-life events could affect the number of a woman's oocytes and determine age at menopause. To test their hypothesis, the authors conducted a secondary analysis of baseline data from 22,165 participants in the Sister Study (2003–2007) who were aged 35–59 years at enrollment. To estimate the association between early-life events and age at natural menopause, the authors used Cox proportional hazards models to estimate hazard ratios with 95% confidence intervals, adjusting for current age, race/ethnicity, education, childhood family income, and smoking history. Earlier menopause was associated with in-utero diethylstilbestrol exposure (hazard ratio (HR) = 1.45, 95% confidence interval (CI): 1.27, 1.65). Suggestive associations included maternal prepregnancy diabetes (HR = 1.33, 95% CI: 0.89, 1.98) and low birth weight (HR = 1.09, 95% CI: 0.99, 1.20). Having a mother aged 35 years or older at birth appeared to be associated with a later age at menopause (HR = 0.95, 95% CI: 0.89, 1.01). Birth order, in-utero smoke exposure, and having been breastfed were not related to age at menopause. In-utero and perinatal events may subsequently influence age at menopause.
Keywords: diethylstilbestrol, menopause, pregnancy, prenatal exposure delayed effects, risk factors
Menopause is not only a transition from the reproductive years to reproductive senescence but also a health transition. Following menopause, hormonal and metabolic changes occur, leading to an increase in risk for cardiovascular disease (1) and fractures (2). Age at menopause appears to be directly correlated with age at onset of perimenopausal menstrual cycle irregularity (3) and onset of age-related infertility. Therefore, factors that influence age at menopause may affect not only timing of cessation of menses but also future cardiovascular and reproductive health.
Reproductive aging, the natural progression of the reproductive system through stages of fertility, subfertility, perimenopause, and finally menopause, progresses with the decline in the number of oocytes (4). Age at menopause is thought to reflect the size of the initial cohort of follicles and the rate of oocyte loss (5). If this is so, factors that affect the pace of oocyte atresia or the initial size of the cohort of follicles may change age at menopause. The number of oocytes peaks at approximately 5 million around 24 weeks’ gestation (6) but then declines steadily to around 2 million at birth (7). The high rate of loss continues in the prepubertal years, such that only 300,000 oocytes remain at puberty (8), at which time the rate of loss slows.
Adulthood exposures may affect age at menopause by accelerating the pace of oocyte atresia. Previous studies have shown that adult environmental exposures such as smoking (9), exposure to toxicants such as chemotherapeutic agents (10), and possibly body mass index (11) and alcohol (12) appear to affect age at menopause. Other factors affecting the timing of menopause include race/ethnicity (13) and mother's age at menopause (14), which may be due to shared genetic or environmental factors. A twin study that revealed 63% heritability for age at menopause supports the role of genetic factors in age at menopause (15). However, twins also share a common in-utero environment; therefore, these similarities may be due in part to events occurring during pregnancy, birth, or childhood. Specifically, perinatal and in-utero exposures which influence the size of the initial oocyte cohort and early rates of loss could affect age at menopause. Our objective in this study was to explore the impact of early-life events (prenatal, birth, and neonatal) on age at natural menopause.
MATERIALS AND METHODS
This study was an analysis of baseline data obtained for the Sister Study (www.SisterStudy.org), a prospective cohort study of US and Puerto Rican women aged 35–74 years who were enrolled between August 2003 and March 2009. The Sister Study was designed to assess genetic and environmental risk factors for breast cancer and other conditions. Women without breast cancer who had a full or half-sister with a history of breast cancer were eligible for the study. Through a computer-assisted telephone interview, investigators collected information on menstrual and gynecologic history, socioeconomic characteristics, smoking history, and reproductive history, among other factors. Participants also completed a self-administered questionnaire on early-life events and exposures. A prepaid telephone card was provided to participants to encourage them to contact relatives for information.
Data were available for 32,071 women who completed their baseline home visit and interview by September 21, 2007. We excluded women who underwent natural menopause prior to age 30 years (n = 32), since these cases were most likely due to sex chromosome aneuploidy (16); women who underwent menarche after age 18 years (n = 27); and women who had never had menses (n = 4). We further restricted our analysis to 22,209 participants who were under age 60 years at the time of interview to minimize secular and recall differences within the cohort. The current analysis included 22,165 women after exclusion of 44 women who were missing data on age at menopause.
Menopausal status
Age at natural menopause was the primary outcome for this analysis. Women were considered menopausal if they answered “No” to the question, “Have you had a menstrual period in the past 12 months?” (We did not count women who had had no menses because of pregnancy or breastfeeding or because of premenopausal use of medications which induce amenorrhea.) Age at menopause was defined by the answer to the question, “How old were you when you had your last menstrual period?” Women who had undergone a hysterectomy, bilateral oophorectomy, uterine artery embolization, endometrial ablation, or chemotherapy that had stopped their periods prior to spontaneous menopause were censored at the time of their surgically or medically induced amenorrhea. Premenopausal women were censored at their age at interview.
Exposure and covariate assessment
We used self-administered questionnaires to assess intrauterine and early-life exposures. Participant characteristics included birth weight (pounds/ounces), timing of birth relative to due date, birth order, birth interval, singleton or multiple birth, consumption of breast milk or soy formula during infancy, and childhood food shortages. Characteristics of the participant's mother at the time of the pregnancy and the participant's birth included maternal age at delivery, prepregnancy diabetes, gestational diabetes, gestational hypertension, preeclampsia or eclampsia, morning sickness, maternal farm exposure, diethylstilbestrol (DES) intake, smoking, and seizure disorder. Paternal characteristics included age at the participant's birth and periconceptional smoking. We only analyzed paternal and household in-utero smoking exposure when the mother was a nonsmoker during pregnancy.
Maternal and paternal characteristics (except for age at participant's birth) and consumption of breast milk and soy formula included the following response categories: “definitely,” “probably,” “probably not,” “definitely not,” and “don't know.” For analyses, responses were collapsed into 2 categories: exposed, including the responses “definitely” and “probably,” and unexposed, including the responses “probably not” and “definitely not.” “Don't know” responses were coded as missing data.
For analyses, maternal diabetes was separated into 3 mutually exclusive categories: no diabetes, diabetes preceding pregnancy, and diabetes during pregnancy only. The gestational diabetes group excluded mothers with prepregnancy diabetes but included mothers whose prepregnancy diabetes status was unknown. Maternal hypertension was divided into 3 mutually exclusive categories: no hypertension, isolated hypertension in pregnancy, and preeclampsia or eclampsia in pregnancy. The isolated hypertension group excluded mothers with preeclampsia or eclampsia but included mothers whose preeclampsia or eclampsia status was unknown. Information on maternal hypertension was considered missing if the participant responded negatively regarding 1 form of hypertension (either isolated or preeclampsia/eclampsia) and “unknown” regarding another. Maternal farm exposure was divided into 4 mutually exclusive categories: 1) mother lived and worked on a farm during pregnancy, 2) mother lived on a farm but did not work on a farm, 3) mother worked on a farm but did not live on a farm, and 4) mother did not live or work on a farm.
Birth order and birth interval (for nonfirstborn persons; number of years between index birth and preceding sibling's birth) was estimated from the birth dates of brothers reported in self-administered family history questionnaires and sisters reported during computer-assisted telephone interviews. For these definitions, we considered only siblings (full and half) who shared the same mother. Only nonfirstborn persons were included in birth interval analyses.
Additional covariates on which data were collected during the telephone interview included self-reported category of childhood family income, participant's age, highest level of education, race/ethnicity, and smoking status between ages 40 and 49 years (or current smoking status for women who were under age 40 years at the time of interview). Because of a substantial proportion of missing responses, we did not assess associations with gestational age at delivery (43% missing) and maternal morning sickness (29% missing).
Statistical analyses
All statistical analyses were conducted using STATA 10.0 (Stata Corporation, College Station, Texas). Initially, bivariate analyses were conducted using only the subset of the cohort that underwent natural menopause, to determine the most appropriate method for modeling continuous and categorical exposures. Subsequently, we created multiple Kaplan-Meier curves to graphically assess violation of the proportional hazards assumption. It was noted that the curves became unstable after age 56 years; thus, participants were censored at 56 years of age, assuring that the proportional hazards assumption was met with all variables.
We used multiple Cox proportional hazards models to estimate hazard ratios with 95% confidence intervals for the associations between each of the intrauterine or early-life exposures and age at natural menopause. Exposures with hazard ratios greater than 1 were associated with earlier onset of menopause, and those with hazard ratios less than 1 were associated with later age at menopause.
Each model contained a set of core covariates—factors that might affect reporting, risk factors that might affect the precision of the estimates, or risk factors previously shown to be strongly associated with age at menopause: participant age, participant race/ethnicity (white, black, Hispanic, or other), participant's highest level of education, childhood family income, and participant's smoking status in her 40s. In 893 (4%) observations, at least 1 core variable was missing a value. To improve power, we imputed these core variable values using STATA's ice command, which imputes missing values by using switching regression, an iterative multivariable regression technique.
The majority of participants were missing responses for at least 1 early-life exposure. Some exposures (e.g., low birth weight) may be considered potential intermediates on the causal pathway between another early-life exposure (e.g., hypertension in pregnancy) and age at menopause. Therefore, we created multiple Cox proportional hazards models, each including the core covariates and 1 intrauterine or early-life exposure of interest. In post hoc analyses to address potential confounding within pairs of exposures that appeared important, we used pairwise models or excluded specific exposed groups.
RESULTS
Of the 22,165 women included in the analysis, 6,659 (30%) had undergone natural menopause, 10,161 (46%) were still menstruating, and the remaining 5,345 (24%) had undergone surgical or medically induced menopause. Average age at the last menstrual period for those women who had experienced natural menopause was 49.3 years (standard deviation (SD), 4.2) (median, 50 years), while average age at the last menstrual period for those who were still menstruating was 45.8 years (SD, 5.0), and for those who had undergone medical or surgically induced menopause, it was 40.3 years (SD, 7.3). Median age at menopause for the entire cohort, based on survival analysis, was 52 years. A full description of the analyzed cohort is provided in Table 1 and Table 2. Participants in this analysis tended to be white and educated.
Table 1.
Core Covariates Included in All Models and Their Associations With Age at Menopause (n = 22,165), Sister Study, 2003–2007a
| Mean (SD) | No. | % | Hazard Ratio | 95% Confidence Interval | |
| Age, years | 50.06 (6.08) | 1.04 | 1.03, 1.05 | ||
| Race/ethnicity | |||||
| White | 20,083 | 91 | 1 | Referent | |
| Black | 972 | 4 | 1.07 | 0.93, 1.23 | |
| Hispanic | 524 | 2 | 1.12 | 0.93, 1.34 | |
| Other | 585 | 3 | 1.08 | 0.92, 1.26 | |
| Missing data | 1 | ||||
| Education | |||||
| High school or less | 2,638 | 12 | 1.15 | 1.06, 1.26 | |
| Some college or an associate's degree | 7,087 | 32 | 1.02 | 0.96, 1.09 | |
| Bachelor's degree | 6,728 | 30 | 1 | Referent | |
| Master's or doctoral degree | 5,711 | 26 | 0.99 | 0.93, 1.05 | |
| Missing data | 1 | ||||
| Smoking status at ages 40–49 yearsb | |||||
| Smoker | 3,560 | 17 | 1.40 | 1.31, 1.49 | |
| Nonsmoker | 17,730 | 83 | 1 | Referent | |
| Missing data | 875 | ||||
| Childhood family income | |||||
| Well-off | 1,579 | 7 | 0.98 | 0.89, 1.08 | |
| Middle-income | 14,464 | 65 | 1 | Referent | |
| Low-income | 4,949 | 22 | 0.98 | 0.93, 1.04 | |
| Poor | 1,154 | 5 | 0.99 | 0.89, 1.11 | |
| Missing data | 19 |
Abbreviation: SD, standard deviation.
Each hazard ratio was adjusted for all of the other core covariates.
Or current smoking, if under age 40 years.
Table 2.
Adjusted Hazard Ratios for Associations of Intrauterine and Early-Life Exposures With Age at Menopause (n = 22,165), Sister Study, 2003–2007a
| Mean (SD) | No. | % | Hazard Ratio | 95% Confidence Interval | |
| Mean maternal age at birth (n = 21,711), years | 28.9 (6.0) | 0.996 | 0.99, 1.00 | ||
| Maternal age at birth, years | |||||
| <20 | 840 | 4 | 0.999 | 0.87, 1.14 | |
| 20–34 | 16,687 | 77 | 1 | Referent | |
| ≥35 | 4,184 | 19 | 0.95 | 0.89, 1.01 | |
| Missing data | 454 | ||||
| Maternal prepregnancy seizure disorder | |||||
| Yes | 101 | <1 | 0.78 | 0.48, 1.25 | |
| No | 21,641 | >99 | 1 | Referent | |
| Missing data | 423 | ||||
| Maternal hypertension during pregnancy | |||||
| Hypertension only | 345 | 2 | 1.01 | 0.82, 1.24 | |
| Preeclampsia or eclampsia | 431 | 2 | 1.02 | 0.85, 1.21 | |
| No | 18,667 | 96 | 1 | Referent | |
| Missing data | 2,722 | ||||
| Maternal diabetes | |||||
| Preceding pregnancy | 81 | <1 | 1.33 | 0.89, 1.98 | |
| Gestational diabetes only | 119 | <1 | 1.16 | 0.79, 1.69 | |
| None | 19,992 | 99 | 1 | Referent | |
| Missing data | 1,973 | ||||
| Maternal farm exposure | |||||
| Lived on farm | 919 | 4 | 0.99 | 0.88, 1.11 | |
| Worked on farm | 244 | 1 | 0.92 | 0.73, 1.17 | |
| Lived and worked on farm | 1,872 | 9 | 1.00 | 0.92, 1.10 | |
| None | 18,702 | 86 | 1 | Referent | |
| Missing data | 428 | ||||
| Diethylstilbestrol exposure in utero | |||||
| Yes | 709 | 4 | 1.45 | 1.27, 1.65 | |
| No | 18,394 | 96 | 1 | Referent | |
| Missing data | 3,062 | ||||
| In-utero smoke exposure | |||||
| Maternal smoking | |||||
| Yes | 7,503 | 36 | 1.02 | 0.97, 1.07 | |
| No | 13,626 | 64 | 1 | Referent | |
| Missing data | 1,036 | ||||
| Paternal smokingb (if mother was a nonsmoker; n = 14,662) | |||||
| Yes | 7,791 | 57 | 1.01 | 0.94, 1.07 | |
| No | 5,857 | 43 | 1 | Referent | |
| Missing data | 1,014 | ||||
| Anyone in household (if mother was a nonsmoker; n = 14,662) | |||||
| Yes | 6,746 | 49 | 1.03 | 0.96, 1.09 | |
| No | 6,941 | 51 | 1 | Referent | |
| Missing data | 975 | ||||
| Mean paternal age at birth (n = 21,659), years | 31.9 (6.9) | 0.997 | 0.99, 1.00 | ||
| Birth order | |||||
| Firstborn or only child | 4,207 | 19 | 1.01 | 0.95, 1.07 | |
| Not firstborn | 17,613 | 81 | 1 | Referent | |
| Missing data | 345 | ||||
| Mean birth interval, years (n = 17,562) | 3.40 (2.56) | 0.99 | 0.98, 1.00 | ||
| Birth interval, years (n = 17,562) | |||||
| ≤1 | 3,284 | 19 | 1.03 | 0.96, 1.11 | |
| 2–5 | 11,565 | 66 | 1 | Referent | |
| ≥6 | 2,713 | 15 | 0.94 | 0.86, 1.02 | |
| Birth weight, g | |||||
| <2,500 | 1,476 | 8 | 1.09 | 0.99, 1.20 | |
| 2,500–4,000 | 14,516 | 84 | 1 | Referent | |
| >4,000 | 1,319 | 8 | 1.03 | 0.92, 1.14 | |
| Missing data | 4,854 | ||||
| Multiple gestation | |||||
| Yes | 764 | 3 | 1.10 | 0.96, 1.25 | |
| No | 21,103 | 97 | 1 | Referent | |
| Missing data | 298 | ||||
| Breastfed | |||||
| Yes | 8,275 | 40 | 1.01 | 0.96, 1.06 | |
| No | 12,473 | 60 | 1 | Referent | |
| Missing data | 1,417 | ||||
| Soy-fed | |||||
| Yes | 713 | 4 | 0.97 | 0.82, 1.14 | |
| No | 17,885 | 96 | 1 | Referent | |
| Missing data | 3,567 | ||||
| Soy-fed in first 2 months of life | |||||
| Yes | 421 | 2 | 0.95 | 0.76, 1.18 | |
| No | 18,125 | 98 | 1 | Referent | |
| Missing data | 3,619 | ||||
| Childhood food shortage | |||||
| Yes | 1,768 | 8 | 1.05 | 0.95, 1.16 | |
| No | 20,386 | 92 | 1 | Referent | |
| Missing data | 11 |
Abbreviation: SD, standard deviation.
In each model, results were adjusted for participant's age, race/ethnicity, educational level, smoking status in the participant's 40s, and childhood family income.
Exposure to paternal smoking around the time of conception.
Only 1 perinatal exposure, definite or probable in-utero exposure to DES, was found to be significantly associated with age at menopause. Time to age at menopause in the exposed and unexposed groups is presented graphically in Figure 1A. Women exposed to DES in utero underwent menopause at 1.45 times (95% confidence interval (CI): 1.27, 1.65) the rate of women who were not exposed. This resulted in an unadjusted median age at menopause of 51 years (interquartile range, 49–54) for those exposed and 52 years (interquartile range, 50–55) for those unexposed. DES exposure was subsequently expanded into 3 categories of exposure: definite, probable, and unexposed. A stronger association was observed in women responding “definite” DES exposure (n = 440; hazard ratio (HR) = 1.61, 95% CI: 1.37, 1.88) than in women responding “probable” exposure (n = 269; HR = 1.23, 95% CI: 0.98, 1.54). Hazard ratios were unchanged when women whose mothers had diabetes were excluded.
Figure 1.
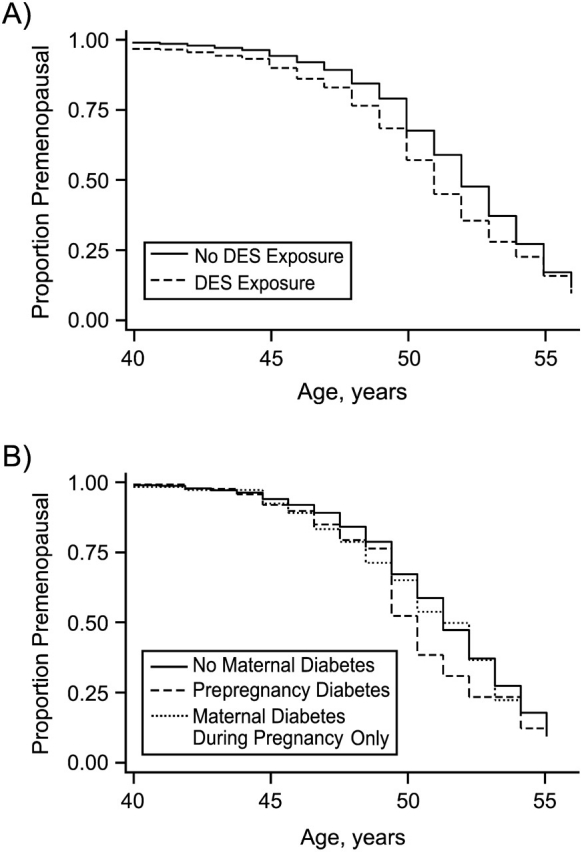
Prevalence of women who were still menstruating as a function of age, by A) level of exposure to diethylstilbestrol (DES) in utero (solid line, unexposed; dashed line, exposed) and B) exposure to maternal diabetes (solid line, unexposed; dashed line, participant's mother had diabetes prior to pregnancy; dotted line, participant's mother had diabetes during pregnancy only), Sister Study, 2003–2007.
Other early-life exposures that tended to be associated with age at menopause included maternal diabetes and maternal age at birth, birth weight, singleton or multiple birth, and birth interval (Table 2). Women whose mothers had prepregnancy diabetes (HR = 1.33, 95% CI: 0.89, 1.98) or gestational diabetes (HR = 1.16, 95% CI: 0.79, 1.69) reported menopause earlier than women whose mothers did not have diabetes (Figure 1B). Hazard ratios were unchanged when mother's age at delivery was included in the model. In a subgroup analysis excluding women who were exposed to DES in utero, the associations were not as strong for prepregnancy diabetes (HR = 1.22, 95% CI: 0.80, 1.88) and gestational diabetes (HR = 1.09, 95% CI: 0.73, 1.65).
Women who reported low birth weight (<2,500 g) underwent menopause earlier (HR = 1.09, 95% CI: 0.99, 1.20; Figure 2), but macrosomia (birth weight >4,000 g) did not appear to delay age at menopause. The strength of this association was not substantially altered when women whose mothers had diabetes or women who were DES-exposed or part of a multiple gestation were excluded from the analysis. Women who were part of a multiple gestation reported menopause earlier than their singleton counterparts (HR = 1.10, 95% CI: 0.96, 1.25). Multiple gestation without low birth weight was not associated with earlier menopause in comparison with all singletons (HR = 1.01, 95% CI: 0.85, 1.21), but multiple gestation with low birth weight did appear to be associated with earlier menopause (HR = 1.20, 95% CI: 0.99, 1.47).
Figure 2.

Prevalence of women who were still menstruating, by birth weight (solid line, normal birth weight (≥2,500 g); dashed line, low birth weight (<2,500 g)), Sister Study, 2003–2007.
Older maternal age at birth (≥35 years) was associated with later age at menopause (compared with mothers aged 20–34 years, HR = 0.95, 95% CI: 0.89, 1.01). The strength of this association was not altered when women whose mothers had diabetes or women who had been exposed to DES in utero were excluded from the analysis. While birth order was not associated with age at menopause, a long birth interval (≥6 years) preceding the participant's birth appeared to be associated with a delay in the onset of menopause (compared with a birth interval of 2–5 years, HR = 0.94, 95% CI: 0.86, 1.02). Being breastfed was not associated with age at menopause (HR = 1.01, 95% CI: 0.96, 1.06). Separate analyses with imputed and nonimputed data resulted in nearly identical estimates (data not shown).
In a sensitivity analysis, women who were coded as being naturally menopausal were excluded from analysis if they had used hormone replacement therapy more than 1 year prior to their stated age at menopause (n = 703) or if they were taking hormonal birth control at menopause (n = 457). Women who were considered to be premenopausal were excluded from the analysis if they were currently on hormone replacement therapy (n = 340). The remaining 20,665 observations were included in the sensitivity analysis. The exclusion of these women did not appreciatively alter the findings.
Unadjusted analyses showed a potential relation between childhood food shortages and earlier menopause (HR = 1.09, 95% CI: 0.99, 1.19). However, after adjustment for adult factors (age at interview, race/ethnicity, education, and smoking status), the association was attenuated (HR = 1.04, 95% CI: 0.95, 1.14). Further adjustment for childhood family income did not significantly alter the association (HR = 1.05, 95% CI: 0.95, 1.16).
DISCUSSION
Oocyte numbers peak prior to birth, and oocyte depletion continues throughout life. Once the number of oocytes declines to approximately 1,000, menopause occurs (17). We hypothesized that perinatal events would affect the size of the initial cohort and subsequent age at menopause. We found that in-utero DES exposure was associated with an earlier age at menopause. Maternal diabetes and low birth weight appeared to be associated with an earlier age at menopause, but estimates were imprecise. Maternal age at delivery over 34 years and birth interval over 5 years tended to be associated with a delayed age at menopause.
Earlier menopause with in-utero DES exposure was also found in the National Cancer Institute DES cohort (18), with similar hazard ratios (our HR = 1.45; National Cancer Institute HR = 1.49). In our study, women exposed to DES in utero went through menopause approximately 1 year earlier than women who were not exposed to DES. A previous case-control study of women in their late 30s did not find a higher prevalence of menopausal women in the group exposed to DES in utero (19). Therefore, DES does not appear to be a significant cause of premature ovarian failure (menopause prior to age 40 years).
DES may lead to earlier menopause by causing abnormal uterine development, affecting the initial oocyte pool, or changing atresia rates. DES is known to cross the placenta. During fetal development, it may disrupt hormonal signaling and lead to altered transcription of genes important for the differentiation of the female reproductive tract (20). The shape of the uterus can be altered, leading to an increase in the risk of cervical incompetence and preterm delivery. Evidence in rodents suggests that the number of oocytes or the rate of atresia is altered. Rats exposed to DES in utero have fewer primordial follicles 3 weeks after birth (21); fewer ova are retrieved following ovulation induction from DES-exposed mice than from nonexposed mice (22).
Earlier menopause among women born to mothers with diabetes compared with women whose mothers were not diabetic is also biologically plausible. Vascular compromise could lead to intrauterine growth restriction and poor ovarian development. Glucose could be toxic to developing oocytes. In addition, genetic factors might explain a link. Type 1 diabetes is associated with certain human leukocyte antigen polymorphisms that have been found in women with premature ovarian failure (23, 24). Both mother and daughter may share genetic susceptibility factors for familial autoimmune polyglandular failure that could result in both diabetes and premature ovarian failure (25).
In this study, low birth weight was weakly associated with earlier menopause (HR = 1.09, 95% CI: 0.99, 1.20). To our knowledge, this is the first study to show this association. The work of de Bruin et al. (26), showing a smaller volume percentage of primordial follicles in growth-restricted human fetal ovaries as compared with age-matched controls, gives the finding biologic plausibility. While some investigators have not found an association between birth weight and age at menopause (27–31), shortness at birth and a high ponderal index (birth weight/length3) were associated with earlier menopause in 1 study (27). Poor infant weight gain (up to age 2 years) also has been reported to lead to earlier age at menopause (27, 29, 31). Perhaps it is the process leading to poor weight gain (in or out of the uterus) rather than weight per se that may lead to earlier menopause.
We failed to find an association between being breastfed and age at menopause. Two previous analyses of a British birth cohort (Medical Research Council National Survey of Health and Development) found that being breastfed was associated with later menopause (29, 31), and the effect was stronger for women who were breastfed for more than 6 months. For the British cohort, breastfeeding information was obtained from the mother when her daughter was 2 years of age, while our study relied on daughters’ self-reports and did not use data on duration, because many women could not report it. A biologic mechanism by which breastfeeding may delay oocyte depletion has not been proposed.
We did not find an association between in-utero exposure to cigarette smoking and age at menopause. Strohsnitter et al. (32) reported that women exposed to cigarette smoke in utero were more likely to be postmenopausal (HR = 1.21, 95% CI: 1.20, 1.43). The relation was present only among women who were not current smokers. After restricting analyses to women who did not smoke in their 40s, we still did not find an association with in-utero smoke exposure (HR = 1.04, 95% CI: 0.98, 1.11). While in-utero exposure to cigarette smoke may be harmful to developing oocytes, genetic factors and other adult exposures may play a more dominant role in determining age at menopause.
In this study, there initially appeared to be an association between childhood food shortages and earlier menopause; however, after adjustment for adult socioeconomic factors and smoking status, the association was attenuated. No association between childhood household income and age at menopause was noted. Multiple studies have indicated that there may be an association between low childhood socioeconomic status and earlier menopause. Researchers have specifically examined father's social class (29, 31), household crowding (29, 31), household number of bathrooms (30), sharing a bedroom (30), and access to a car (30). Some of the associations persisted after adjustment for adult factors (30), while other studies showed attenuated associations (29, 31).
In our study, older maternal age at birth and longer birth interval were weakly associated with later age at menopause, and these factors were themselves correlated. Any association between having been born to a woman aged 35 years or older may simply reflect shared genetic factors affecting fertile life span (highly correlated with age of menopause), as has been suggested by heritability of ovarian reserves (33) and the significant correlation between mothers’ and daughters’ ages at menopause (34).
This study was limited by its use of retrospectively collected data on early-life factors that may not have been well reported. To minimize reporting errors, participants were provided with a prepaid telephone card and encouraged to consult their mother or other family members. Exposures with a high proportion of missing data, such as estimated gestational age at delivery, duration of breastfeeding, and maternal nausea and vomiting during pregnancy, could not be analyzed. We restricted the analysis to women aged 35–59 years to minimize cohort effects, outcome information bias, and possible exposure misclassification. Previous research indicates that, in general, women can provide valid estimates of their age at menopause (33, 34). To our knowledge, this is the largest study to have examined the impact of early-life events on age at menopause. Cox proportional hazards models were used to evaluate associations with time to menopause while adjusting for adult smoking, a strong predictor of age at menopause, and factors that might have affected reporting accuracy, like education. Cause of menopause was determined for each individual, and women with surgical or medical menopause were censored.
Participants in the Sister Study are sisters of women with breast cancer. Use of this cohort may enrich the prevalence of exposures related to breast cancer risk (due to sharing of genetics and environment with sisters), but the magnitude and direction of associations with the outcome studied should not differ. Any bias introduced by having studied sisters of women with breast cancer would probably be small (35).
In conclusion, early-life events may influence future age at menopause. Early menopause among daughters exposed to DES in utero was confirmed, and there was suggestive evidence for low birth weight and maternal diabetes.
Acknowledgments
Author affiliations: Department of Obstetrics and Gynecology, School of Medicine, University of North Carolina at Chapel Hill, Chapel Hill, North Carolina (Anne Z. Steiner); and Epidemiology Branch, National Institute of Environmental Health Sciences, Research Triangle Park, North Carolina (Aimee A. D'Aloisio, Lisa A. DeRoo, Dale P. Sandler, Donna D. Baird).
This work was supported, in part, by the Intramural Research Program of the National Institutes of Health, National Institute of Environmental Health Sciences (grant ZO1 ES 044005), and the University of North Carolina Women's Reproductive Health Research Center (grant K12 HD 050113).
Drs. Allen Wilcox and Anne Marie Jukic provided helpful comments on the manuscript.
Conflict of interest: none declared.
Glossary
Abbreviations
- CI
confidence interval
- DES
diethylstilbestrol
- HR
hazard ratio
- SD
standard deviation
References
- 1.Matthews KA, Wing RR, Kuller LH, et al. Influence of the perimenopause on cardiovascular risk factors and symptoms of middle-aged healthy women. Arch Intern Med. 1994;154(20):2349–2355. [PubMed] [Google Scholar]
- 2.Cummings SR, Melton LJ. Epidemiology and outcomes of osteoporotic fractures. Lancet. 2002;359(9319):1761–1767. doi: 10.1016/S0140-6736(02)08657-9. [DOI] [PubMed] [Google Scholar]
- 3.den Tonkelaar I, te Velde ER, Looman CW. Menstrual cycle length preceding menopause in relation to age at menopause. Maturitas. 1998;29(2):115–123. doi: 10.1016/s0378-5122(98)00013-9. [DOI] [PubMed] [Google Scholar]
- 4.Soules MR, Sherman S, Parrott E, et al. Executive summary: Stages of Reproductive Aging Workshop (STRAW) Fertil Steril. 2001;76(5):874–878. doi: 10.1016/s0015-0282(01)02909-0. [DOI] [PubMed] [Google Scholar]
- 5.Gougeon A, Chainy GB. Morphometric studies of small follicles in ovaries of women at different ages. J Reprod Fertil. 1987;81(2):433–442. doi: 10.1530/jrf.0.0810433. [DOI] [PubMed] [Google Scholar]
- 6.Gondos B, Bhiraleus P, Hobel CJ. Ultrastructural observations on germ cells in human fetal ovaries. Am J Obstet Gynecol. 1971;110(5):644–652. doi: 10.1016/0002-9378(71)90245-6. [DOI] [PubMed] [Google Scholar]
- 7.Himelstein-Braw R, Byskov AG, Peters H, et al. Follicular atresia in the infant human ovary. J Reprod Fertil. 1976;46(1):55–59. doi: 10.1530/jrf.0.0460055. [DOI] [PubMed] [Google Scholar]
- 8.Baker TG. A quantitative and cytological study of germ cells in human ovaries. Proc R Soc Lond B Biol Sci. 1963;158:417–433. doi: 10.1098/rspb.1963.0055. [DOI] [PubMed] [Google Scholar]
- 9.Gold EB, Bromberger J, Crawford S, et al. Factors associated with age at natural menopause in a multiethnic sample of midlife women. Am J Epidemiol. 2001;153(9):865–874. doi: 10.1093/aje/153.9.865. [DOI] [PubMed] [Google Scholar]
- 10.Bines J, Oleske DM, Cobleigh MA. Ovarian function in premenopausal women treated with adjuvant chemotherapy for breast cancer. J Clin Oncol. 1996;14(5):1718–1729. doi: 10.1200/JCO.1996.14.5.1718. [DOI] [PubMed] [Google Scholar]
- 11.MacMahon B, Worcester J. Age at menopause. United States—1960–1962. Vital Health Stat 11. 1966;19:1–20. [PubMed] [Google Scholar]
- 12.Torgerson DJ, Thomas RE, Campbell MK, et al. Alcohol consumption and age of maternal menopause are associated with menopause onset. Maturitas. 1997;26(1):21–25. doi: 10.1016/s0378-5122(96)01075-4. [DOI] [PubMed] [Google Scholar]
- 13.Henderson KD, Bernstein L, Henderson B, et al. Predictors of the timing of natural menopause in the Multiethnic Cohort Study. Am J Epidemiol. 2008;167(11):1287–1294. doi: 10.1093/aje/kwn046. [DOI] [PubMed] [Google Scholar]
- 14.Cramer DW, Xu H, Harlow BL. Family history as a predictor of early menopause. Fertil Steril. 1995;64(4):740–745. doi: 10.1016/s0015-0282(16)57849-2. [DOI] [PubMed] [Google Scholar]
- 15.Snieder H, MacGregor AJ, Spector TD. Genes control the cessation of a woman's reproductive life: a twin study of hysterectomy and age at menopause. J Clin Endocrinol Metab. 1998;83(6):1875–1880. doi: 10.1210/jcem.83.6.4890. [DOI] [PubMed] [Google Scholar]
- 16.Rebar RW, Connolly HV. Clinical features of young women with hypergonadotropic amenorrhea. Fertil Steril. 1990;53(5):804–810. [PubMed] [Google Scholar]
- 17.Faddy MJ, Gosden RG, Gougeon A, et al. Accelerated disappearance of ovarian follicles in mid-life: implications for forecasting menopause. Hum Reprod. 1992;7(10):1342–1346. doi: 10.1093/oxfordjournals.humrep.a137570. [DOI] [PubMed] [Google Scholar]
- 18.Hatch EE, Troisi R, Wise LA, et al. Age at natural menopause in women exposed to diethylstilbestrol in utero. Am J Epidemiol. 2006;164(7):682–688. doi: 10.1093/aje/kwj257. [DOI] [PubMed] [Google Scholar]
- 19.Hornsby PP, Wilcox AJ, Herbst AL. Onset of menopause in women exposed to diethylstilbestrol in utero. Am J Obstet Gynecol. 1995;172(1):92–95. doi: 10.1016/0002-9378(95)90090-x. [DOI] [PubMed] [Google Scholar]
- 20.Mericskay M, Carta L, Sassoon D. Diethylstilbestrol exposure in utero: a paradigm for mechanisms leading to adult disease. Birth Defects Res A Clin Mol Teratol. 2005;73(3):133–135. doi: 10.1002/bdra.20121. [DOI] [PubMed] [Google Scholar]
- 21.Yamamoto M, Shirai M, Sugita K, et al. Effects of maternal exposure to diethylstilbestrol on the development of the reproductive system and thyroid function in male and female rat offspring. J Toxicol Sci. 2003;28(5):385–394. doi: 10.2131/jts.28.385. [DOI] [PubMed] [Google Scholar]
- 22.McLachlan JA, Newbold RR, Shah HC, et al. Reduced fertility in female mice exposed transplacentally to diethylstilbestrol (DES) Fertil Steril. 1982;38(3):364–371. doi: 10.1016/s0015-0282(16)46520-9. [DOI] [PubMed] [Google Scholar]
- 23.Walfish PG, Gottesman IS, Shewchuk AB, et al. Association of premature ovarian failure with HLA antigens. Tissue Antigens. 1983;21(2):168–169. doi: 10.1111/j.1399-0039.1983.tb00386.x. [DOI] [PubMed] [Google Scholar]
- 24.Anasti JN, Adams S, Kimzey LM, et al. Karyotypically normal spontaneous premature ovarian failure: evaluation of association with the class II major histocompatibility complex. J Clin Endocrinol Metab. 1994;78(3):722–723. doi: 10.1210/jcem.78.3.8126148. [DOI] [PubMed] [Google Scholar]
- 25.Kim TJ, Anasti JN, Flack MR, et al. Routine endocrine screening for patients with karyotypically normal spontaneous premature ovarian failure. Obstet Gynecol. 1997;89(5):777–779. doi: 10.1016/s0029-7844(97)00077-x. [DOI] [PubMed] [Google Scholar]
- 26.de Bruin JP, Dorland M, Bruinse HW, et al. Fetal growth retardation as a cause of impaired ovarian development. Early Hum Dev. 1998;51(1):39–46. doi: 10.1016/s0378-3782(97)00073-x. [DOI] [PubMed] [Google Scholar]
- 27.Cresswell JL, Egger P, Fall CH, et al. Is the age of menopause determined in-utero? Early Hum Dev. 1997;49(2):143–148. doi: 10.1016/s0378-3782(97)00028-5. [DOI] [PubMed] [Google Scholar]
- 28.Treloar SA, Sadrzadeh S, Do KA, et al. Birth weight and age at menopause in Australian female twin pairs: exploration of the fetal origin hypothesis. Hum Reprod. 2000;15(1):55–59. doi: 10.1093/humrep/15.1.55. [DOI] [PubMed] [Google Scholar]
- 29.Mishra G, Hardy R, Kuh D. Are the effects of risk factors for timing of menopause modified by age? Results from a British birth cohort study. Menopause. 2007;14(4):717–724. doi: 10.1097/GME.0b013e31802f3156. [DOI] [PubMed] [Google Scholar]
- 30.Lawlor DA, Ebrahim S, Smith GD. The association of socio-economic position across the life course and age at menopause: the British Women's Heart and Health Study. BJOG. 2003;110(12):1078–1087. [PubMed] [Google Scholar]
- 31.Hardy R, Kuh D. Does early growth influence timing of the menopause? Evidence from a British birth cohort. Hum Reprod. 2002;17(9):2474–2479. doi: 10.1093/humrep/17.9.2474. [DOI] [PubMed] [Google Scholar]
- 32.Strohsnitter WC, Hatch EE, Hyer M, et al. The association between in utero cigarette smoke exposure and age at menopause. Am J Epidemiol. 2008;167(6):727–733. doi: 10.1093/aje/kwm351. [DOI] [PubMed] [Google Scholar]
- 33.Colditz GA, Stampfer MJ, Willett WC, et al. Reproducibility and validity of self-reported menopausal status in a prospective cohort study. Am J Epidemiol. 1987;126(2):319–325. doi: 10.1093/aje/126.2.319. [DOI] [PubMed] [Google Scholar]
- 34.den Tonkelaar I. Validity and reproducibility of self-reported age at menopause in women participating in the DOM-project. Maturitas. 1997;27(2):117–123. doi: 10.1016/s0378-5122(97)01122-5. [DOI] [PubMed] [Google Scholar]
- 35.Weinberg CR, Shore DL, Umbach DM, et al. Using risk-based sampling to enrich cohorts for endpoints, genes, and exposures. Am J Epidemiol. 2007;166(4):447–455. doi: 10.1093/aje/kwm097. [DOI] [PMC free article] [PubMed] [Google Scholar]