

Abstract
The effect of change in reproductive hormones and menopause on incident obesity (body mass index ≥30 kg/m2) and severe obesity (body mass index ≥35 kg/m2) was evaluated over 9 years in 3,260 US women recruited in the multiethnic Study of Women's Health Across the Nation in 1996–1997. After 9 years, cumulative incidences of obesity and severe obesity reached 21.8% and 12.3%, respectively. In multivariate analysis, hormone changes, chronic health conditions, lower physical activity, race/ethnicity, and age were significantly associated with incident obesity and/or severe obesity. The odds of incident severe obesity increased with surgical menopause (odds ratio (OR) = 5.07, 95% confidence interval (CI): 2.29, 11.20; P < 0.001) and initiation of hormone therapy prior to 12 months of amenorrhea (OR = 2.94, 95% CI: 1.14, 7.58; P = 0.03). Predictors of obesity included an increase in free androgen index (OR = 1.37, 95% CI: 1.12, 1.68; P = 0.002) and a decrease in sex hormone-binding globulin (OR = 0.60, 95% CI: 0.45, 0.80; P = 0.0005). Similar results were found for severe obesity. Obesity rates varied by race, but no hormone-by-race interactions were observed. These longitudinal data demonstrate that higher androgens, lower sex hormone-binding globulin, surgical menopause, and early hormone therapy use predict incident obesity and/or severe obesity in a multiracial cohort of women transitioning into menopause.
Keywords: hormones, menopause, obesity, reproduction
Obesity in the United States has reached epidemic proportions (1, 2) and carries an excess risk of stroke, cardiovascular disease, and mortality (3–6). The vascular effects of obesity have been documented among adolescents (7, 8) and young adults (9), and it has been suggested that the decline in cardiovascular disease rates over the last decade is coming to an end because of the vascular effects of the obesity epidemic (10).
Recent research (11–16) has focused on the upper categories of obesity, termed “severe obesity” (class II or above, body mass index (BMI) ≥35 kg/m2) and “extreme obesity” (class III, BMI ≥40 kg/m2) (17). These categories are associated with the most profound excess risk of cardiovascular disease as well as higher comorbidity and health care utilization (11–13).
Weight gain and increases in central body fat occur in many women as they transition from premenopause to postmenopause (15, 16, 18), which may be linked to the increase in cardiovascular events observed following the menopausal transition. Although longitudinal studies suggest that weight gain in white women is driven primarily by age (19, 20), there is substantial evidence of a shift toward central adiposity with menopause (21–25). There is also substantial evidence that reproductive hormones are related to the regulation of energy homeostasis (18), which has been proposed as an underlying mechanism for changes in fat patterning (23). Analyses from the Study of Women's Health Across the Nation (SWAN) have shown that reproductive hormones are cross-sectionally associated with BMI (26), and increases in follicle-stimulating hormone are positively associated with increasing fat mass in women transitioning into menopause (27). Thus, hormone changes underlying the menopause may drive a woman's susceptibility to weight gain. Furthermore, it is unclear whether the association between reproductive hormone changes and weight gain is affected by race/ethnicity. Understanding the role of reproductive hormones as a risk factor for weight gain may help identify new strategies to prevent weight gain in women at midlife.
SWAN, a multiethnic cohort, allows a detailed evaluation of the association between menopause status, hormones, and obesity across a 9-year period. The purpose of the present study was to determine whether obesity is related to menopause status and reproductive hormones, independent of age, and whether the potential relation varies by race.
MATERIALS AND METHODS
Participants
SWAN is a multicenter, longitudinal study to characterize the biologic and psychosocial changes occurring with the menopause in a community-based sample (28). SWAN sites are Boston, Massachusetts; Chicago, Illinois; Detroit, Michigan; Los Angeles, California; Newark, New Jersey; Pittsburgh, Pennsylvania; and Oakland, California. From 1996 to 1997, 3,302 women aged 42–52 years were enrolled. Each site recruited Caucasian women plus one other racial/ethnic group, resulting in 1,550 Caucasian, 935 African-American (Pittsburgh, Detroit, and Boston), 250 Chinese (Oakland), 281 Japanese (Oakland), and 286 Hispanic (Newark: Central-American, South-American, and Caribbean origin) women. Nine years of follow-up were analyzed. Data collection at the New Jersey site was interrupted, precluding inclusion of data for years 7–9 for Hispanic and Caucasian women from this site.
Women who participated had an intact uterus and were still menstruating, had at least one ovary, and were not pregnant or breastfeeding. Exclusion criteria included oral contraceptive or sex steroid hormone therapy use in the prior 3 months. More complete information on screening and data collection has been published previously (28). Institutional review board approval and informed consent was obtained.
For the full cohort of 3,302 women, baseline BMI data were available for 3,260. Analyses of incident obesity included 2,032 women (988 Caucasian, 410 African American, 145 Hispanic, 230 Chinese, or 259 Japanese) who were not already obese at baseline. Analysis of incident severe obesity included 2,510 women (1,224 Caucasian, 590 African American, 191 Hispanic, 236 Chinese, or 269 Japanese) who were not severely obese at baseline.
Physical measures
Height and weight were measured annually with participants in light clothing and without shoes, and calibrated scales were used. BMI was calculated as weight in kilograms divided by height in meters squared. BMI categories were as follows: overweight (25–29.9 kg/m2), class I obesity (30–34.9 kg/m2), and severe obesity (≥35 kg/m2), including class II (35–39.9 kg/m2) and class III (≥40 kg/m2) obesity.
Menopause status was assessed annually based on menstrual bleeding and use of hormone therapy, using categories similar to those from the World Health Organization (29):
Premenopause: monthly bleeding with no perceived change in cycle interval.
Early perimenopause: monthly bleeding with a perceived change in cycle interval, but at least one menstrual period within the past 3 months.
Late perimenopause: ≥3 consecutive months of amenorrhea.
Postmenopause: ≥12 consecutive months of amenorrhea.
Surgical menopause: menopause induced by hysterectomy with or without oophorectomy.
Unknown: use of hormone therapy before documentation of a final menstrual period.
The presence or absence of a chronic health condition was established annually from self-report or medication use. These conditions included diabetes, heart conditions, or stroke or use of lipid-lowering drugs, antihypertensives, corticosteroids, anticoagulants, or antidepressants. Also included was an abnormal thyroid-stimulating hormone value (≥5 mIU/mL or ≤0.5 mIU/mL), assessed by using the ACS 180 TSH assay (Siemens Medical Solution Diagnostics, Walpole, Massachusetts).
Smoking was evaluated by questionnaire (30) and was coded as never, past, or current. Physical activity was based on the Kaiser Permanente Activity Score (31), a modification of the Baecke scale (32), and was assessed at baseline and visits 3, 5, 6, and 9. Data for missing visits were replaced by corresponding averages of previous and subsequent measured values. Alcohol consumption was analyzed at baseline as none, 1 or fewer, and more than 1 serving per day (1 serving = 12 ounces of beer, 5 ounces of wine, or 1.5 ounces of hard liquor (1 ounce = 30 mL)).
Assays
Annual fasting blood draws were targeted to the follicular phase of the menstrual cycle (days 2–5), and the samples were maintained at 4°C until separated and frozen at −80°C. Estradiol, testosterone, sex hormone-binding globulin (SHBG), dehydroepiandrosterone sulfate, and follicle-stimulating hormone were assayed at the University of Michigan Endocrine Laboratory (Ann Arbor, Michigan) by using an ACS-180 automated chemiluminescence analyzer (Siemens Medical Solution Diagnostics), with modifications to enhance sensitivity, as reported previously (26). Free androgen index was calculated as 100 × testosterone/(28.84 × SHBG) and was used to approximate the amount of non-SHBG bound, biologically available testosterone. Hormone values below the lower limit of detection were replaced with a random value between zero and the lower limit of detection.
Statistical analysis
Participant characteristics at baseline were summarized by obesity status, and differences between the 2 groups were assessed by using a chi-square test or one-way analysis of variance. The adjusted association between baseline obesity status and dependent variables of menopause status and serum reproductive hormones were also assessed by using multivariable logistic regression. Hormone variables were natural log-transformed to reduce skewness. Two separate analyses were run for the binary outcomes of incident obesity (BMI ≥30 kg/m2 vs. <30 kg/m2) and severe obesity (BMI ≥35 kg/m2 vs. <35 kg/m2). The analyses of incidence were limited to the subsets of women who were not obese (n = 2,032) or severely obese (n = 2,510) at baseline and had at least one follow-up visit. Data were censored after the first measured incidence.
Kaplan-Meier product-limit estimates (33), which account for variable lengths of follow-up, were used to assess the cumulative incidence of obesity and severe obesity. Analyses were stratified by ethnicity, and the log-rank test was used to compare differences across ethnic groups.
The association between incident obesity or severe obesity and menopause status and reproductive hormones (estradiol, testosterone, SHBG, free androgen index, dehydroepiandrosterone sulfate, and follicle-stimulating hormone) was modeled by using a discrete-time logit approach (34, 35) because incident obesity cases were identified at annual assessment only. Odds ratios and 95% confidence intervals were reported. We modeled the covariate set including time-invarying variables of ethnicity, study site, level of education, baseline weight categories, baseline alcohol consumption, baseline age, and baseline physical activity and time-varying covariates of change in age since baseline, change in physical activity since baseline, smoking status, chronic health condition, and hormone therapy use since the last study visit without controlling for menopause status. We then added into the multivariable models menopause status and each hormone separately as predictors.
Menopause status and hormone variables were separated into 2 components, baseline and change since baseline, to distinguish between cross-sectional (between-women) and longitudinal (within-woman) effects. Baseline menopause status was either premenopause or early perimenopause. Change in menopause status was classified into 6 categories: no change (women who remained premenopausal or early perimenopausal), change from premenopause to early perimenopause, and change from premenopause or early perimenopause to late perimenopause, postmenopause, surgical menopause, or “unknown” (because of hormone therapy use). For models including hormones, timing of the blood draw (yes/no within days 2–5 of cycle onset) was also included.
Given the time structure of the interval-censored data, to assess the antecedent effect of risk factors on developing obesity, time-varying risk factors were taken from the prior visit. Exceptions were menopause status and hormone therapy use, which were taken from the same visit as obesity status because they were collected as change during the study interval.
Interactions between ethnicity and the independent variables (menopause status or hormones) were included in the respective models to test whether associations varied by ethnic groups. To assess the impact of a disproportionate and systematic loss to follow-up at the New Jersey site, we reran multivariable models with and without the data from the New Jersey site. Data from the full sample including the New Jersey site are reported herein because the conclusions were the same after removing the New Jersey data, with one exception. Compared with women who remained premenopausal or early perimenopausal, women who changed to postmenopausal were significantly more likely to become obese (odds ratio (OR) = 1.71, 95% confidence interval (CI): 1.05, 2.80; P = 0.03) in the 6-site sample instead of borderline significantly more likely in the 7-site sample (OR = 1.51, 95% CI: 0.95, 2.39; P = 0.08). Fit of the final models was assessed by using the Hosmer-Lemeshow goodness-of-fit test (36). Analyses were carried out by using SAS version 9 software (SAS Institute, Inc., Cary, North Carolina).
RESULTS
At SWAN baseline, the 3,260 women for whom BMI data were available were on average 46 years of age; 53.7% were premenopausal and 46.3% were early perimenopausal. Women self-identified as Caucasian (47.1%), African American (28.0%), Hispanic (8.7%), Chinese (7.6%), or Japanese (8.6%). The proportions of overweight (26.9%), class 1 obesity (16.4%), and severe obesity (16.7%) differed markedly by racial/ethnic groups, with more obesity among African Americans and Hispanics and less among Chinese and Japanese (Figure 1).
Figure 1.

Prevalence of obesity at baseline by ethnicity in the Study of Women's Health Across the Nation, United States, 1996–1997.
Women who were obese at baseline had lower physical activity scores, had a lower level of education, were more likely to be past/current smokers, consumed less alcohol, and were more likely to have a chronic health condition than women who were not obese (Table 1). After we controlled for these factors, premenopause versus perimenopause status was not significantly related to obesity (OR = 1.16, 95% CI: 0.98, 1.38; P = 0.09). However, hormones and hormone factors, with the exception of dehydroepiandrosterone sulfate, were significantly related to obesity classification (P < 0.001 for all; data not shown).
Table 1.
Baseline Characteristics by Obesity Status in the Study of Women's Health Across the Nation, United States, 1996–1997
| Not Obese (BMI <30 kg/m2) (n = 2,184) |
Obese (BMI ≥30 kg/m2) (n = 1,076) |
P Value | |||
| Count | Column % | Count | Column % | ||
| Ethnicitya | <0.001 | ||||
| Caucasian | 1,057 | 68.9 | 478 | 31.1 | |
| African American | 445 | 48.7 | 468 | 51.3 | |
| Hispanic | 179 | 62.8 | 106 | 37.2 | |
| Chinese | 237 | 95.6 | 11 | 4.4 | |
| Japanese | 266 | 95.3 | 13 | 4.7 | |
| Menopause status | <0.001 | ||||
| Premenopausal | 1,192 | 56.0 | 517 | 49.1 | |
| Early menopausal | 937 | 44.0 | 537 | 50.9 | |
| Degree | <0.001 | ||||
| ≤High school | 484 | 22.4 | 324 | 30.5 | |
| >High school | 644 | 29.7 | 392 | 36.9 | |
| College | 488 | 22.5 | 168 | 15.8 | |
| Postgraduate | 550 | 25.4 | 179 | 16.8 | |
| Smoking status | 0.02 | ||||
| Never | 1,281 | 59.0 | 573 | 54.0 | |
| Past | 529 | 24.4 | 289 | 27.2 | |
| Current | 360 | 16.6 | 200 | 18.8 | |
| Alcohol consumptionb | <0.001 | ||||
| None | 999 | 46.0 | 619 | 57.6 | |
| ≤1 serving/day | 1,025 | 47.2 | 418 | 38.9 | |
| >1 serving/day | 150 | 6.9 | 37 | 3.5 | |
| Chronic health condition | <0.001 | ||||
| No | 1,472 | 67.4 | 479 | 44.5 | |
| Yes | 712 | 32.6 | 597 | 55.5 | |
| Blood drawn in cycle day 2–5 | 0.004 | ||||
| Yes | 1,742 | 79.9 | 811 | 75.6 | |
| No/unknown | 437 | 20.1 | 262 | 24.4 | |
| Current hormone therapy usec | 0.36 | ||||
| No | 1,721 | 92.9 | 837 | 91.9 | |
| Yes | 132 | 7.1 | 74 | 8.1 | |
|
Mean |
Median |
Mean |
Median |
||
| Age, years (range: 42.0–53.0) | 46.3 | 46.1 | 46.4 | 46.3 | 0.29 |
| BMI, kg/m2 (range: 15.0–64.8) | 24.2 | 24.1 | 36.6 | 35.1 | <0.001 |
| Total physical activity score without work (range: 3.0–13.6) | 7.9 | 7.9 | 7.1 | 7.1 | <0.001 |
| Estradiol, pg/mL (range: 5.5–1,493.6) | 79.1 | 59.3 | 71.9 | 49.9 | 0.007 |
| SHBG, nM (range: 0.2–138.1) | 49.5 | 45.7 | 36.9 | 33.4 | <0.001 |
| Testosterone, ng/dL (range: 0.5–334.8) | 45.3 | 39.9 | 50.2 | 44.5 | <0.001 |
| Free androgen indexd (range: 0.04–100.7) | 4.6 | 3.1 | 6.3 | 4.7 | <0.001 |
| Follicle-stimulating hormone, mIU/mL (range: 1.1–168.0) | 25.6 | 16.4 | 22.2 | 14.9 | <0.001 |
| DHEAS, μg/dL (range: 1.5–557.3) | 135.8 | 120.6 | 118.1 | 102.5 | <0.001 |
Abbreviations: BMI, body mass index; DHEAS, dehydroepiandrosterone sulfate; SHBG, sex hormone-binding globulin.
Row percentages are reported.
One serving = 12 ounces of beer, 5 ounces of wine, or 1.5 ounces of hard liquor (1 ounce = 30 mL).
Visit 01 data are reported. At baseline, no one used hormone therapy.
Calculated as 100 × testosterone(ng/mL)/28.84 × SHBG(nM).
Among women who were not obese (n = 2,032) or severely obese (n = 2,510) at baseline, by 9 years of follow-up, the cumulative incidence of obesity reached 21.8% (21.0% of Caucasians, 39.5% of African Americans, 35.2% of Hispanics (6 years of follow-up), 5.4% of Chinese, and 5.7% of Japanese) and of severe obesity reached 12.3% (12.0% of Caucasians, 22.0% of African Americans, 14.1% of Hispanics (6 years of follow-up), 2.8% of Chinese, and 0.8% of Japanese). Kaplan-Meier curves for both obesity and severe obesity differed substantially by race/ethnicity (Figure 2). African-American and Hispanic women progressed more quickly to obesity, whereas Chinese and Japanese women progressed more slowly. Results were similar for the severe obesity class except that we found no difference in the cumulative incidence of obesity for Caucasians versus Hispanics.
Figure 2.
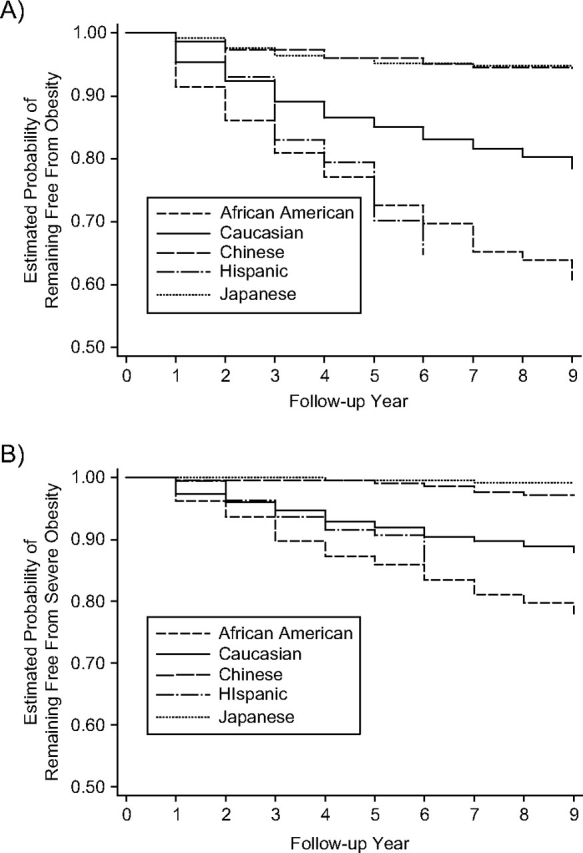
Kaplan-Meier curves showing freedom from A) incident obesity and B) severe obesity over a 9-year period in the Study of Women's Health Across the Nation, United States, 1996–2006.
Factors independently related to incident obesity and/or severe obesity were baseline BMI, presence of a chronic health condition, older age, lower physical activity score, and hormone use. Refer to Table 2.
Table 2.
Multivariate Associations of Risk Factors With Incident Obesity and Severe Obesity During 9 Years of Follow-upa in the Study of Women's Health Across the Nation, United States, 1996–2006
| Obesity (10,519 Observations From 1,935 Women) |
Severe Obesity (13,285 Observations From 2,371 Women) |
|||||
| Odds Ratio | 95% CI | P Value | Odds Ratio | 95% CI | P Value | |
| Degree | 0.06 | 0.87 | ||||
| ≤High school | Ref | Ref | ||||
| >High school | 0.81 | 0.56, 1.17 | 0.98 | 0.63, 1.50 | ||
| College | 0.70 | 0.46, 1.06 | 1.13 | 0.65, 1.95 | ||
| Postgraduate | 0.58 | 0.39, 0.88 | 1.15 | 0.70, 1.89 | ||
| Baseline body mass index | <0.0001 | <0.0001 | ||||
| One-unit change, kg/m2 | 2.14 | 1.98, 2.30 | 1.98 | 1.83, 2.14 | ||
| Smoking status | 0.28 | 0.93 | ||||
| Never | Ref | Ref | ||||
| Past | 1.01 | 0.75, 1.36 | 0.95 | 0.65, 1.38 | ||
| Current | 0.75 | 0.52, 1.09 | 1.04 | 0.66, 1.63 | ||
| Baseline alcohol consumptionb | 0.92 | 0.21 | ||||
| None | Ref | Ref | ||||
| ≤1 serving/day | 1.02 | 0.78, 1.33 | 0.75 | 0.53, 1.05 | ||
| >1 serving/day | 0.91 | 0.51, 1.60 | 0.70 | 0.32, 1.54 | ||
| Chronic health condition | 0.01 | 0.39 | ||||
| No | Ref | Ref | ||||
| Yes | 1.38 | 1.07, 1.77 | 1.15 | 0.84, 1.58 | ||
| Hormone therapy use since the last study visit | 0.77 | 0.003 | ||||
| No | Ref | Ref | ||||
| Yes | 1.05 | 0.75, 1.48 | 1.84 | 1.22, 2.78 | ||
| Baseline age | 0.11 | 0.02 | ||||
| One-unit change, years | 0.96 | 0.92, 1.01 | 0.93 | 0.87, 0.99 | ||
| Change in age since baseline | 0.67 | 0.33 | ||||
| One-unit change, years | 1.01 | 0.96, 1.07 | 1.04 | 0.96, 1.11 | ||
| Baseline physical activity score without work | 0.02 | 0.09 | ||||
| One-unit change | 0.91 | 0.84, 0.98 | 0.91 | 0.82, 1.02 | ||
| Change in physical activity score without work since baseline | 0.007 | 0.25 | ||||
| One-unit change | 0.83 | 0.72, 0.95 | 0.91 | 0.77, 1.07 | ||
Abbreviations: CI, confidence interval; Ref, referent.
All results were adjusted for the other variables in this table plus study site and race/ethnicity.
One serving = 12 ounces of beer, 5 ounces of wine, or 1.5 ounces of hard liquor (1 ounce = 30 mL).
The effect of ethnicity on obesity rates is not included in Table 2 because more information is needed to interpret it. After we adjusted for the factors listed in Table 2, African Americans no longer had higher obesity rates relative to Caucasians (OR = 0.99, 95% CI: 0.72, 1.36 for obesity and OR = 1.11, 95% CI: 0.77, 1.61 for severe obesity). The primary variables accounting for this attenuated association were baseline BMI and physical activity. However, after adjustment, relative to Caucasian ethnicity, both Chinese and Japanese race remained protective for obesity (OR = 0.28, 95% CI: 0.13, 0.62 and OR = 0.41, 95% CI: 0.19, 0.89, respectively). Severe obesity was not evaluated for these 2 groups because of small numbers. For Hispanic ethnicity, complete multivariate adjustment including site was not applicable to a general population because the health status of the Caucasians at the New Jersey site was unusually poor. Without adjustment, we found that Hispanic women at the New Jersey site had a similar risk of obesity compared with New Jersey Caucasians (OR = 1.14, 95% CI: 0.58, 2.22), but Hispanic women were more likely than Caucasian women at other sites to become obese (OR = 2.60, 95% CI: 1.75, 3.86).
The longitudinal associations between obesity and both menopause status and hormones were analyzed (Table 3) by adjusting for all factors related to obesity (Table 2) as well as ethnicity, site, window of blood draw, and hormone therapy use. During follow-up, of the 2,032 women who were not obese (severely obese: 2,510 women) at baseline, 327 (375 women) remained premenopausal or early perimenopausal and 312 (354 women) changed from premenopause to early perimenopause. Changes from premenopause or early perimenopause to other categories affected 147 women (190 women) who changed to late perimenopause, 1,024 (1,306 women) who changed to postmenopause, 114 (162 women) who changed to surgical menopause, and 108 (123 women) who were categorized as “unknown” because of hormone therapy use prior to 12 months of amenorrhea. For those undergoing a natural transition, change in menopause status was not significantly associated with development of obesity or severe obesity. However, compared with women who remained premenopausal or early perimenopausal, those who underwent surgical menopause had 1.78 (95% CI: 0.92, 3.44; P = 0.09) times the odds of obesity and 5.07 (95% CI: 2.29, 11.20; P < 0.0001) times the odds of severe obesity.
Table 3.
Adjusted Odds Ratios of Menopause Status and Different Hormones for Developing Obesity or Severe Obesity Over 9 Years of Follow-upa in the Study of Women's Health Across the Nation, United States, 1996–2006
| Obesity (10,039–10,330 Observations From 1,893–1,929 Women) |
Severe Obesity (12,652–13,049 Observations From 2,321–2,363 Women) |
|||||
| Odds Ratio | 95% CI | P Value | Odds Ratio | 95% CI | P Value | |
| Model 1: menopause status | ||||||
| Baseline status | ||||||
| Premenopausal | Ref | Ref | ||||
| Early perimenopausal | 1.14 | 0.85, 1.53 | 0.37 | 0.86 | 0.59, 1.25 | 0.42 |
| Change in status | 0.15 | 0.002 | ||||
| No change | Ref | Ref | ||||
| Premenopausal to early perimenopausal | 0.94 | 0.63, 1.40 | 0.77 | 0.91 | 0.54, 1.53 | 0.73 |
| Premenopausal/early perimenopausal to late perimenopausal | 1.59 | 0.98, 2.57 | 0.06 | 1.37 | 0.72, 2.61 | 0.34 |
| Premenopausal/early perimenopausal to postmenopausal | 1.51 | 0.95, 2.39 | 0.08 | 1.61 | 0.90, 2.87 | 0.11 |
| Premenopausal/early perimenopausal to surgical (with or without oophorectomy) | 1.78 | 0.92, 3.44 | 0.09 | 5.07 | 2.29, 11.20 | <0.0001 |
| Premenopausal/early perimenopausal to unknown (hormone therapy use before the final menstrual period) | 1.60 | 0.77, 3.31 | 0.20 | 2.94 | 1.14, 7.58 | 0.03 |
| Model 2: estradiol | ||||||
| Baseline | 0.89 | 0.73, 1.08 | 0.25 | 0.98 | 0.75, 1.29 | 0.88 |
| Change since baseline | 0.90 | 0.77, 1.04 | 0.16 | 0.94 | 0.76, 1.17 | 0.56 |
| Model 3: SHBG | ||||||
| Baseline | 1.10 | 0.87, 1.38 | 0.43 | 1.36 | 0.99, 1.88 | 0.06 |
| Change since baseline | 0.60 | 0.45, 0.80 | 0.0005 | 0.54 | 0.37, 0.79 | 0.002 |
| Model 4: testosterone | ||||||
| Baseline | 1.25 | 0.95, 1.65 | 0.11 | 1.09 | 0.74, 1.59 | 0.67 |
| Change since baseline | 1.28 | 0.94, 1.74 | 0.12 | 1.22 | 0.81, 1.82 | 0.34 |
| Model 5: free androgen index | ||||||
| Baseline | 1.08 | 0.91, 1.27 | 0.38 | 0.85 | 0.67, 1.09 | 0.19 |
| Change since baseline | 1.37 | 1.12, 1.68 | 0.002 | 1.41 | 1.09, 1.81 | 0.008 |
| Model 6: DHEAS | ||||||
| Baseline | 1.32 | 1.07, 1.64 | 0.01 | 0.86 | 0.65, 1.12 | 0.26 |
| Change since baseline | 0.98 | 0.68, 1.42 | 0.91 | 0.86 | 0.56, 1.32 | 0.50 |
| Model 7: follicle-stimulating hormone | ||||||
| Baseline | 1.05 | 0.86, 1.28 | 0.61 | 0.98 | 0.75, 1.27 | 0.86 |
| Change since baseline | 1.11 | 0.93, 1.33 | 0.24 | 1.11 | 0.87, 1.41 | 0.39 |
Abbreviations: CI, confidence interval; DHEAS, dehydroepiandrosterone sulfate; Ref, referent; SHBG, sex hormone-binding globulin.
All results were adjusted for race/ethnicity, clinical site, level of education, baseline weight category, smoking status, baseline alcohol consumption, chronic health condition, current hormone therapy use, baseline age, time (aging), and physical activity score. In addition, blood draw on menstrual cycle day 2–5 (yes/no, unknown) was adjusted for in the hormone models.
Severe obesity rates for the surgical group were also elevated in comparison to those for women who were naturally postmenopausal (OR = 3.16, 95% CI: 1.48, 6.72; P = 0.003, using linear contrasts). Of the surgically postmenopausal women (n = 162), approximately 60% had accompanying oophorectomy. Odds of severe obesity were elevated for both nonoophorectomy and oophorectomy groups of women in comparison to women who remained premenopausal or early perimenopausal (OR = 4.86, 95% CI: 2.13, 11.07; P = 0.0002 and OR = 6.96, 95% CI: 1.40, 34.58; P = 0.02, respectively).
A second group at increased risk of severe obesity was the one that used hormone therapy prior to 12 months of amenorrhea. Compared with women who remained premenopausal or early perimenopausal, these women had a 2.94 (95% CI: 1.14, 7.58; P = 0.03) times greater odds of severe obesity.
The only baseline hormone significantly associated with incident obesity was higher dehydroepiandrosterone sulfate (OR = 1.32, 95% CI: 1.07, 1.64; P = 0.01). However, increase in free androgen index over time was strongly associated with both incident obesity (OR = 1.37, 95% CI: 1.12, 1.68; P = 0.002) and severe obesity (OR = 1.41, 95% CI: 1.09, 1.81; P = 0.008). In addition, decrease in SHBG over time was strongly related to both incident obesity (OR = 0.60, 95% CI: 0.45, 0.80; P = 0.0005) and severe obesity (OR = 0.54, 95% CI: 0.37, 0.79; P = 0.002).
Interactions between race/ethnicity and both menopause status and each hormone were tested. None of these terms were statistically significant, indicating that the association between these factors and incident obesity/severe obesity was consistent across race/ethnicity.
DISCUSSION
These data demonstrate that obesity is related to reproductive hormones independent of age. Obesity was not related to menopause status as defined by bleeding patterns. Rates of incident obesity varied by race/ethnicity, but the effects of menopause status and hormones on obesity were consistent across race. Both incident obesity and severe obesity were longitudinally associated with increases in free androgen index and decreases in SHBG across the menopausal transition in this sample of community-dwelling, multiethnic women. These associations were independent of other predictors of obesity and/or severe obesity, including age, physical activity, and the presence of a chronic health condition. Surgical menopause and early hormone therapy use were also independently predictive of incident severe obesity. Higher incident obesity among African Americans relative to Caucasians was due to higher baseline weight and lower physical activity. However, lower incident obesity among Japanese and Chinese Americans relative to Caucasians was independent of other factors.
For women undergoing a natural menopause, changes in bleeding patterns were not a risk factor for obesity. However, surgical menopause was associated with a 78% increased odds of obesity and a 5-fold increased odds of severe obesity. This association is striking, although based on relatively small numbers (162 women experiencing surgical menopause). It is unclear whether hormonal changes are driving this weight change, although increased risk of obesity was present whether or not oophorectomy was performed. Surgically menopausal women are known to suffer more symptoms than naturally menopausal women (37), which may play a role in greater weight gain. It has been shown that women who undergo hysterectomy have a different estrogen receptor profile (38), and this genotype might promote weight gain in association with estrogen loss. Finally, the indication for hysterectomy may play a role in subsequent development of obesity.
Interestingly, early hormone use was a risk factor for obesity. Compared with women who did not change their status, women who initiated hormone therapy before 12 months of amenorrhea had a 1.60 greater odds of obesity and a 2.94 greater odds of severe obesity. Consistent with this finding, women who initiated hormone therapy later during follow-up had almost twice the odds of severe obesity compared with those who did not initiate hormone therapy. Menopausal symptoms may be driving these associations as well. SWAN has reported that obesity is a strong risk factor for vasomotor symptoms (39, 40). Thus, women predisposed to obesity who experience hot flashes may be more likely to seek relief in the form of hormone therapy use. The numbers available in this subgroup are modest, and thus this question deserves further study.
These data suggest that androgens and SHBG are factors in weight gain with the menopausal transition. The strongest associations with obesity were found with high free androgen (free androgen index) and low SHBG. The association between androgens, SHBG, and obesity is observed in other settings, including polycystic ovary syndrome. In this syndrome, hormonal abnormalities include high luteinizing hormone, elevated androgens, and low SHBG (41), which are accompanied by weight gain, elevated lipids, and insulin resistance (41). SWAN has shown that incident metabolic syndrome increases dramatically after the final menstrual period, and incident metabolic syndrome and type 2 diabetes mellitus are strongly tied to higher free androgen index and lower SHBG (42, 43).
While speculative, increases in androgens may be linked to elevations in luteinizing hormone or enhanced sensitivity to higher luteinizing hormone levels. Luteinizing hormone–dependent androgen production from both the ovary (44) and the adrenals (45, 46) is possible because the adrenal glands are known to contain luteinizing hormone receptors (47, 48). Increased androgens alone can increase insulin resistance, promoting weight gain (49). Likewise, increased adiposity can promote further androgen production via increased 17β-hydroxysteroid dehydrogenase activity in subcutaneous adipose tissue (50). Both androgens and insulin resistance (51, 52) can reduce circulating SHBG. Thus, there is the potential for more than one feed forward loop that could result in a progressive constellation of high androgens, low SHBG, insulin resistance, and weight gain.
We analyzed the prospective effect of hormones on subsequent obesity by using hormones from the prior follow-up visit to predict obesity at a later follow-up. These data suggest that high free androgen index and low SHBG promote obesity. Because hormones and obesity are tightly linked, it is possible that the association between reproductive hormones and obesity arises from more than one direction. This analysis was intended to study the prospective effect. Future analyses are planned to evaluate the possible bidirectionality of these associations. Finally, free androgen index and SHBG may be markers of insulin resistance, a known harbinger of obesity.
Both baseline physical activity and an increase in physical activity over time were protective for obesity. Thus, these data confirm the importance of physical activity in curtailing weight gain through the menopausal transition (20, 53). Physical activity reduces insulin resistance (54–57), an established factor in weight gain. Women transitioning to menopause are at risk of insulin resistance (42, 43), and exercise may “counteract” this risk by preserving insulin sensitivity in the skeletal muscles. If women are able to increase their peripheral insulin sensitivity through activity, then weight loss or prevention of weight gain would logically follow. Thus, physical activity may be more important than caloric restriction as a weight management strategy in the setting of the menopausal transition.
The finding that initial weight is the strongest predictor of both obesity and severe obesity over 9 years underscores that, to be effective, attention to weight maintenance must begin prior to the menopausal transition. Obesity has been associated with lower quality of life (58) and with reduced physical function and vitality and increased pain (59). These findings would be expected to affect physical activity, perpetuating a cycle of weight gain.
In conclusion, these longitudinal data suggest that higher androgens, lower SHBG, surgical menopause, and early hormone therapy use predict incident obesity and/or severe obesity in a multiracial cohort of women transitioning to menopause. A strategy to prevent obesity must focus on the premenopausal years and include physical activity.
Acknowledgments
Author affiliations: Department of Epidemiology, Graduate School of Public Health, University of Pittsburgh, Pittsburgh, Pennsylvania (Kim Sutton-Tyrrell, Rachel Mackey); Department of Biostatistics, Graduate School of Public Health, University of Pittsburgh, Pittsburgh, Pennsylvania (Xinhua Zhao); Department of Obstetrics, Gynecology and Women’s Health, New Jersey Medical School, Newark, New Jersey (Nannette Santoro); Department of Population Health and Reproduction, University of California Davis, Davis, California (Bill Lasley); Department of Epidemiology, School of Public Health, University of Michigan, Ann Arbor, Michigan (MaryFran Sowers); Alaska Native Epidemiology Center, Alaska Native Tribal Health Consortium, Anchorage, Alaska (Janet Johnston); and Department of Psychiatry, University of Pittsburgh School of Medicine, Pittsburgh, Pennsylvania (Karen Matthews).
The Study of Women’s Health Across the Nation receives grant support from the National Institutes of Health (NIH), Department of Health and Human Services, through the National Institute on Aging (NIA), the National Institute of Nursing Research (NINR), and the NIH Office of Research on Women’s Health (ORWH) (grants NR004061; AG012505, AG012535, AG012531, AG012539, AG012546, AG012553, AG012554, AG012495).
Clinical centers—University of Michigan, Ann Arbor, Michigan: MaryFran Sowers, Principal Investigator (PI); Massachusetts General Hospital, Boston, Massachusetts: Robert Neer, PI 1994–1999 and Joel Finkelstein, PI 1999–present; Rush University, Rush University Medical Center, Chicago, Illinois: Lynda Powell, PI 1994–2009 and Howard Kravitz, PI 2009–present; University of California, Davis/Kaiser Permanente, Davis, California: Ellen Gold, PI; University of California, Los Angeles, California: Gail Greendale, PI; University of Medicine and Dentistry–New Jersey Medical School, Newark, New Jersey: Gerson Weiss, PI 1994–2004 and Nanette Santoro, PI 2004–present; and the University of Pittsburgh, Pittsburgh, Pennsylvania: Karen Matthews, PI. NIH Program Office—National Institute on Aging, Bethesda, Maryland: Marcia Ory, 1994–2001 and Sherry Sherman, 1994–present, Program Officers; National Institute of Nursing Research, Bethesda, Maryland. Coordinating center—New England Research Institutes, Watertown, Massachusetts: Sonja McKinlay, PI 1995–2001; University of Pittsburgh, Pittsburgh, Pennsylvania: Kim Sutton-Tyrrell, PI 2001–present. Steering Committee—Chris Gallagher, Chair; Susan Johnson, Chair.
The content of this article is solely the responsibility of the authors and does not necessarily represent the official views of the NIA, NINR, ORWH, or NIH.
Conflict of interest: none declared.
Glossary
Abbreviations
- BMI
body mass index
- CI
confidence interval
- OR
odds ratio
- SHBG
sex hormone-binding globulin
- SWAN
Study of Women's Health Across the Nation
References
- 1.Flegal KM, Carroll MD, Ogden CL, et al. Prevalence and trends in obesity among US adults, 1999–2000. JAMA. 2002;288(14):1723–1727. doi: 10.1001/jama.288.14.1723. [DOI] [PubMed] [Google Scholar]
- 2.Ogden CL, Flegal KM, Carroll MD, et al. Prevalence and trends in overweight among US children and adolescents, 1999–2000. JAMA. 2002;288(14):1728–1732. doi: 10.1001/jama.288.14.1728. [DOI] [PubMed] [Google Scholar]
- 3.Kurth T, Gaziano JM, Berger K, et al. Body mass index and the risk of stroke in men. Arch Intern Med. 2002;162(22):2557–2562. doi: 10.1001/archinte.162.22.2557. [DOI] [PubMed] [Google Scholar]
- 4.Dey DK, Rothenberg E, Sundh V, et al. Waist circumference, body mass index, and risk for stroke in older people: a 15 year longitudinal population study of 70-year-olds. J Am Geriatr Soc. 2002;50(9):1510–1518. doi: 10.1046/j.1532-5415.2002.50406.x. [DOI] [PubMed] [Google Scholar]
- 5.Wilson PW, D'Agostino RB, Sullivan L, et al. Overweight and obesity as determinants of cardiovascular risk: the Framingham experience. Arch Intern Med. 2002;162(16):1867–1872. doi: 10.1001/archinte.162.16.1867. [DOI] [PubMed] [Google Scholar]
- 6.Stevens J, Cai J, Evenson KR, et al. Fitness and fatness as predictors of mortality from all causes and from cardiovascular disease in men and women in the lipid research clinics study. Am J Epidemiol. 2002;156(9):832–841. doi: 10.1093/aje/kwf114. [DOI] [PubMed] [Google Scholar]
- 7.Gungor N, Thompson T, Sutton-Tyrrell K, et al. Early signs of cardiovascular disease in youth with obesity and type 2 diabetes. Diabetes Care. 2005;28(5):1219–1221. doi: 10.2337/diacare.28.5.1219. [DOI] [PMC free article] [PubMed] [Google Scholar]
- 8.Levent E, Gökşen D, Ozyürek AR, et al. Stiffness of the abdominal aorta in obese children. J Pediatr Endocrinol Metab. 2002;15(4):405–409. doi: 10.1515/JPEM.2002.15.4.405. [DOI] [PubMed] [Google Scholar]
- 9.Wildman RP, Schott LL, Brockwell S, et al. A dietary and exercise intervention slows menopause-associated progression of subclinical atherosclerosis as measured by intima-media thickness of the carotid arteries. J Am Coll Cardiol. 2004;44(3):579–585. doi: 10.1016/j.jacc.2004.03.078. (Comment in J Am Coll Cardiol. 2004;44(3):586 –587) [DOI] [PubMed] [Google Scholar]
- 10.Nemetz PN, Roger VL, Ransom JE, et al. Recent trends in the prevalence of coronary disease: a population-based autopsy study of nonnatural deaths. Arch Intern Med. 2008;168(3):264–270. doi: 10.1001/archinternmed.2007.79. [DOI] [PubMed] [Google Scholar]
- 11.Sturm R. Increases in clinically severe obesity in the United States, 1986–2000. Arch Intern Med. 2003;163(18):2146–2148. doi: 10.1001/archinte.163.18.2146. [DOI] [PubMed] [Google Scholar]
- 12.Must A, Spadano J, Coakley EH, et al. The disease burden associated with overweight and obesity. JAMA. 1999;282(16):1523–1529. doi: 10.1001/jama.282.16.1523. [DOI] [PubMed] [Google Scholar]
- 13.McTigue K, Larson JC, Valoski A, et al. Mortality and cardiac and vascular outcomes in extremely obese women. JAMA. 2006;296(1):79–86. doi: 10.1001/jama.296.1.79. [DOI] [PubMed] [Google Scholar]
- 14.Freedman DS, Khan LK, Serdula MK, et al. Trends and correlates of class 3 obesity in the United States from 1990 through 2000. JAMA. 2002;288(14):1758–1761. doi: 10.1001/jama.288.14.1758. [DOI] [PubMed] [Google Scholar]
- 15.Trémollieres FA, Pouilles JM, Ribot CA. Relative influence of age and menopause on total and regional body composition changes in postmenopausal women. Am J Obstet Gynecol. 1996;175(6):1594–1600. doi: 10.1016/s0002-9378(96)70111-4. [DOI] [PubMed] [Google Scholar]
- 16.Sowers M, Zheng H, Tomey K, et al. Changes in body composition in women over six years at midlife: ovarian and chronological aging. J Clin Endocrinol Metab. 2007;92(3):895–901. doi: 10.1210/jc.2006-1393. [DOI] [PMC free article] [PubMed] [Google Scholar]
- 17. Clinical guidelines on the identification, evaluation, and treatment of overweight and obesity in adults—the evidence report. National Institutes of Health. Obes Res. 1998;6(suppl 2):51S–209S. (Erratum in Obes Res. 1998;6(6):464) [PubMed] [Google Scholar]
- 18.Lovejoy JC, Sainsbury A. Stock Conference 2008 Working Group. Sex differences in obesity and the regulation of energy homeostasis. Obes Rev. 2009;10(2):154–167. doi: 10.1111/j.1467-789X.2008.00529.x. [DOI] [PubMed] [Google Scholar]
- 19.Wing RR, Matthews KA, Kuller LH, et al. Weight gain at the time of menopause. Arch Intern Med. 1991;151(1):97–102. [PubMed] [Google Scholar]
- 20.Sternfeld B, Wang H, Quesenberry CP, Jr., et al. Physical activity and changes in weight and waist circumference in midlife women: findings from the Study of Women's Health Across the Nation. Am J Epidemiol. 2004;160(9):912–922. doi: 10.1093/aje/kwh299. [DOI] [PubMed] [Google Scholar]
- 21.Douchi T, Yamamoto S, Nakamura S, et al. The effect of menopause on regional and total body lean mass. Maturitas. 1998;29(3):247–252. doi: 10.1016/s0378-5122(98)00035-8. [DOI] [PubMed] [Google Scholar]
- 22.Douchi T, Yamamoto S, Yoshimitsu N, et al. Relative contribution of aging and menopause to changes in lean and fat mass in segmental regions. Maturitas. 2002;42(4):301–306. doi: 10.1016/s0378-5122(02)00161-5. [DOI] [PubMed] [Google Scholar]
- 23.Lovejoy JC, Champagne CM, de Jonge L, et al. Increased visceral fat and decreased energy expenditure during the menopausal transition. Int J Obes (Lond) 2008;32(6):949–958. doi: 10.1038/ijo.2008.25. [DOI] [PMC free article] [PubMed] [Google Scholar]
- 24.Sowers MR, Randolph J, Jr., Jannausch M, et al. Levels of sex steroid and cardiovascular disease measures in premenopausal and hormone-treated women at mid-life: implications for the “timing hypothesis”. Arch Intern Med. 2008;168(9):2146–2153. doi: 10.1001/archinte.168.19.2146. [DOI] [PMC free article] [PubMed] [Google Scholar]
- 25.Svendsen OL, Hassager C, Christiansen C. Age- and menopause-associated variations in body composition and fat distribution in healthy women as measured by dual-energy X-ray absorptiometry. Metabolism. 1995;44(3):369–373. doi: 10.1016/0026-0495(95)90168-x. [DOI] [PubMed] [Google Scholar]
- 26.Randolph JF, Jr., Sowers M, Gold EB, et al. Reproductive hormones in the early menopausal transition: relationship to ethnicity, body size, and menopausal status. J Clin Endocrinol Metab. 2003;88(4):1516–1522. doi: 10.1210/jc.2002-020777. [DOI] [PubMed] [Google Scholar]
- 27.Sowers MR, Jannausch M, McConnell D, et al. Hormone predictors of bone mineral density changes during the menopausal transition. J Clin Endocrinol Metab. 2006;91(4):1261–1267. doi: 10.1210/jc.2005-1836. [DOI] [PubMed] [Google Scholar]
- 28.Sowers MF, Crawford S, Sternfeld B, et al. SWAN: a multicenter, multiethnic, community-based cohort study of women and the menopausal transition. In: Lobo RA, Kelsey J, Marcus R, editors. Menopause: Biology and Pathobiology. San Diego, CA: Academic Press; 2000. pp. 175–188. [Google Scholar]
- 29.World Health Organization. Geneva, Switzerland: World Health Organization; 1996. Research on the menopause in the 1990s. Report of a WHO Scientific Group. (WHO technical report series 866) [PubMed] [Google Scholar]
- 30.Ferris BG. Epidemiology Standardization Project (American Thoracic Society) Am Rev Respir Dis. 1978;118(6 pt 2):1–120. [PubMed] [Google Scholar]
- 31.Sternfeld B, Ainsworth B, Quesenberry CP., Jr. Physical activity patterns in a diverse population of women. Prev Med. 1999;28(3):313–323. doi: 10.1006/pmed.1998.0470. [DOI] [PubMed] [Google Scholar]
- 32.Baecke JA, Burema J, Frijters JE. A short questionnaire for the measurement of habitual physical activity in epidemiological studies. Am J Clin Nutr. 1982;36(5):936–942. doi: 10.1093/ajcn/36.5.936. [DOI] [PubMed] [Google Scholar]
- 33.Kaplan EL, Meier P. Nonparametric estimation from incomplete observations. J Am Stat Assoc. 1958;53(282):457–481. [Google Scholar]
- 34.Cox DR. Regression models and life tables (with discussion) J R Stat Soc (B) 1972;34:187–220. [Google Scholar]
- 35.Allison PD. Survival Analysis Using the SAS System: A Practical Guide. Cary, NC: SAS Institute, Inc; 1995. [Google Scholar]
- 36.Hosmer DW, Lemeshow S. Applied Logistic Regression. 2nd ed. New York, NY: John Wiley & Sons; 2000. [Google Scholar]
- 37.Hendrix SL. Bilateral oophorectomy and premature menopause. Am J Med. 2005;118(12 suppl. 2):131–135. doi: 10.1016/j.amjmed.2005.09.056. [DOI] [PubMed] [Google Scholar]
- 38.Weel AE, Uitterlinden AG, Westendorp IC, et al. Estrogen receptor polymorphism predicts the onset of natural and surgical menopause. J Clin Endocrinol Metab. 1999;84(9):3146–3150. doi: 10.1210/jcem.84.9.5981. [DOI] [PubMed] [Google Scholar]
- 39.Thurston RC, Matthews KA, Hernandez J, et al. Improving the performance of physiologic hot flash measures with support vector machines. Psychophysiology. 2009;46(2):285–292. doi: 10.1111/j.1469-8986.2008.00770.x. [DOI] [PMC free article] [PubMed] [Google Scholar]
- 40.Thurston RC, Sowers MR, Sutton-Tyrrell K, et al. Abdominal adiposity and hot flashes among midlife women. Menopause. 2008;15(3):429–434. doi: 10.1097/gme.0b013e31815879cf. [DOI] [PMC free article] [PubMed] [Google Scholar]
- 41.Dunaif A. Insulin resistance and the polycystic ovary syndrome: mechanism and implications for pathogenesis. Endocr Rev. 1997;18(6):774–800. doi: 10.1210/edrv.18.6.0318. [DOI] [PubMed] [Google Scholar]
- 42.Janssen I, Powell LH, Crawford S, et al. Menopause and the metabolic syndrome: the Study of Women's Health Across the Nation. Arch Intern Med. 2008;168(14):1568–1575. doi: 10.1001/archinte.168.14.1568. [DOI] [PMC free article] [PubMed] [Google Scholar]
- 43.Torréns JI, Sutton-Tyrrell K, Zhao X, et al. Relative androgen excess during the menopausal transition predicts incident metabolic syndrome in midlife women: Study of Women's Health Across the Nation. Menopause. 2009;16(2):257–264. doi: 10.1097/gme.0b013e318185e249. [DOI] [PMC free article] [PubMed] [Google Scholar]
- 44.Fogle RH, Stanczyk FZ, Zhang X, et al. Ovarian androgen production in postmenopausal women. J Clin Endocrinol Metab. 2007;92(8):3040–3043. doi: 10.1210/jc.2007-0581. [DOI] [PubMed] [Google Scholar]
- 45.Moran C, Renteria JL, Moran S, et al. Obesity differentially affects serum levels of androstenedione and testosterone in polycystic ovary syndrome. Fertil Steril. 2008;90(6):2310–2317. doi: 10.1016/j.fertnstert.2007.09.016. [DOI] [PubMed] [Google Scholar]
- 46.Havelock JC, Rainey WE, Bradshaw KD, et al. The post-menopausal ovary displays a unique pattern of steroidogenic enzyme expression. Hum Reprod. 2006;21(1):309–317. doi: 10.1093/humrep/dei373. [DOI] [PubMed] [Google Scholar]
- 47.Pabon JE, Li X, Lei ZM, et al. Novel presence of luteinizing hormone/chorionic gonadotropin receptors in human adrenal glands. J Clin Endocrinol Metab. 1996;81(6):2397–2400. doi: 10.1210/jcem.81.6.8964884. [DOI] [PubMed] [Google Scholar]
- 48.Rao Ch V, Zhou XL, Lei ZM. Functional luteinizing hormone/chorionic gonadotropin receptors in human adrenal cortical H295R cells. Biol Reprod. 2004;71(2):579–587. doi: 10.1095/biolreprod.104.027300. [DOI] [PubMed] [Google Scholar]
- 49.Zang H, Carlström K, Arner P, et al. Effects of treatment with testosterone alone or in combination with estrogen on insulin sensitivity in postmenopausal women. Fertil Steril. 2006;86(1):136–144. doi: 10.1016/j.fertnstert.2005.12.039. [DOI] [PubMed] [Google Scholar]
- 50.Quinkler M, Sinha B, Tomlinson JW, et al. Androgen generation in adipose tissue in women with simple obesity—a site-specific role for 17beta-hydroxysteroid dehydrogenase type 5. J Endocrinol. 2004;183(2):331–342. doi: 10.1677/joe.1.05762. [DOI] [PubMed] [Google Scholar]
- 51.Plymate SR, Matej LA, Jones RE, et al. Inhibition of sex hormone-binding globulin production in the human hepatoma (Hep G2) cell line by insulin and prolactin. J Clin Endocrinol Metab. 1988;67(3):460–464. doi: 10.1210/jcem-67-3-460. [DOI] [PubMed] [Google Scholar]
- 52.Loukovaara M, Carson M, Adlercreutz H. Regulation of production and secretion of sex hormone-binding globulin in HepG2 cell cultures by hormones and growth factors. J Clin Endocrinol Metab. 1995;80(1):160–164. doi: 10.1210/jcem.80.1.7829605. [DOI] [PubMed] [Google Scholar]
- 53.Sternfeld B, Bhat AK, Wang H, et al. Menopause, physical activity, and body composition/fat distribution in midlife women. Med Sci Sports Exerc. 2005;37(7):1195–1202. doi: 10.1249/01.mss.0000170083.41186.b1. [DOI] [PubMed] [Google Scholar]
- 54.Lindgärde F, Malmquist J, Balke B. Physical fitness, insulin secretion, and glucose tolerance in healthy males and mild type-2 diabetes. Acta Diabetol Lat. 1983;20(1):33–40. doi: 10.1007/BF02629127. [DOI] [PubMed] [Google Scholar]
- 55.Koivisto VA, Yki-Jarvinen H, DeFronzo RA. Physical training and insulin sensitivity. Diabetes Metab Rev. 1986;1(4):445–481. doi: 10.1002/dmr.5610010407. [DOI] [PubMed] [Google Scholar]
- 56.Brown MD, Moore GE, Korytkowski MT, et al. Improvement of insulin sensitivity by short-term exercise training in hypertensive African American women. Hypertension. 1997;30(6):1549–1553. doi: 10.1161/01.hyp.30.6.1549. [DOI] [PubMed] [Google Scholar]
- 57.Miller JP, Pratley RE, Goldberg AP, et al. Strength training increases insulin action in healthy 50- to 65-yr-old men. J Appl Physiol. 1994;77(3):1122–1127. doi: 10.1152/jappl.1994.77.3.1122. [DOI] [PubMed] [Google Scholar]
- 58.Arterburn DE, McDonell MB, Hedrick SC, et al. Association of body weight with condition-specific quality of life in male veterans. Am J Med. 2004;117(10):738–746. doi: 10.1016/j.amjmed.2004.06.031. [DOI] [PubMed] [Google Scholar]
- 59.Fine JT, Colditz GA, Coakley EH, et al. A prospective study of weight change and health-related quality of life in women. JAMA. 1999;282(22):2136–2142. doi: 10.1001/jama.282.22.2136. [DOI] [PubMed] [Google Scholar]