

Abstract
Odds ratios for head and neck cancer increase with greater cigarette and alcohol use and lower body mass index (BMI; weight (kg)/height2 (m2)). Using data from the International Head and Neck Cancer Epidemiology Consortium, the authors conducted a formal analysis of BMI as a modifier of smoking- and alcohol-related effects. Analysis of never and current smokers included 6,333 cases, while analysis of never drinkers and consumers of ≤10 drinks/day included 8,452 cases. There were 8,000 or more controls, depending on the analysis. Odds ratios for all sites increased with lower BMI, greater smoking, and greater drinking. In polytomous regression, odds ratios for BMI (P = 0.65), smoking (P = 0.52), and drinking (P = 0.73) were homogeneous for oral cavity and pharyngeal cancers. Odds ratios for BMI and drinking were greater for oral cavity/pharyngeal cancer (P < 0.01), while smoking odds ratios were greater for laryngeal cancer (P < 0.01). Lower BMI enhanced smoking- and drinking-related odds ratios for oral cavity/pharyngeal cancer (P < 0.01), while BMI did not modify smoking and drinking odds ratios for laryngeal cancer. The increased odds ratios for all sites with low BMI may suggest related carcinogenic mechanisms; however, BMI modification of smoking and drinking odds ratios for cancer of the oral cavity/pharynx but not larynx cancer suggests additional factors specific to oral cavity/pharynx cancer.
Keywords: alcohol drinking; body mass index; laryngeal neoplasms; models, statistical; mouth neoplasms; odds ratio; pharyngeal neoplasms; smoking
There is consistent evidence that lower body mass index (BMI; weight (kg)/height2 (m2)) increases odds ratios for head and neck cancer (1–10); however, these results are controversial, since they were derived from case-control studies and had the potential for differential recall bias of BMI, reverse causality (i.e., disease-induced changes in BMI), and incomplete adjustment for cigarette use and alcohol consumption, 2 well-documented risk factors (11–13). In a recent analysis of pooled data from 16 case-control studies, odds ratios for head and neck cancer were inversely associated with BMI in all subjects, in never smokers and drinkers, and in ever smokers and drinkers (10). In this report, we further explore BMI-related associations in those data using models that characterize odds ratios by total exposure (pack-years of smoking and drink-years of alcohol consumption) and delivery rate (number of cigarettes smoked per day (cigarettes/day) for fixed pack-years and number of alcoholic drinks consumed per day (drinks/day) for fixed drink-years)—that is, increasing exposure rate and decreasing duration for a fixed total exposure. We consider 2 issues: 1) site-specific differences in odds ratios for cancers of the larynx, oral cavity, and pharynx by BMI, smoking, and drinking; and 2) the influence of BMI on site-specific odds ratios by smoking and alcohol consumption (i.e., whether BMI modifies the smoking and alcohol consumption associations). Our analysis represents a formal evaluation of BMI as an effect modifier of the smoking and drinking associations, particularly whether variations with BMI derive from total exposure (pack-years or drink-years), exposure rate (cigarettes/day or drinks/day), or both.
MATERIALS AND METHODS
Study data
We used pooled data from the International Head and Neck Cancer Epidemiology (INHANCE) Consortium (http://inhance.iarc.fr/), a consortium of molecular epidemiologic studies of head and neck cancer (10, 14, 15). The analyses included 15 case-control studies (see Table 1 in Hashibe et al. (14)), omitting a French study (16) used in the analysis by Gaudet et al. (10) because it did not enroll never smokers and an Iowa study (17) because it did not collect data on BMI, but adding the INHANCE US Multicenter Study (18).
Table 1.
Odds Ratios for Cancers of the Oral Cavity, Pharynx, and Larynx According to Body Mass Index, Cigarette Smoking, and Alcohol Drinking, by Cancer Site, Derived Using Case-Control Data From the International Head and Neck Cancer Epidemiology Consortium
| No. of Casesa |
No. of Controlsa |
Oral Cavity |
Pharyx |
Larynx |
|||||||
| Oral Cavity | Pharyx | Larynx | Oral Cavity/Pharyxb | Larynx | ORc | 95% CI | ORc | 95% CI | ORc | 95% CI | |
| BMId,e | |||||||||||
| <18.5 | 307 | 205 | 80 | 325 | 150 | 2.58 | 2.0, 3.4 | 2.68 | 2.0, 3.6 | 1.69 | 1.1, 2.5 |
| 18.5–24.9f | 1,352 | 1,612 | 1,011 | 6,065 | 4,180 | 1.00 | 1.00 | 1.00 | |||
| 25.0–29.9 | 651 | 938 | 666 | 6,044 | 4,533 | 0.52 | 0.5, 0.6 | 0.57 | 0.5, 0.6 | 0.63 | 0.5, 0.7 |
| 30.0–34.9 | 187 | 259 | 164 | 1,827 | 1,406 | 0.50 | 0.4, 0.6 | 0.52 | 0.4, 0.6 | 0.58 | 0.5, 0.7 |
| 35.0–39.9 | 42 | 50 | 39 | 369 | 291 | 0.58 | 0.4, 0.9 | 0.46 | 0.3, 0.7 | 0.66 | 0.4, 1.1 |
| ≥40.0 | 24 | 25 | 12 | 164 | 136 | 0.76 | 0.4, 1.3 | 0.44 | 0.3, 0.7 | 0.60 | 0.3, 1.3 |
| P for linear trend | <0.01 | <0.01 | <0.01 | ||||||||
| Pack-yearsg | |||||||||||
| 0f | 387 | 459 | 107 | 5,959 | 4,373 | 1.00 | 1.00 | 1.00 | |||
| 1–29 | 399 | 469 | 282 | 1,764 | 1,343 | 3.19 | 2.5, 4.0 | 2.48 | 2.0, 3.0 | 7.03 | 5.1, 9.6 |
| 30–39 | 264 | 298 | 264 | 608 | 455 | 5.90 | 4.3, 8.1 | 3.35 | 2.5, 4.4 | 14.3 | 9.9, 20.6 |
| 40–49 | 231 | 283 | 232 | 451 | 324 | 7.08 | 4.9, 10.3 | 3.92 | 2.8, 5.5 | 16.8 | 11.0, 25.5 |
| 50–59 | 166 | 197 | 152 | 247 | 145 | 6.91 | 4.4, 10.8 | 4.19 | 2.8, 6.3 | 23.2 | 14.0, 38.5 |
| ≥60 | 425 | 571 | 319 | 473 | 270 | 10.1 | 6.1, 16.7 | 4.09 | 2.6, 6.5 | 21.7 | 12.3, 38.4 |
| P for linear trend | <0.01 | <0.01 | <0.01 | ||||||||
| Cigarettes/dayh | |||||||||||
| 1–19f | 409 | 501 | 413 | 1,664 | 1,292 | 1.00 | 1.00 | 1.00 | |||
| 20–29 | 565 | 579 | 486 | 1,186 | 833 | 1.25 | 1.0, 1.6 | 1.21 | 0.9, 1.5 | 1.54 | 1.2, 2.0 |
| 30–39 | 188 | 297 | 165 | 324 | 202 | 1.08 | 0.7, 1.7 | 1.85 | 1.2, 2.7 | 1.58 | 1.0, 2.6 |
| ≥40 | 323 | 441 | 185 | 369 | 210 | 0.98 | 0.6, 1.6 | 1.88 | 1.2, 3.0 | 1.90 | 1.1, 3.3 |
| P for linear trend | 0.51 | 0.02 | <0.01 | ||||||||
| Drink-yearsi | |||||||||||
| 0f | 658 | 406 | 243 | 4,049 | 2,783 | 1.00 | 1.00 | 1.00 | |||
| 1–49 | 774 | 971 | 536 | 5,707 | 3,766 | 1.04 | 0.9, 1.3 | 1.30 | 1.1, 1.5 | 0.98 | 0.8, 1.2 |
| 50–99 | 359 | 499 | 264 | 1,985 | 1,594 | 1.66 | 1.2, 2.3 | 1.50 | 1.1, 2.0 | 0.94 | 0.6, 1.4 |
| 100–149 | 247 | 342 | 221 | 1,156 | 954 | 2.24 | 1.5, 3.3 | 1.41 | 1.0, 2.0 | 1.20 | 0.8, 1.8 |
| 150–199 | 177 | 274 | 201 | 738 | 628 | 2.81 | 1.8, 4.4 | 1.57 | 1.1, 2.3 | 1.35 | 0.8, 2.2 |
| ≥200 | 348 | 597 | 508 | 1,159 | 971 | 3.22 | 2.0, 5.2 | 1.96 | 1.3, 3.0 | 1.80 | 1.1, 3.1 |
| P for linear trend | <0.01 | <0.01 | <0.01 | ||||||||
| Drinks/dayj | |||||||||||
| 0.01–0.9f | 691 | 704 | 390 | 4,420 | 2,783 | 1.00 | 1.00 | 1.00 | |||
| 1–2.9 | 563 | 738 | 435 | 3,298 | 2,571 | 1.26 | 1.0, 1.6 | 1.52 | 1.3, 1.9 | 1.05 | 0.8, 1.4 |
| 3.0–4.9 | 315 | 498 | 322 | 1,590 | 1,347 | 1.29 | 0.9, 1.8 | 2.30 | 1.7, 3.1 | 1.08 | 0.7, 1.6 |
| 5.0–10.0 | 436 | 743 | 583 | 1,437 | 1,206 | 1.87 | 1.2, 3.9 | 3.67 | 2.6, 5.3 | 1.64 | 1.0, 2.6 |
| P for linear trend | <0.01 | <0.01 | <0.01 | ||||||||
Abbreviations: BMI, body mass index; CI, confidence interval; OR, odds ratio.
Total numbers vary because of missing data.
A common control group was used for cancers of the oral cavity and pharynx.
Adjusted for study/center, education, age, and sex.
Weight (kg)/height2 (m2).
Never drinkers and consumers of ≤10 drinks/day. ORs were additionally adjusted for pack-years of smoking, cigarettes/day, use of other tobacco products, years since cessation of smoking, drink-years, and drinks/day.
Reference category.
Never smokers and current smokers of cigarettes only. ORs were additionally adjusted for BMI, drink-years, drinks/day, and cigarettes/day.
Never smokers and current smokers of cigarettes only. ORs were additionally adjusted for BMI, drink-years, drinks/day, and pack-years of smoking.
Never drinkers and consumers of ≤10 drinks/day. ORs were additionally adjusted for BMI, pack-years of smoking, cigarettes/day, and drinks/day.
Never drinkers and consumers of ≤10 drinks/day. ORs were additionally adjusted for BMI, pack-years of smoking, cigarettes/day, and drink-years.
Cases included invasive tumors classified as cancers of the oral cavity, oropharynx, hypopharynx, oral cavity or pharynx, not otherwise specified, or larynx or head and neck cancer, unspecified. We excluded cancers of the salivary gland. In their paper, Hashibe et al. (14) provide additional information on disease classification.
For analyses of BMI and smoking, we restricted data to never and current smokers of cigarettes only, to eliminate complications arising from inclusion of former smokers and users of other tobacco products. We conducted a subgroup analysis of never smokers and smokers of ≥10 cigarettes/day, since previous analyses indicated that light smokers could distort models because of increased variability from a limited range of pack-years. For analyses of BMI and alcohol consumption, we analyzed never drinkers and consumers of ≤10 drinks/day (95.8% of all controls) and never drinkers and consumers of ≤5 drinks/day (86.9% of all controls), since the small percentage of heavy drinkers contributed to unstable parameter estimates and since use of these cutpoints resulted in more parsimonious models.
Although it was self-reported, BMI information differed across studies. The majority of the studies (Milan (Italy), Aviano (Italy), Italy Multicenter, Switzerland, New York (New York), Tampa (Florida), Los Angeles (California), Houston (Texas), Boston (Massachusetts), US Multicenter, Puerto Rico, Latin America, and International Multicenter) ascertained BMI at enrollment, while other studies (Central Europe, New York, Seattle (Washington), Boston, Latin America, and International Multicenter) sought data on BMI for 2–5 years prior to enrollment. In the 4 studies (New York, Latin America, Boston, and International Multicenter) with both types of BMI data, the Pearson correlation coefficient for BMI at enrollment and BMI 2–5 years prior was 0.88. Since odds ratio patterns were similar for BMI at enrollment and BMI 2–5 years prior, we minimized missing data by using BMI at enrollment if available but BMI 2–5 years prior if the former was missing.
Statistical models
We fitted linear-exponential models for the excess odds ratio (EOR) for cancers of the oral cavity, pharynx, and larynx in total pack-years and cigarettes/day and in total drink-years and drinks/day as described previously (19). This approach disassembled the relation between outcome and total exposure (pack-years or drink-years) and delivery rate—that is, increasing exposure rate (cigarettes/day or drinks/day) and decreasing exposure duration (smoking or drinking) at a fixed total exposure. The approach contrasts with typical models that include exposure duration and exposure rate, where interpretation is problematic, since odds ratios by exposure rate with duration held constant necessarily embed the impact of increasing total exposure (15, 19).
We computed odds ratios relative to never smokers for a cross-classification of pack-years and cigarettes/day and observed that odds ratios by pack-years increased approximately linearly within each category of cigarettes/day (15). For continuous pack-years d, odds ratios (ORs) conformed to a linear relation—OR(d) = 1 + γi d—within each category (i = 1, …, I) of cigarettes/day. Each γi represented the EOR/pack-year, that is, the strength of the association. The set of parameters γ1, …, γI characterized the pack-years associations and variations by cigarettes/day. For continuous cigarettes/day x, we fitted the model
| (1) |
where β represents the EOR/pack-year at g(x) = 1 and g(.) describes the variation of the EOR/pack-year with cigarettes/day, that is, the influence of delivery rate (19). While several forms for g(.) fitted adequately, we used g(x) = exp{φ1 ln(x) + φ2 ln(x)2} for consistency with previous analyses.
We extended model 1 (equation 1) to evaluate effect modification by BMI level as
| (2) |
where distinct βf parameters and gf(.) functions (i.e., φ1f and φ2f) replace β and g(.), and where df equals d and xf equals x within level f and zero otherwise. In this way, we assessed whether effect modification resulted from total exposure (different β’s), exposure rate (different g(.) functions), or both.
For alcohol consumption, we found approximately linear increases in the odds ratios for drink-years within categories of drinks/day, with the estimated γi parameters increasing with drinks/day. Model 1 again proved satisfactory for describing odds ratios but required only φ1.
We used polytomous regression to test for homogeneity of category-specific odds ratios by BMI, smoking, and drinking across cancer sites.
Analyses were stratified on study/center (39 levels) and age (<40, 40–44, …, 70–74, ≥75 years), and results were adjusted for sex, education (none, some high school, high school graduation, technical school or some college, college graduation), and BMI (4 levels). For BMI and smoking, we additionally adjusted for drink-years (never drinking and quartiles of drink-years) and drinks/day (never drinking and <1.0, 1.0–2.9, 3.0–4.9, or ≥5.0 drinks/day). For BMI and alcohol consumption, we additionally adjusted for pack-years of smoking (never smoking and quartiles of pack-years) and cigarettes/day (never smoking and <20, 20–29, 30–39, or ≥40 cigarettes/day) and use of other tobacco products.
We used the Epicure software package for fitting models 1 and 2 (20) and SAS, version 9.1, for polytomous regression analyses (SAS Institute, Inc., Cary, North Carolina).
RESULTS
For analyses of BMI and smoking, there were 1,872 cases of oral cavity cancer, 2,277 cases of pharynx cancer, and 1,356 cases of larynx cancer. Controls numbered 9,502 for cases of oral cavity and pharynx cancer and 6,910 for cases of larynx cancer. Four studies (New York, Seattle, Puerto Rico, and International Multicenter) did not enroll laryngeal cancers, leading to fewer controls. For analyses of BMI and alcohol consumption, there were 2,563 cases of oral cavity cancer, 3,089 cases of pharynx cancer, and 1,972 cases of larynx cancer. Controls numbered 14,794 for cases of oral cavity and pharynx cancer and 10,696 for cases of larynx cancer. As described below, we combined oral cavity and pharyngeal cancers and included 828 cases classified as cancer of the oral cavity/pharynx not otherwise specified.
Odds ratios for BMI, smoking, and drinking
For each site, odds ratios relative to normal weight (BMI 18.5–24.9) were increased in underweight categories and decreased in the overweight categories, with the lowest odds ratios generally occurring in obese categories (BMI ≥30) (Table 1).
Odds ratios by pack-years of smoking were increased for all sites, with the greatest trend being observed for laryngeal cancer (Table 1). Odds ratios for ≥60 pack-years of smoking relative to never smoking were 10.1 for oral cavity cancer, 4.09 for pharynx cancer, and 21.7 for larynx cancer. After adjustment for pack-years of smoking, odds ratios by cigarettes/day relative to 1–19 cigarettes/day were increased significantly for pharyngeal and laryngeal cancers.
Odds ratios by drink-years were increased for all sites, with trends being greater for oral cavity and pharyngeal cancers. After adjustment for drink-years, odds ratios by drinks/day relative to less than 1 drink/day increased monotonically with drinks/day, suggesting that increasing number of drinks/day strengthened the drink-years association.
Although Table 1 suggested that odds ratios for oral cavity cancer, as compared with pharyngeal cancer, were greater for pack-years and drink-years but smaller for cigarettes/day and drinks/day, hypothesis tests using polytomous regression did not reject homogeneity of odds ratios for the 2 sites by BMI (P = 0.65), pack-years and cigarettes/day (P = 0.52), or drink-years and drinks/day (P = 0.73) (data not shown). Odds ratios for cancers of the oral cavity and pharynx combined differed significantly from odds ratios for laryngeal cancer by BMI (P < 0.01), smoking (P < 0.01), and drinking (P < 0.01). For the remaining analyses, we combined oral cavity and pharyngeal cancer cases.
Modification of pack-years and cigarettes/day effects by BMI
Figure 1 shows odds ratios by pack-years and by cigarettes/day within BMI categories, omitting 95% confidence intervals for clarity, to illustrate effect modification. (See Web Table 1, which is posted on the Journal's Web site (http://aje.oxfordjournals.org/), for odds ratios.) Odds ratio trends for cancers of the oral cavity/pharynx by pack-years and by cigarettes/day were generally greater with lower BMI (Figure 1, section A, top and bottom panels), while odds ratio trends for laryngeal cancer by pack-years and by cigarettes/day were unrelated to BMI (Figure 1, section B, top and bottom panels).
Figure 1.

Odds ratios for oral cavity/pharyngeal cancer (section A, top and bottom panels) and laryngeal cancer (section B, top and bottom panels) within categories of body mass index (BMI; weight (kg)/height2 (m2)), by pack-years of cigarette smoking (relative to never smoking) and by number of cigarettes smoked per day (relative to 1–19 cigarettes/day). ▪, BMI <18.5; •, BMI 18.5–24.9; ▴, BMI 25.0–29.9; ▾, BMI ≥30. Odds ratios were adjusted for sex, study/center, age, education, drink-years, drinks/day, BMI, and the complementary smoking factor, cigarettes/day or pack-years. Data were pooled data obtained from the International Head and Neck Cancer Epidemiology (INHANCE) Consortium and were limited to never smokers and current smokers of cigarettes only.
We used model 2 (equation 2) with pack-years and cigarettes/day to evaluate effect modification by BMI, both visually (Figure 2 and Web Table 2) and formally using likelihood ratio tests (Table 2). Model 2 closely fitted the cigarettes/day category-specific EOR/pack-year estimates (γi) (Figure 2, square symbol). Within each BMI category, the pack-years association (i.e., the EOR/pack-year estimates) diminished with increasing delivery rate above 15 cigarettes/day—that is, for fixed pack-years, a higher number of cigarettes/day for a shorter duration was less deleterious than a lower number of cigarettes/day for a longer duration.
Figure 2.
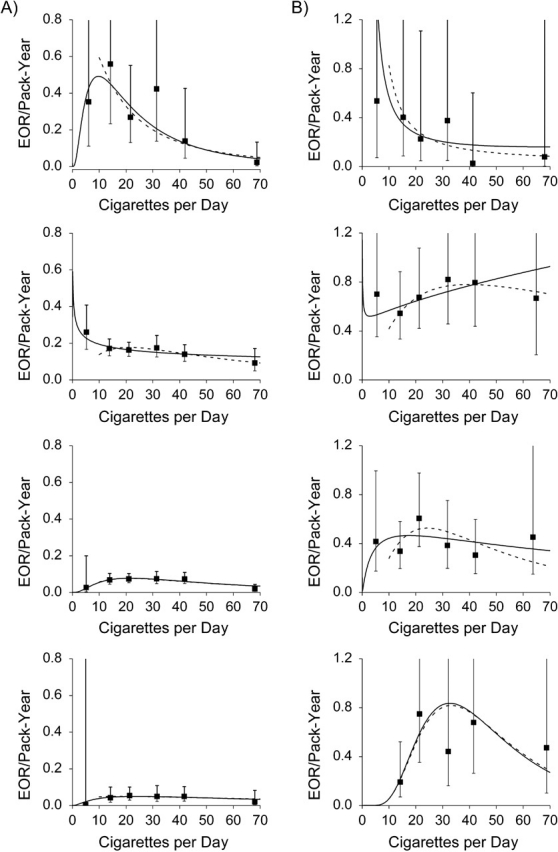
Estimated excess odds ratios (EORs) per pack-year of cigarette smoking for oral cavity/pharyngeal cancer (section A) and laryngeal cancer (section B), according to number of cigarettes smoked per day (▪), within categories of body mass index (weight (kg)/height2 (m2); <18.5, 18.5–24.9, 25.0–29.9, and ≥30 from top panel to bottom panel, respectively). The curved lines show results from model 1 for never smokers and current smokers of cigarettes only (solid line) and never smokers and smokers of ≥10 cigarettes/day (dashed line). Data were pooled data obtained from the International Head and Neck Cancer Epidemiology (INHANCE) Consortium and were limited to never smokers and current smokers of cigarettes only. Bars represent 95% confidence intervals.
Table 2.
Results From Modelinga of Excess Odds Ratios for Cancers of the Oral Cavity, Pharynx, and Larynx According to Cigarette Smoking (Pack-Years and Cigarettes/Day), by Body Mass Index Category, Derived Using Case-Control Data From the International Head and Neck Cancer Epidemiology Consortium
| Variable | Oral Cavity and Pharyngeal Cancer Cases and Controls |
Laryngeal Cancer Cases and Controls |
||||||||||
| Parameter Estimate |
Effect Modification by BMIb |
Parameter Estimate |
Effect Modification by BMI |
|||||||||
| βf | φ1f | φ2f | BMI Times:c | ΔDeviance (no.)d | P Valuee | βf | φ1f | φ2f | BMI Times:c | ΔDeviance (no.)d | P Valuee | |
| Never Smokers and Current Smokers of Cigarettes Only | ||||||||||||
| Total | 0.0170 | 1.436 | −0.270 | 0.2811 | 0.270 | −0.025 | ||||||
| BMI | ||||||||||||
| <18.5 | 0.0184 | 2.889 | −0.635 | Both | 0 (12) | 67.30 | −2.845 | 0.335 | Both | 0 (12) | ||
| 18.5–24.9 | 0.3441 | −0.262 | 0.006 | Cigarettes/day | 10.2 (9) | 0.02 | 0.5546 | −0.121 | 0.057 | Cigarettes/day | 18.9 (9) | <0.01 |
| 25.0–29.9 | 0.0003 | 3.647 | −0.593 | Pack-years | 14.3 (6) | 0.03 | 0.1238 | 0.925 | −0.162 | Pack-years | 25.6 (6) | <0.01 |
| ≥30 | 0.0015 | 2.192 | −0.345 | None | 72.5 (3) | <0.01 | 4.70 × 10⁻¹¹ | 13.54 | −1.942 | None | 29.7 (3) | <0.01 |
| BMI (omitting <18.5) | ||||||||||||
| 18.5–24.9 | 0.3971 | −0.334 | 0.017 | Both | 0 (9) | 0.5783 | −0.176 | 0.072 | Both | 0 (9) | ||
| 25.0–29.9 | 0.0003 | 3.567 | −0.581 | Cigarettes/day | 11.0 (7) | <0.01 | 0.1535 | 0.768 | −0.132 | Cigarettes/day | 14.5 (7) | <0.01 |
| ≥30 | 0.0014 | 2.228 | −0.347 | Pack-years | 8.3 (5) | 0.08 | 3.64 × 10⁻⁹ | 13.68 | −1.962 | Pack-years | 16.8 (5) | <0.01 |
| None | 60.4 (3) | <0.01 | None | 18.8 (3) | <0.01 | |||||||
| Never Smokers and Current Smokers of ≥10 Cigarettes/Day | ||||||||||||
| Total | 0.0019 | 2.779 | −0.470 | 0.0004 | 4.314 | −0.645 | ||||||
| BMI | ||||||||||||
| <18.5 | 0.4099 | 0.940 | −0.388 | Both | 0 (12) | 105.80 | −2.615 | 0.220 | Both | 0 (12) | ||
| 18.5–24.9 | 0.0027 | 2.758 | −0.453 | Cigarettes/day | 0.9 (9) | 0.82 | 0.0092 | 2.411 | −0.327 | Cigarettes/day | 6.9 (9) | 0.08 |
| 25.0–29.9 | 0.0004 | 3.388 | −0.557 | Pack-years | 7.4 (6) | 0.29 | 0.0001 | 5.138 | −0.805 | Pack-years | 12.3 (6) | 0.08 |
| ≥30 | 0.0103 | 1.093 | −0.189 | None | 64.4 (3) | <0.01 | 7.70 × 10⁻¹¹ | 13.19 | −1.884 | None | 15.3 (3) | 0.08 |
| BMI (omitting <18.5) | ||||||||||||
| 18.5–24.9 | 0.0031 | 2.668 | −0.440 | Both | 0 (9) | 0.0092 | 2.383 | −0.317 | Both | 0 (9) | ||
| 25.0–29.9 | 0.0005 | 3.293 | −0.541 | Cigarettes/day | 0.3 (7) | 0.88 | 0.0001 | 5.114 | −0.799 | Cigarettes/day | 5.8 (7) | 0.06 |
| ≥30 | 0.0062 | 1.384 | −0.229 | Pack-years | 0.5 (5) | 0.98 | 6.85 × 10⁻⁸ | 13.27 | −1.898 | Pack-years | 7.8 (5) | 0.10 |
| None | 52.5 (3) | <0.01 | None | 9.5 (3) | 0.15 | |||||||
Abbreviations: BMI, body mass index; EOR, excess odds ratio.
Model: EOR = βf d gf (x), with g(x) = exp{φ1 ln(x) + φ2 ln(x)2}, where d is pack-years and x is cigarettes/day. The subscript (f) denotes separate effects for levels of BMI. Results were adjusted for study/center, education, age, sex, BMI, drink-years, and drinks/day.
Weight (kg)/height2 (m2).
Effect modification of BMI by smoking, including: “both,” modification of BMI by pack-years and of BMI by cigarettes/day, βf d gf (x); “cigarettes/day,” modification of BMI by cigarettes/day, β d gf (x); “pack-years,” modification of BMI by pack-years, βf d g(x); and “none,” no effect modification, β d g(x).
Deviance change relative to the 12-parameter model βf d gf (x) and (in parentheses) number of parameters in the EOR.
P value from a likelihood ratio test relative to βf d gf (x), which included BMI modification for pack-years and cigarettes/day.
For oral cavity/pharyngeal cancer, EOR/pack-year estimates were higher in lower BMI categories (Table 2, P < 0.01). In smokers of ≥10 cigarettes/day, evaluation of effect modification of pack-years by BMI (P = 0.82) and of cigarettes/day by BMI (P = 0.29) revealed no preferential interaction. For laryngeal cancer, smoking associations varied significantly by BMI in the full data (P < 0.01); however, EOR/pack-year patterns exhibited no significant variation with BMI among smokers of ≥10 cigarettes/day (Table 2, P = 0.08; P = 0.15 for subjects with BMI ≥18.5). Finally, EOR/pack-year estimates were consistently greater for laryngeal cancer than for oral cavity/pharyngeal cancer, except among subjects with BMI less than 18.5, where data were limited (Figure 2).
Modification of drink-years and drinks/day effects by BMI
Except for BMI less than 18.5, odds ratios for oral cavity/pharyngeal cancer by drink-years and by drinks/day within BMI categories were consistently greater at lower BMIs (Figure 3, section A, top and bottom panels). For laryngeal cancer, odds ratios by drink-years and by drinks/day were similar across BMI categories (Figure 3, section B, top and bottom panels). (See Web Table 3 for odds ratios.)
Figure 3.

Odds ratios for oral cavity and pharyngeal cancer (section A, top and bottom panels) and laryngeal cancer (section B, top and bottom panels) within categories of body mass index (weight (kg)/height2 (m2)), by drink-years of alcohol consumption (relative to never drinking) and by number of drinks consumed per day (relative to 0.01–0.99 drinks/day). ▪, BMI <18.5; •, BMI 18.5–24.9; ▴, BMI 25.0–29.9; ▾, BMI ≥30. Odds ratios were adjusted for sex, study/center, age, education, pack-years of smoking, cigarettes/day, years since smoking cessation, use of other tobacco products, BMI, and the complementary drinking factor, drinks/day or drink-years. Data were pooled data obtained from the International Head and Neck Cancer Epidemiology (INHANCE) Consortium and were limited to never drinkers and consumers of ≤10 drinks/day.
Within each BMI category, the EOR/drink-year estimates and the fitted model 2 increased with increasing number of drinks/day, indicating that the strength of the disease association by drink-years increased with increasing drinks/day (Figure 4 and Web Table 4). The EOR/drink-year patterns for oral cavity/pharyngeal cancer were enhanced with decreasing BMI, while the patterns for laryngeal cancer did not vary with BMI, except possibly in the lowest BMI category.
Figure 4.
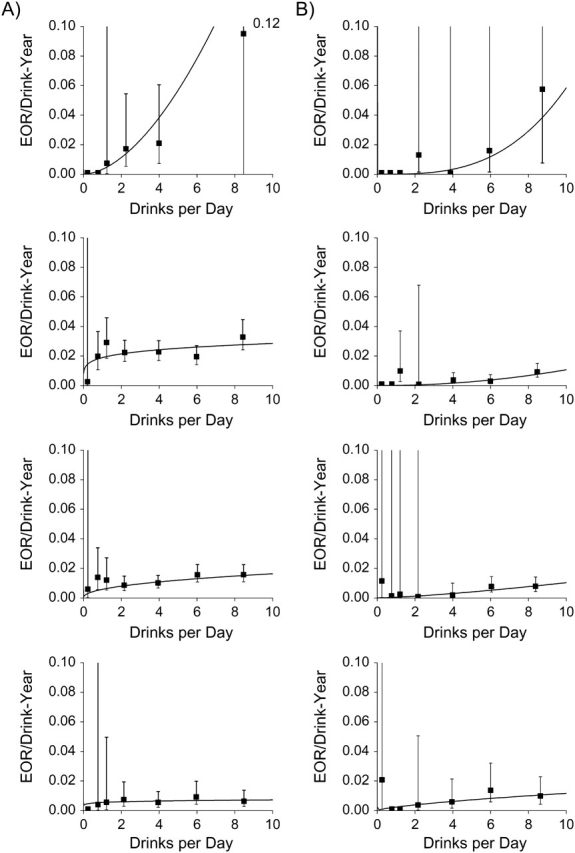
Estimated excess odds ratios (EORs) per drink-year of alcohol consumption for oral cavity/pharyngeal cancer (section A) and laryngeal cancer (section B) according to number of drinks consumed per day (▪), within categories of body mass index (weight (kg)/height2 (m2); <18.5, 18.5–24.9, 25.0–29.9, and ≥30 from top panel to bottom panel, respectively). The curved line shows results from model 1 for subjects consuming ≤10 drinks/day. Data were pooled data obtained from the International Head and Neck Cancer Epidemiology (INHANCE) Consortium and were limited to never drinkers and consumers of ≤10 drinks/day. Bars represent 95% confidence intervals.
For oral cavity/pharyngeal cancer, the EOR/drink-year patterns were significantly greater in leaner subjects (Table 3, P < 0.01). Effect modification resulted from the interaction between drink-years and BMI, while the impact of drinks/day was homogeneous across BMI. For example, with the ≤5 drinks/day restriction, homogeneity of the interaction between drink-years and BMI with adjustment for the interaction between drinks/day and BMI was rejected (P = 0.02), while homogeneity of the interaction between drinks/day and BMI with adjustment for the interaction between drink-years and BMI was not rejected (P = 0.85). For laryngeal cancer, BMI did not modify alcohol-related associations (Table 3; P = 0.59 in subjects with BMI ≥18.5, and P = 0.76 and P = 0.92 in consumers of ≤5 drinks/day overall and in data restricted to subjects with BMI ≥18.5, respectively).
Table 3.
Results From Modelinga of Excess Odd Ratios for Cancers of the Oral Cavity, Pharynx, and Larynx According to Alcohol Consumption (Drink-Years and Drinks/Day), by Body Mass Index Category, Derived Using Case-Control Data From the International Head and Neck Cancer Epidemiology Consortium
| Variable | Oral Cavity and Pharyngeal Cancer Cases and Controls |
Laryngeal Cancer Cases and Controls |
||||||||
| Parameter Estimate |
Effect Modification by BMIb |
Parameter Estimate |
Effect Modification by BMI |
|||||||
| βf | φ1f | BMI Times:c | ΔDeviance (no.)d | P Valuee | βf | φ1f | BMI Times:c | ΔDeviance (no.)d | P Valuee | |
| Never Drinkers and Consumers of ≤10 Drinks/Day | ||||||||||
| Total | 0.0113 | 0.248 | 0.0004 | 1.440 | ||||||
| BMI | ||||||||||
| <18.5 | 0.0033 | 1.761 | Both | 0 (8) | 4.54 × 10⁻⁵f | 3.110 | Both | 0 (8) | ||
| 18.5–24.9 | 0.0189 | 0.177 | Drinks/day | 14.0 (5) | <0.01 | 9.65 × 10⁻⁵ | 2.045 | Drinks/day | 12.5 (5) | 0.01 |
| 25.0–29.9 | 0.0058 | 0.448 | Drink-years | 9.3 (5) | 0.03 | 0.0005 | 1.342 | Drink-years | 12.8 (5) | 0.01 |
| ≥30 | 0.0055 | 0.116 | None | 58.9 (2) | <0.01 | 0.0024 | 0.688 | None | 15.1 (2) | 0.02 |
| BMI (omitting <18.5) | ||||||||||
| 18.5–24.9 | 0.0182 | 0.202 | Both | 0 (6) | 0.0001 | 2.011 | Both | 0 (6) | ||
| 25.0–29.9 | 0.0059 | 0.447 | Drinks/day | 11.4 (4) | <0.01 | 0.0005 | 1.330 | Drinks/day | 2.2 (4) | 0.33 |
| ≥30 | 0.0055 | 0.126 | Drink-years | 1.6 (4) | 0.46 | 0.0024 | 0.681 | Drink-years | 1.8 (4) | 0.42 |
| None | 43.5 (2) | <0.01 | None | 2.8 (2) | 0.59 | |||||
| Never Drinkers and Consumers of ≤5 Drinks/Day | ||||||||||
| Total | 0.0127 | 0.192 | 0.0007 | 0.946 | ||||||
| BMI | ||||||||||
| <18.5 | 0.0122 | 0.657 | Both | 0 (8) | 0.0136 | −1.510 | Both | 0 (8) | ||
| 18.5–24.9 | 0.0205 | 0.199 | Drinks/day | 10.3 (5) | 0.02 | 0.0006 | 1.204 | Drinks/day | 1.3 (5) | 0.72 |
| 25.0–29.9 | 0.0092 | 0.110 | Drink-years | 0.8 (5) | 0.85 | 3.58 × 10⁻⁵ | 2.838 | Drink-years | 2.7 (5) | 0.45 |
| ≥30 | 0.0041 | 0.271 | None | 37.5 (2) | <0.01 | 0.0032 | 0.057 | None | 3.4 (2) | 0.76 |
| BMI (omitting <18.5) | ||||||||||
| 18.5–24.9 | 0.0193 | 0.244 | Both | 0 (6) | 0.0006 | 1.179 | Both | 0 (6) | ||
| 25.0–29.9 | 0.0093 | 0.110 | Drinks/day | 8.8 (4) | 0.01 | 1.29 × 10⁻⁵ | 3.482 | Drinks/day | 0.8 (4) | 0.69 |
| ≥30 | 0.0041 | 0.290 | Drink-years | 0.3 (4) | 0.87 | 0.0038 | −0.056 | Drink-years | 0.7 (4) | 0.72 |
| None | 34.9 (2) | <0.01 | None | 1.0 (2) | 0.92 | |||||
Abbreviations: BMI, body mass index; EOR, excess odds ratio.
Model: EOR = βf d gf (x), with g(x) = exp{φ1 ln(x)}, where d is drink-years and x is drinks/day. The subscript (f) denotes separate effects for levels of BMI. Results were adjusted for study/center, education, age, sex, pack-years of smoking, cigarettes/day, years since cessation of smoking, and use of other tobacco products.
Weight (kg)/height2 (m2).
Effect modification of BMI by alcohol drinking, including: “both,” modification of BMI by drink-years and of BMI by drinks/day, βf d gf (x); “drinks/day,” modification of BMI by drinks/day, β d gf (x); “drink-years,” modification of BMI by drink-years, βf d g(x); and “none,” no effect modification, β d g(x).
Deviance change relative to the 8-parameter model βf d gf (x) and (in parentheses) number of parameters in the EOR.
P value from a likelihood ratio test relative to βf d gf (x), which included BMI modification for drink-years and drinks/day.
Model convergence required a constrained β.
Study-specific results
Increasing odds ratios with lower BMIs were generally consistent across studies (results not shown). The 10 studies including both oral cavity/pharyngeal and laryngeal cancers and the 5 studies including oral cavity/pharyngeal cancers only generated 25 parameter estimates for ln(BMI). There were 23 negative estimates of the ln(BMI) parameter, with 16 being statistically significant, and 2 nonsignificantly positive estimates. Odds ratios with BMI were steeper for oral cavity/pharyngeal cancer than for laryngeal cancer. In studies including both case types, 9 of 10 parameter estimates for ln(BMI) were smaller for oral cavity/pharynx cancers, indicating a steeper trend in odds ratios, with 3 tests of homogeneity being rejected.
We evaluated study-specific interactions between smoking and BMI by adding ln(BMI) to g(.) in model 1. Among never smokers and smokers of ≥10 cigarettes/day and for oral cavity/pharyngeal cancer, all parameter estimates were negative, denoting an inverse association—that is, an increasing magnitude of the effect of smoking with decreasing BMI, with 8 of 15 tests being statistically significant. For laryngeal cancer, the estimated parameter for ln(BMI) was negative for 5 studies and positive for 5 studies, with all hypothesis tests being nonsignificant. Study-specific results were thus consistent with pooled results, indicating an interaction between smoking and BMI for oral cavity/pharyngeal cancer but not for laryngeal cancer.
For the study-specific interaction between drinking and BMI and for oral cavity/pharyngeal cancer, all parameter estimates for ln(BMI) were negative, and 14 of 15 tests were significant. For laryngeal cancer, 8 of 10 parameter estimates were negative, with 4 being significant. The study-specific results were consistent with pooled results in suggesting an inverse association—that is, an increasing magnitude of the effects of drinking with decreasing BMI, primarily in oral cavity/pharyngeal cases.
DISCUSSION
In previous analyses of these data (10), as well as analyses by other investigators (1–9), researchers have reported increasing odds ratios for head and neck cancer with increasing leanness. In addition, analyses have indicated homogeneity of smoking-related and alcohol-related patterns of association for oral cavity and pharyngeal cancers (9, 15). Our analysis of 15 case-control studies extended these observations in several important ways, suggesting that: 1) trends in odds ratios with BMI, as well as smoking and drinking, were homogeneous for oral cavity and pharyngeal cancers; 2) the trend in odds ratios with lower BMI was greater for oral cavity/pharyngeal cancer than for laryngeal cancer; 3) leanness significantly enhanced smoking- and alcohol-related associations for oral cavity/pharyngeal cancer but did not modify smoking- and alcohol-related associations for laryngeal cancer; and 4) the modification of associations between alcohol and oral cavity/pharyngeal cancer by BMI was derived from differential effects of drink-years, with the relative effects of delivery rate (increasing drinks/day with decreasing duration) being homogeneous by BMI.
Precise biologic mechanisms for the association between head and neck cancers and BMI are unknown, but they may involve altered calorie absorption and utilization, increased oxidative stress (21, 22), and increased numbers of DNA adducts (10). Since in our analysis odds ratios increased with low BMI in never drinkers and never smokers (10), as well as after extensive adjustment for smoking and drinking, the disease-related influence of BMI appears at least partially distinct from mechanisms involving smoking and drinking. However, since lower BMI significantly enhanced smoking- and alcohol-related associations for oral cavity/pharyngeal cancer but not for laryngeal cancer, there must be additional site-specific factors which uniquely associate BMI and oral cavity/pharyngeal cancer that explain the BMI-related enhancements. These associations may be indirect. For example, lower BMI has been associated with tooth loss (23, 24) and altered oral bacterial flora, which may lead to increased production of acetaldehyde or other carcinogens, thereby enhancing exposure effects for cancer of the oral cavity/pharynx (25, 26). However, the absence of effect modification of alcohol-related risks for laryngeal cancer by BMI may have resulted from the relatively small overall alcohol-related odds ratios for laryngeal cancer.
For oral cavity/pharyngeal cancer, modification of the effect of alcohol consumption by BMI was specific, with BMI modifying the drink-years association (different β's), while the influence of delivery rate (drinks/day) was homogeneous by BMI (i.e., similar g(.) functions). Thus, lower BMI increased the strength of the relation between oral cavity/pharyngeal cancer and drink-years, but the relative impacts of delivery rate on the relation between disease and drink-years were proportionally similar at all BMI levels. This result parallels that of our previous analysis, which found that the increased odds ratios for oral cavity/pharyngeal cancer with alcohol consumption as compared with laryngeal cancer were due to effects of drink-years, with drinks/day effects being homogeneous across cancer sites (15).
Ethanol may enhance the permeability of cells to environmental carcinogens, notably tobacco smoke (11, 12, 27, 28). Ethanol is oxidized to acetaldehyde, a human carcinogen (group 1) (29), through the enzymatic activity of alcohol dehydrogenase and, to a lesser extent, cytochrome P-450 enzymes, including cytochrome P-450 2E1, while acetaldehyde is metabolized by aldehyde dehydrogenase to acetate (30). Since this process occurs primarily in the liver and stomach (27, 30), the increased odds ratios with alcohol consumption for oral cavity/pharyngeal cancer as compared with laryngeal cancer suggest that site-specific factors must play a role (13–15, 27, 31–33). These factors may include increased production of acetaldehyde due to oral bacterial flora (28) or poor dentition, which may increase the release of proinflammatory cytokines (34) or enhance the effects of bacterial flora (25, 26). The extent to which BMI influences ethanol metabolism directly or indirectly is unknown.
The consistency of the effects of increased BMI, smoking, and alcohol drinking on oral cavity, pharyngeal, and laryngeal cancer for underweight subjects in this analysis and other studies (1–9), the similarity of results based on current BMI and results based on BMI 2–5 years prior (10), and the differential BMI effect modification for cancers of the oral cavity/pharynx as compared with larynx cancer suggest that our results were not due to misclassification or to disease-induced weight loss. It is also unlikely that residual confounding from incomplete adjustment for smoking and/or alcohol consumption explains the effect modification patterns. In our analysis, the smoking- and alcohol-adjusted odds ratios for BMI less than 18.5 relative to a BMI of normal range (18.5–24.9) were 2.6, 2.7, and 1.7 for oral cavity, pharynx, and larynx cancers, respectively (Table 1), which were similar to the 2.5- to 3-fold increased odds ratios for head and neck cancer observed previously among never smokers and never drinkers (10), suggesting that our analyses substantially controlled for confounding from smoking and alcohol consumption. BMI was an independent risk factor for cancers of the oral cavity/pharynx and larynx but a modifier of smoking- and alcohol-related risk only for cancers of the oral cavity/pharynx. The complexity of these associations makes it unlikely that misclassification drove the results, since biases would have had to differ by cancer site. In addition, odds ratios for alcohol consumption were small relative to those for cigarette smoking, and thus residual confounding from drinking would be insufficient to induce the BMI effect modification of smoking effects.
In summary, odds ratios for low BMI and greater smoking and drinking were increased for all sites and were homogeneous for oral cavity and pharyngeal cancers. Associations between alcohol drinking and BMI were greater for oral cavity/pharyngeal cancer, while associations between smoking and BMI were greater for laryngeal cancer. Low BMIs significantly enhanced smoking- and alcohol-related effects, but only for oral cavity/pharyngeal cancer. The increased odds ratios for all sites with low BMI suggest related causal mechanisms, while the modification of the smoking and drinking associations by BMI for oral cavity/pharyngeal cancer but not laryngeal cancer suggests additional factors which are unique to oral cavity/pharyngeal cancer. Precise causal mechanisms remain to be elucidated. The ability to conduct detailed analyses using large numbers of case subjects highlights the importance of large-scale collaborations such as the INHANCE Consortium.
Supplementary Material
Acknowledgments
Author affiliations: National Cancer Institute, Bethesda, Maryland (Jay H. Lubin, Mark P. Purdue, Deborah Winn); Department of Epidemiology and Population Health and Department of Obstetrics and Gynecology and Women's Health, Albert Einstein College of Medicine, New York, New York (Mia M. Gaudet); Department of Epidemiology, School of Public Health, University of North Carolina, Chapel Hill, North Carolina (Andrew F. Olshan); BioMedical Center for Environmental Health and Technology, Brown University, Providence, Rhode Island (Karl Kelsey); International Agency for Research on Cancer, Lyon, France (Paolo Boffetta, Paul Brennan, Maria Paula Curado, Silvia Franceschi); Institut Català d'Oncologia, IDIBELL, CIBER-ESP, L'Hospitalet de Llobregat, Barcelona, Spain (Xavier Castellsague); Fred Hutchinson Cancer Research Center, Seattle, Washington (Chu Chen, Stephen M. Schwartz); Epidemiology and Biostatistics Unit, Aviano Cancer Centre, Aviano, Italy (Luigino Dal Maso, Renato Talamini); Hospital de Clinicas de Porto Alegre, Porto Alegre, Brazil (Alexander W. Daudt); Specialized State Health Institute, Banská Bystrica, Slovakia (Eleonora Fabianova); Institute of Oncology and Radiobiology, Havana, Cuba (Leticia Fernandez); Universidade de São Paulo, São Paulo, Brazil (Victor Wünsch-Filho, Jose Eluf Neto); Instituto de Investigación Epidemiológica, San José, Costa Rica (Rolando Herrero); Escola Nacional de Saude Publica, Fundaçao Oswaldo Cruz, Rio de Janeiro, Brazil (Sergio Koifman); Istituto di Ricerche Farmacologiche Mario Negri and University of Milan, Milan, Italy (Carlo La Vecchia); Penn State College of Medicine, Hershey, Pennsylvania (Philip Lazarus, Joshua Muscat); Institut de médecine sociale et préventive, Université de Lausanne, Lausanne, Switzerland (Fabio Levi); Department of Cancer Epidemiology and Prevention, M. Sklodowska-Curie Memorial Cancer Center and Institute of Oncology, Warsaw, Poland (Jolanta Lissowska); “Carol Davila” University of Medicine and Pharmacy, Bucharest, Romania (Ioan Nicolae Mates); Angel H. Roffo Institute of Oncology, University of Buenos Aires, Buenos Aires, Argentina (Elena Matos); School of Public Health, Boston University, Boston, Massachusetts (Michael McClean); Universidade Federal de Pelotas, Pelotas, Brazil (Ana Menezes); Department of Epidemiology and Department of Environmental Health Sciences, School of Public Health, and Comprehensive Cancer Center, University of Michigan, Ann Arbor, Michigan (Hal Morgenstern); National Institute of Environmental Health, Budapest, Hungary (Peter Rudnai); Cancer Research Centre, Moscow, Russia (Oxana Shangina); University of Texas–M. D. Anderson Cancer Center, Houston, Texas (Erich M. Sturgis, Qingyi Wei); Institute of Occupational Medicine, Lodz, Poland (Neonilia Szeszenia-Dabrowska); School of Public Health, University of California, Los Angeles, Los Angeles, California (Zuo-Feng Zhang); Department of Family and Preventive Medicine, Huntsman Cancer Institute, University of Utah, Salt Lake City, Utah (Mia Hashibe); and Division of Epidemiology, Langone Medical Center, New York University, New York, New York (Richard B. Hayes).
This research was supported by the Intramural Research Program of the US National Institutes of Health and the National Cancer Institute, US Department of Health and Human Services.
Conflict of interest: none declared.
Glossary
Abbreviations
- BMI
body mass index
- EOR
excess odds ratio
- INHANCE
International Head and Neck Cancer Epidemiology
- OR
odds ratio
References
- 1.Garavello W, Randi G, Bosetti C, et al. Body size and laryngeal cancer risk. Ann Oncol. 2006;17(9):1459–1463. doi: 10.1093/annonc/mdl166. [DOI] [PubMed] [Google Scholar]
- 2.Kreimer AR, Randi G, Herrero R, et al. Diet and body mass, and oral and oropharyngeal squamous cell carcinomas: analysis from the IARC multinational case-control study. Int J Cancer. 2006;118(9):2293–2297. doi: 10.1002/ijc.21577. [DOI] [PubMed] [Google Scholar]
- 3.Rodriguez T, Altieri A, Chatenoud L, et al. Risk factors for oral and pharyngeal cancer in young adults. Oral Oncol. 2004;40(2):207–213. doi: 10.1016/j.oraloncology.2003.08.014. [DOI] [PubMed] [Google Scholar]
- 4.Nieto A, Sánchez MJ, Martínez C, et al. Lifetime body mass index and risk of oral cavity and oropharyngeal cancer by smoking and drinking habits. Br J Cancer. 2003;89(9):1667–1671. doi: 10.1038/sj.bjc.6601347. [DOI] [PMC free article] [PubMed] [Google Scholar]
- 5.Hashibe M, Sankaranarayanan R, Thomas G, et al. Body mass index, tobacco chewing, alcohol drinking and the risk of oral submucous fibrosis in Kerala, India. Cancer Causes Control. 2002;13(1):55–64. doi: 10.1023/a:1013991025848. [DOI] [PubMed] [Google Scholar]
- 6.Nieto A, Sánchez MJ, Quintana MJ, et al. BMI throughout life, intake of vitamin supplements and oral cancer in Spain. IARC Sci Publ. 2002;156:259–261. [PubMed] [Google Scholar]
- 7.Franceschi S, Dal Maso L, Levi F, et al. Leanness as early marker of cancer of the oral cavity and pharynx. Ann Oncol. 2001;12(3):331–336. doi: 10.1023/a:1011191809335. [DOI] [PubMed] [Google Scholar]
- 8.D'Avanzo B, La Vecchia C, Talamini R, et al. Anthropometric measures and risk of cancers of the upper digestive and respiratory tract. Nutr Cancer. 1996;26(2):219–227. doi: 10.1080/01635589609514478. [DOI] [PubMed] [Google Scholar]
- 9.Kabat GC, Chang CJ, Wynder EL. The role of tobacco, alcohol use, and body mass index in oral and pharyngeal cancer. Int J Epidemiol. 1994;23(6):1137–1144. doi: 10.1093/ije/23.6.1137. [DOI] [PubMed] [Google Scholar]
- 10.Gaudet MM, Olshan AF, Chuang SC. Body size and risk of head and neck cancer in a pooled analysis of case-control studies in the International Head and Neck Cancer Epidemiology (INHANCE) Consortium [published online ahead of print February 1, 2010] Int J Epidemol. doi: 10.1093/ije/dyp380. (doi:10.1093/ije/dyp380) [DOI] [PMC free article] [PubMed] [Google Scholar]
- 11.Olshan AF. Cancer of the larynx. In: Schottenfeld D, Fraumeni JF Jr, editors. Cancer Epidemiology and Prevention. 3rd ed. New York, NY: Oxford University Press; 2006. pp. 627–637. [Google Scholar]
- 12.Mayne AT, Morse DE, Winn DM. Cancers of the oral cavity and pharynx. In: Schottenfeld D, Fraumeni JF Jr, editors. Cancer Epidemiology and Prevention. 3rd ed. New York, NY: Oxford University Press; 2006. pp. 674–696. [Google Scholar]
- 13.Bagnardi V, Blangiardo M, La Vecchia C, et al. A meta-analysis of alcohol drinking and cancer risk. Br J Cancer. 2001;85(11):1700–1705. doi: 10.1054/bjoc.2001.2140. [DOI] [PMC free article] [PubMed] [Google Scholar]
- 14.Hashibe M, Brennan P, Benhamou S, et al. Alcohol drinking in never users of tobacco, cigarette smoking in never drinkers, and the risk of head and neck cancer: pooled analysis in the International Head and Neck Cancer Epidemiology Consortium. J Natl Cancer Inst. 2007;99(10):777–789. doi: 10.1093/jnci/djk179. [DOI] [PubMed] [Google Scholar]
- 15.Lubin JH, Purdue M, Kelsey K, et al. Total exposure and exposure rate effects for alcohol and smoking and risk of head and neck cancer: a pooled analysis of case-control studies. Am J Epidemiol. 2009;170(8):937–947. doi: 10.1093/aje/kwp222. [DOI] [PMC free article] [PubMed] [Google Scholar]
- 16.Benhamou S, Tuimala J, Bouchardy C, et al. DNA repair gene XRCC2 and XRCC3 polymorphisms and susceptibility to cancers of the upper aerodigestive tract. Int J Cancer. 2004;112(5):901–904. doi: 10.1002/ijc.20474. [DOI] [PubMed] [Google Scholar]
- 17.Wang D, Ritchie JM, Smith EM, et al. Alcohol dehydrogenase 3 and risk of squamous cell carcinomas of the head and neck. Cancer Epidemiol Biomarkers Prev. 2005;14(3):626–632. doi: 10.1158/1055-9965.EPI-04-0343. [DOI] [PubMed] [Google Scholar]
- 18.Blot WJ, McLaughlin JK, Winn DM, et al. Smoking and drinking in relation to oral and pharyngeal cancer. Cancer Res. 1988;48(11):3282–3287. [PubMed] [Google Scholar]
- 19.Lubin JH, Caporaso NE. Cigarette smoking and lung cancer: modeling total exposure and intensity. Cancer Epidemiol Biomarkers Prev. 2006;15(3):517–523. doi: 10.1158/1055-9965.EPI-05-0863. [DOI] [PubMed] [Google Scholar]
- 20.Preston DL, Lubin JH, Pierce DA, et al. Epicure User's Guide. Seattle, WA: HiroSoft International Corporation; 2006. [Google Scholar]
- 21.Godschalk RW, Feldker DE, Borm PJ, et al. Body mass index modulates aromatic DNA adduct levels and their persistence in smokers. Cancer Epidemiol Biomarkers Prev. 2002;11(8):790–793. [PubMed] [Google Scholar]
- 22.Palli D, Vineis P, Russo A, et al. Diet, metabolic polymorphisms and DNA adducts: the EPIC-Italy cross-sectional study. Int J Cancer. 2000;87(3):444–451. doi: 10.1002/1097-0215(20000801)87:3<444::aid-ijc21>3.0.co;2-#. [DOI] [PubMed] [Google Scholar]
- 23.Sheiham A, Steele JG, Marcenes W, et al. The relationship between oral health status and body mass index among older people: a national survey of older people in Great Britain. Br Dent J. 2002;192(12):703–706. doi: 10.1038/sj.bdj.4801461. [DOI] [PubMed] [Google Scholar]
- 24.Marcenes W, Steele JG, Sheiham A, et al. The relationship between dental status, food selection, nutrient intake, nutritional status, and body mass index in older people. Cad Saude Publica. 2003;19(3):809–816. doi: 10.1590/s0102-311x2003000300013. [DOI] [PubMed] [Google Scholar]
- 25.Pöschl G, Seitz HK. Alcohol and cancer. Alcohol Alcohol. 2004;39(3):155–165. doi: 10.1093/alcalc/agh057. [DOI] [PubMed] [Google Scholar]
- 26.Homann N, Tillonen J, Meurman JH, et al. Increased salivary acetaldehyde levels in heavy drinkers and smokers: a microbiological approach to oral cavity cancer. Carcinogenesis. 2000;21(4):663–668. doi: 10.1093/carcin/21.4.663. [DOI] [PubMed] [Google Scholar]
- 27.Marshall JR, Freudenheim J. Alcohol. In: Schottenfeld D, Fraumeni JF Jr, editors. Cancer Epidemiology and Prevention. 3rd ed. New York, NY: Oxford University Press; 2006. pp. 243–258. [Google Scholar]
- 28.Seitz HK, Becker P. Alcohol metabolism and cancer risk. Alcohol Res Health. 2007;30(1):38–47. [PMC free article] [PubMed] [Google Scholar]
- 29.Baan R, Straif K, Grosse Y, et al. Carcinogenicity of alcoholic beverages. Lancet Oncol. 2007;8(4):292–293. doi: 10.1016/s1470-2045(07)70099-2. [DOI] [PubMed] [Google Scholar]
- 30.Zakhari S. Overview: how is alcohol metabolized by the body? Alcohol Res Health. 2006;29(4):245–254. [PMC free article] [PubMed] [Google Scholar]
- 31.Hashibe M, McKay JD, Curado MP, et al. Multiple ADH genes are associated with upper aerodigestive cancers. Nat Genet. 2008;40(6):707–709. doi: 10.1038/ng.151. [DOI] [PubMed] [Google Scholar]
- 32.Zeka A, Gore R, Kriebel D. Effects of alcohol and tobacco on aerodigestive cancer risks: a meta-regression analysis. Cancer Causes Control. 2003;14(9):897–906. doi: 10.1023/b:caco.0000003854.34221.a8. [DOI] [PubMed] [Google Scholar]
- 33.Corrao G, Bagnardi V, Zambon A, et al. A meta-analysis of alcohol consumption and the risk of 15 diseases. Prev Med. 2004;38(5):613–619. doi: 10.1016/j.ypmed.2003.11.027. [DOI] [PubMed] [Google Scholar]
- 34.Guha N, Boffetta P, Wünsch Filho V, et al. Oral health and risk of squamous cell carcinoma of the head and neck and esophagus: results of two multicentric case-control studies. Am J Epidemiol. 2007;166(10):1159–1173. doi: 10.1093/aje/kwm193. [DOI] [PubMed] [Google Scholar]
Associated Data
This section collects any data citations, data availability statements, or supplementary materials included in this article.