

Abstract
This study investigated the excitability and accommodative properties of low-threshold human motor axons to test whether these motor axons have greater expression of the persistent Na+ conductance, INaP. Computer-controlled threshold tracking was used to study 22 single motor units and the data were compared with compound motor potentials of various amplitudes recorded in the same experimental session. Detailed comparisons were made between the single units and compound potentials that were 40% or 5% of maximal amplitude, the former because this is the compound potential size used in most threshold tracking studies of axonal excitability, the latter because this is the compound potential most likely to be composed entirely of motor axons with low thresholds to electrical recruitment. Measurements were made of the strength–duration relationship, threshold electrotonus, current–voltage relationship, recovery cycle and latent addition. The findings did not support a difference in INaP. Instead they pointed to greater activity of the hyperpolarization-activated inwardly rectifying current (Ih) as the basis for low threshold to electrical recruitment in human motor axons. Computer modelling confirmed this finding, with a doubling of the hyperpolarization-activated conductance proving the best single parameter adjustment to fit the experimental data. We suggest that the hyperpolarization-activated cyclic nucleotide-gated (HCN) channel(s) expressed on human motor axons may be active at rest and contribute to resting membrane potential.
Introduction
A motor unit consists of a motoneurone, its axon and the muscle fibres it innervates, and motor units can be classified according to fatigability, contractile speed and contractile strength (Burke et al. 1973; Fuglevand et al. 1999). Just as there are differences in excitability and accommodative properties between sensory and motor axons (Bostock et al. 1994; Kiernan et al. 1996; Mogyoros et al. 1996; Bostock & Rothwell, 1997), there are differences between motor axons (Henneman et al. 1965; Zajac & Fadden, 1985; Dalpozzo et al. 2002). The accommodative properties of motor axons differ between upper and lower limbs (Kuwabara et al. 2001) and length-dependent changes in the excitability of motor axons during and after ischaemia have been demonstrated (Krishnan et al. 2005).
In 1970, Bergmans published a thesis on the physiology of single human motor axons, having studied their activation and excitability using percutaneous stimulation and surface recording electrodes. He described the recovery of the excitability of axons following single and repetitive activation and reported the effects of ischaemia and temperature on these processes. Subsequently, other studies have been conducted on human single motor axons, including the responses to subthreshold polarizing currents (Bostock & Baker, 1988), ectopic behaviour following release of ischaemia (Bostock et al. 1991a,b;), repetitive activity after tetanic stimulation (Bostock & Bergmans, 1994), strength–duration properties (Mogyoros et al. 2000), threshold variability (Hales et al. 2004) and responses to near-threshold stimuli (Bostock et al. 2005). However, presumably because of the difficulty of isolating and tracking single motor axons for extended periods, most studies of axonal excitability in vivo have been conducted using threshold tracking of compound potentials (Bostock et al. 1998).
The aim of this study was to establish the excitability properties of electrically recruited, low-threshold single motor axons in the median nerve with a view to determining whether they are intrinsically different from motor axons of higher threshold. A number of factors may be responsible for a motor axon having a low threshold to electrical stimulation, including membrane conductances active at rest, axonal size and proximity to the stimulus. It was hypothesized that low-threshold axons would be likely to have a greater expression of the persistent Na+ conductance, INaP (Hales et al. 2004; Bostock et al. 2005). A computer-controlled threshold tracking technique was used to investigate the threshold behaviour, subthreshold excitability and accommodative properties and recovery after discharge of single motor axons (Bergmans, 1970; Bostock et al. 2005). Computer modelling was used to clarify the conductances underpinning the findings. Differences were found in the intrinsic properties of low-threshold motor axons, but these involved the hyperpolarization-activated inwardly rectifying current (Ih) rather than INaP.
Methods
Single motor unit action potentials (MUAPs) and compound muscle action potentials (CMAPs) were recorded from the thenar eminence of 15 neurologically healthy volunteers, aged 24–63 years (38.1 ± 11.8 (mean ±s.d.); 6 males). Informed written consent was obtained before data collection commenced. All experiments were conducted in accordance with the Declaration of Helsinki and with the approval of The University of Sydney Human Research Ethics Committee.
The median nerve was stimulated via Ag–AgCl adhesive surface electrodes. The cathodes used were repositionable electrodes (Red Dot Repositionable Monitoring Electrode, 3M, Ontario, Canada), which were cut down so that the conductive surface was approximately 200 mm2, placed proximal to the wrist crease. If necessary, the location of the cathode was adjusted to facilitate isolation of a MUAP. Once a MUAP was isolated, the cathode remained in the same location for all recordings (single and compound). The anode (Cleartrace ECG Electrode, ConMed Corporation, Utica, NY, USA) was placed 8–10 cm proximal to the cathode, on the radial edge of the forearm.
MUAPs were recorded from the thenar eminence using a double differential EMG sensor (DE-3.1 Double Differential Electrode, Delsys Inc., Boston, MA, USA). The reference electrode (Cleartrace ECG Electrode) was placed on the palm at the base of digit five. In order to isolate a MUAP with a threshold sufficiently lower than the next recruited MUAP, the sensor was repositioned as necessary over the thenar eminence. As a result the recorded MUAPs could have been in any of the three median-innervated thenar muscles. The MUAP potentials were amplified (×1000, Bagnoli-2 EMG System, Delsys Inc., Boston, MA, USA), residual line frequency noise was removed (Hum Bug 50/60 Hz Noise Eliminator, Quest Scientific Instruments Inc., BC, Canada) and the potentials were digitized by a computer with a 16-bit analog-to-digital board (PCI-6221M, National Instruments, Austin, TX, USA) using a sampling rate of 10 kHz (for the Trond protocol, see below) or 100 kHz (latent addition protocol). The amplitude of the MUAP was measured peak-to-peak.
CMAPs were recorded from the thenar eminence using Ag–AgCl adhesive surface electrodes (Cleartrace ECG electrode) with the active electrode positioned over the abductor pollicis brevis, the reference electrode on the proximal phalanx of digit one and the earth electrode on the palm at the base of digit five. Accordingly all three median-innervated thenar muscles would have contributed to the CMAP. The signal was amplified and filtered (3 Hz–3 kHz; ICP511 AC amplifier, Grass Product Group). Digitization of the signal was as for the MUAP recording. The amplitude of a CMAP was measured baseline-to-peak.
Stimuli were delivered by an isolated bipolar constant-current stimulator (Digitimer DS5 bipolar constant current stimulator, Digitimer Ltd, UK) controlled by a computer running QtracS (© Professor H. Bostock, Institute of Neurology, London), using the Trond MEM and latent addition protocols, which had been modified to allow recordings from single motor units. Skin temperature was monitored throughout the experiment (Omega Thermistor Thermometer, Omega Engineering Inc., Stamford, CT, USA), close to the site of stimulation, and all recordings were made at temperatures of 32°C or above.
Trond protocol
The Trond protocol was designed to make multiple excitability measurements from peripheral nerves in vivo by tracking the changes in the threshold of a CMAP. The measurements include a stimulus–response curve, charge–duration relationship, threshold electrotonus, current–voltage relationship and recovery cycle (as illustrated in Figs 1–3). The protocol was modified to allow threshold tracking of single units, where threshold was deemed to be the stimulus level at which the MUAP was recorded approximately 50% of the time (that is, an all-or-none response). The test stimulus was 1 ms in duration. The modifications included online stimulus artefact subtraction and the setting of the conditioning stimulus for the recovery cycle to 105% of the threshold of the single unit, thus minimizing the recruitment of additional units. In a number of instances it was not possible to record the recovery cycle when the conditioning–test interval was 3.2 ms or less.
Figure 1. All-or-none response of a single unit during a Trond MEM recording.
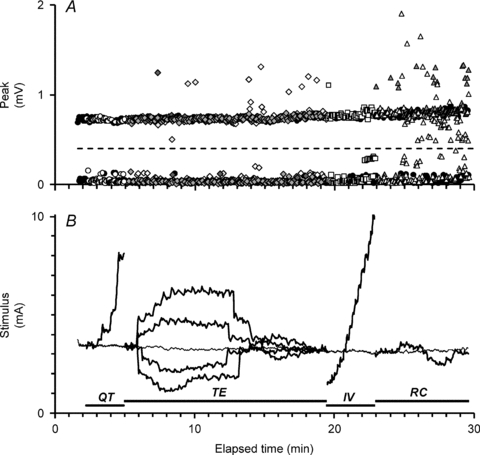
A, all-or-none discharge of a single unit which either responds (upper row of data points) or fails to respond (lower row of data points) as the test stimulus is varied in duration or preceded by a conditioning stimulus in the course of the recording. The window height set for tracking the MUAP is represented by the dashed line. Occasionally, additional units were also activated by the stimuli, seen here as outlying data points. B, the Trond MEM protocol records the stimulus–duration relationship (QT, for stimulus durations 0.2 ms, 0.4 ms, 0.6 ms, 0.8 ms and 1.0 ms; circles in A), threshold electrotonus (TE; diamonds in A), the current–voltage relationship (IV; squares) and the recovery cycle (RC; triangles) for the motor unit by tracking its threshold. The changes in stimulus current required to activate the unit are shown here in thickened black lines. The thin line running through the recording at approximately 3.5 mA is the threshold of the unit to an unconditioned stimulus, 1 ms wide (that is, control threshold).
Figure 3. Excitability measurements for the unit in Fig. 1 contrasted with the mean data for 22 units.
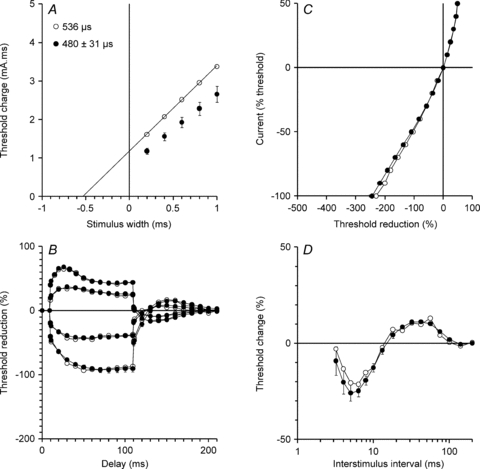
The data from a single motor unit (same data as Fig. 1; open circles) are presented alongside the mean data (±s.e.m.; filled circles) for the 22 motor units studied (21 units in A; charge–duration relationship data not recorded in one subject). The threshold changes shown in Fig. 1B are plotted here as charge–duration relationship (A; charge = stimulus current × stimulus duration), threshold electrotonus (B), current–voltage relationship (C) and recovery cycle (D). The strength–duration time constants in the insets in A are given by the intercept of the regression line on the x-axis. (No regression line is given for the 21 units because the x-intercept of a trendline fitted to mean threshold charge data is not equivalent to the mean strength–duration time constant for the group.)
In each subject, the Trond protocol was applied to a MUAP and, without changing the cathode or anode earth, then applied to target compound potentials that were set to 5%, 10%, 20% and 40% of the amplitude of the maximal CMAP recorded. The polarizing conditioning currents used in the threshold electrotonus and current–voltage relationship components of the protocol are a fixed percentage of the threshold for the target compound potential. Consequently they remained subthreshold when the target potentials were smaller in amplitude.
Latent addition protocol
The latent addition protocol tracked the changes in the threshold of the MUAP, or target compound potential, produced by a 60 μs test stimulus, which was conditioned by a 60 μs hyperpolarizing pulse. The conditioning stimulus was set to be −90% of the threshold for the unconditioned test potential. Initially the conditioning and test stimuli were aligned (time zero) and then the conditioning stimulus was shifted so that it commenced at progressively longer intervals between 0.01 and 0.5 ms before the test stimulus. The threshold changes were mathematically described by the sum of two exponential decay equations (Bostock & Rothwell, 1997). The first exponential decay was rapid due to the passive electrotonic properties of the nodal membrane. This exponential was used to calculate the fast time constant (τ1) for the membrane. The second exponential decay was slower and represents the active changes in membrane potential produced by the conditioning stimulus, reflected in the slow time constant (τ2) for the membrane. As the fast component was negligible after 0.2 ms, the slow exponential decay was fitted to data at 0.2–0.5 ms, and then back-interpolated and subtracted from the threshold changes measured at earlier intervals. This allowed accurate fitting of the fast exponential. In accordance with Bostock & Rothwell (1997), the threshold current at 0.2 ms was taken as a measure of conductances active at resting membrane potential, in particular the persistent Na+ conductance. The protocol simultaneously calculated the strength–duration time constant using the thresholds for the MUAP, or target compound potential, to stimuli that varied in duration between 0.06 and 1 ms (in 16 increments).
Modelling single motor unit excitability
A two-compartment (node and internode) computer model of a human motor nerve (the Bostock model, first described in Bostock et al. 1991b; applied in Kiernan et al. 2005, Jankelowitz et al. 2007a and Ng et al. 2008), as implemented in MEMFIT (Bostock, 2006), was used to investigate the membrane parameters underlying the variation in the data collected. The 40% CMAP data from the present study was used as the starting point (the Bostock model, while ostensibly consisting of a single node and internode, is designed to reproduce accurately excitability measurements recorded using compound potentials), and the model parameters were then adjusted using an iterative least squares procedure to adapt this baseline-model to fit the single unit data. Threshold electrotonus was given a weighting of two, current–voltage relationship and recovery cycle were each given a weighting of one, while the strength–duration time constant was given half the weighting of the latter indices. Overall errors were calculated as the square root of the weighted sum of the squares of the errors of the four indices and these were, in turn, used to calculate overall error reductions.
Statistics
Datasets were compared using Student's t tests and all data are expressed as mean ±s.e.m. unless otherwise indicated.
Results
Excitability of single motor units measured with threshold tracking
With modification (see Methods), it was possible to apply the Trond protocol to surface recordings from single units. Data were recorded from 22 units, including two from seven subjects (one from each hand). The complete recording from a single unit is shown in Fig. 1. The peak plot (Fig. 1A) clearly depicts the all-or-none response of the unit. It also illustrates the difficulty of recording single unit recovery cycles (triangle markers) at short conditioning–test intervals because other motor units can be recruited during the refractory and superexcitable phases. The thick lines in the stimulus plot (Fig. 1B) indicate the changes in the threshold of the unit during the four key elements of the Trond protocol, namely the charge–duration relationship (QT), threshold electrotonus (TE), current–voltage relationship (IV) and recovery cycle (RC). The mean stimulus–response curve for the compound recordings from the 22 thenar muscles is shown in Fig. 2 and the mean threshold for the single units is marked on the x-axis (±s.e.m.; filled circle), confirming that these electrically recruited units were of low threshold.
Figure 2. Threshold for single motor units.
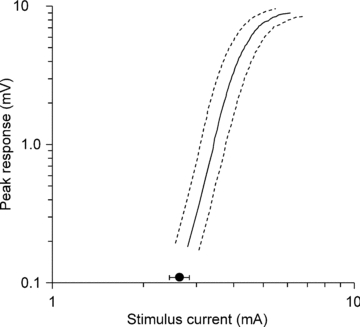
The mean threshold for the single units is shown relative to the average stimulus–response curve for the compound muscle action potential (dashed lines represent the S.E.M.s of the data) for the same 22 experimental sessions. The mean threshold of the 22 recorded MUAPs is marked on the x-axis (filled circle; ±s.e.m.).
The threshold changes shown in Fig. 1B are displayed in the more familiar excitability measurement plots in Fig. 3 (open circles). In Fig. 3, the data for the unit of Fig. 1 (open circles) are generally representative of the mean data for all 22 units (filled circles). These are marked by relatively small threshold changes to hyperpolarizing currents (Fig. 3B and C). The responses of the 22 units to polarizing conditioning stimuli of +40% of threshold (depolarizing) and –40% of threshold (hyperpolarizing) are presented in Fig. 4A. The threshold changes measured 90–100 ms after the onset of the depolarizing stimulus were significantly different between the single units and the 40% CMAPs (the mean threshold change being less for single units by 2.5 ± 1%; P= 0.016). The threshold changes measured 90–100 ms after the onset of the hyperpolarizing stimulus were significantly less for the single units than for 40% CMAPs (34.6 ± 5%; P < 0.0001). There was considerable variability in the threshold changes in the hyperpolarizing direction for different single units (Fig. 4A), but for each unit the threshold change was less than in the data for the corresponding 40% compound potential in the same experimental session.
Figure 4. Threshold changes in single motor units during threshold electrotonus.
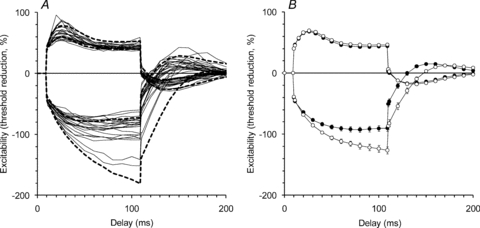
A, threshold changes for each of the 22 MUAPs during and after a 100 ms conditioning stimulus, that was either depolarizing (data shown above the line) or hyperpolarizing (data shown below the line), are drawn as continuous lines. The 95% confidence intervals for the data collected in the same subjects when tracking a target compound potential 40% of maximal are plotted for comparison (dashed lines). B, the mean (±s.e.m.) data for the MUAPs (filled circles) and 40% CMAPs (open circles) are shown for easy comparison. In each experiment, the MUAPs hyperpolarized less, although the data presented in A show considerable variability in the extent of the threshold increase produced by hyperpolarization.
Using the surface recording technique employed here, it proved difficult to track MUAPs below a conditioning–test interval of 3.2 ms because, as the threshold for the target unit increased, so did the likelihood of recruiting other units. Consequently no comment can be made about the degree of relative refractoriness for the units recorded here. Figure 5 shows the threshold changes recorded from the 22 units during the recovery cycle recorded for conditioning–test intervals longer than 3.2 ms, together with the 95% confidence intervals of the data recorded when tracking a 40% compound target potential, during the same 22 experimental sessions (dashed lines, Fig. 5A). The mean data for the 22 units and the 40% CMAPs (Fig. 5B; filled circles and open circles, respectively) confirm that the single axons responded to the supramaximal conditioning stimulus in much the same way as the compound recordings, with a period of superexcitability followed by a period of late subexcitability (see Bostock et al. 2005).
Figure 5. Threshold changes in single motor units during the recovery cycle.
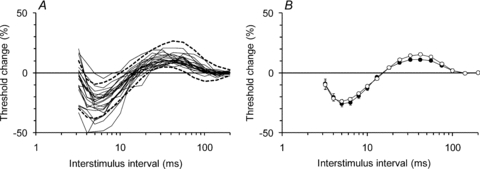
A, the changes in threshold of each of the 22 MUAPs during the recovery cycle are shown (thin continuous lines) along with the 95% confidence intervals (dashed lines) of the data recorded in the same 22 studies when tracking a compound potential that was 40% of maximal amplitude. The noise in the recordings increases as the interval between the supramaximal conditioning stimulus and the test stimulus narrows and the conditioning stimulus begins to recruit other units (as shown in Fig. 1A). For this reason, the data at interstimulus intervals less than 3.2 ms are not shown. B, the mean data (±s.e.m.) for the 22 units (filled circles) and for the 40% CMAPs (open circles) showing the periods of supernormality (at interstimulus intervals < 13 ms) and late subnormality (at interstimulus intervals 18–100 ms).
The strength–duration time constants of the single motor axons did not differ significantly from those of the 40% compound potentials (P= 0.179). The mean strength–duration time constant for 40% CMAP (Fig. 6A), calculated from the threshold charge–duration relationship, was 450 ± 17 μs (n= 22), compared with 480 ± 31 μs for the single units (Fig. 6A; n= 21 (strength–duration data were not recorded for one unit)).
Figure 6. Summary of the CMAP data and modelled excitability parameters.
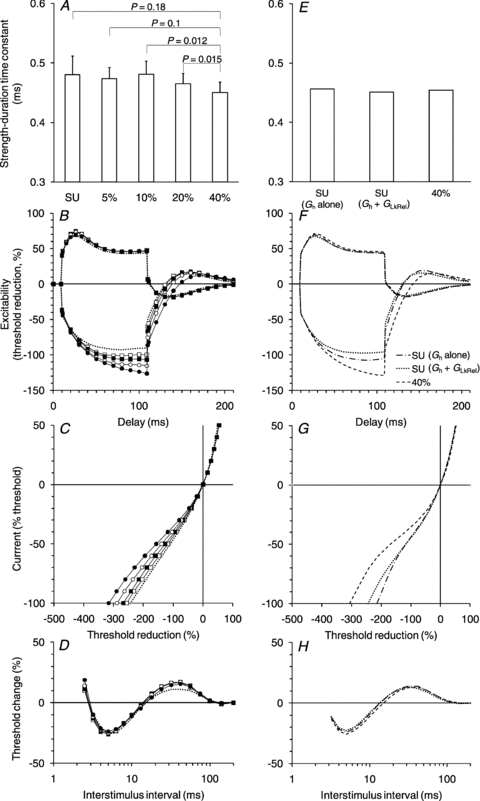
A–D, the CMAP data were collected tracking the threshold changes of potentials that were either 40% (filled circles), 20% (open circles), 10% (filled squares) or 5% (open squares) of maximum. The mean data for the 22 studies are shown. The single unit data are shown (dotted lines) for comparison. The error bars have been omitted in B, C and D for clarity. A, strength–duration time constant (±s.e.m.). B, threshold electrotonus. C, current–voltage relationship. D, recovery cycle. E–H, best-fits generated by the Bostock model, using the 40% data as the starting point. The key in F applies to F–H (optimized 40% CMAP fit; best single-parameter fit for single unit data (Gh alone) and best single-parameter-plus-one-other-parameter fit (Gh+GLkRel) for single unit data).
Latent addition in single motor units
A starting hypothesis for this study was that low threshold single units might have greater activity of conductances active at threshold, in particular the persistent Na+ conductance (Hales et al. 2004; Bostock et al. 2005). The similarity in strength–duration time constant measured in the single units and the 40% potentials would not support this hypothesis but, because the strength–duration time constant is also determined by the passive electrotonic properties of the axon, latent addition was used to investigate the role of INaP further. The technique of latent addition was used on 11 of the single motor axons. The strength–duration time constants measured as part of the latent addition protocol were 451 ± 25 μs for 40% CMAP compared with 463 ± 52 μs (n= 11) for the single units and this was consistent with the earlier measurements made with the Trond protocol. The latent addition data recorded from a single subject when tracking a single unit and 40% CMAP are shown in Fig. 7A and B, respectively. There was no significant difference between the single axons and the compound potentials with respect to either the fast or slow time constants (Fig. 7C). Also, there was no significant difference in the threshold increase 0.2 ms after a 90% hyperpolarizing stimulus for the 40% CMAPs (14.7 ± 1.3%) and the single units (11.8 ± 2.1%; n= 11; P= 0.054). In fact, the trend in these data are the opposite of that expected if low-threshold axons had greater expression of the persistent sodium conductance.
Figure 7. Latent addition-induced changes in threshold measured tracking single unit and compound potentials.
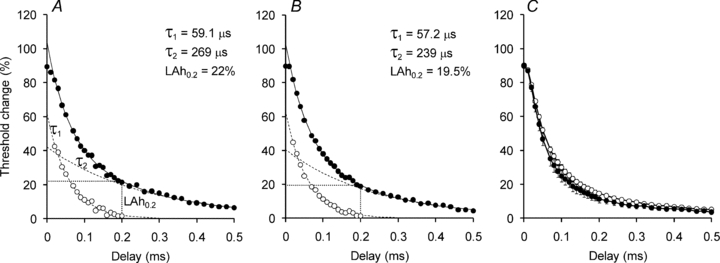
A, threshold changes (filled circles) recorded for a single MUAP. The change in threshold is fitted by two exponential decay curves: a fast (τ1) passive component (open circles) and a slow (τ2) component due to conductances active at rest (dashed lines). The threshold change at 0.2 ms (LAh0.2; dotted lines) represents the threshold change attributable to (mainly) the persistent sodium current. B, latent addition-induced changes in threshold recorded while tracking a 40% CMAP (same subject as A). C, mean threshold changes (±s.e.m.; n= 11) recorded for MUAPs (filled circles) and 40% CMAPs (open circles).
Variability of single motor units
Of the excitability properties studied, the single motor units varied most in threshold electrotonus. The 22 units were divided into two groups according to the threshold change to hyperpolarizing threshold electrotonus (the most variable property). Fourteen of the 22 units (refer to Fig. 4A) had lesser threshold changes than the mean in the hyperpolarizing direction, and when the excitability parameters of these 14 units were compared with those of the other eight units there was a statistically significant difference in the maximal threshold change to depolarizing threshold electrotonus, with the 14 units having a mean threshold change of 63.3 ± 2.6% compared with 72.9 ± 3.1% (P= 0.03) for the other eight units. There were no statistically significant differences in other excitability parameters, such as strength–duration time constant or recovery cycle. To examine membrane potential further the single unit data were divided into two groups based on either threshold to the 1.0 ms stimulus, or threshold as a fraction of the threshold for the 50% compound potential (measured from the stimulus–response curve recorded in the same experimental session). The latter was used to control for different absolute thresholds in different experiments. Neither of these threshold measures provided any insight into the variability of threshold electrotonus across the 22 single units.
In seven subjects, single unit recordings were made from both the left and right thenar eminence. There was no significant difference in the accommodative response to hyperpolarization between recordings made on the dominant and non-dominant hands.
Calibre of single motor axons
On the basis that conduction velocity is directly related to axonal size (and therefore motoneurone size) the latency of single unit F-waves were measured. Ten of the 22 single units produced F-waves (example presented in Fig. 8A; mean single unit F-wave latency, 29.7 ms). The latencies of these 10 F-waves were compared with the F-waves produced by supramaximal stimulation of the whole median nerve in the same experiment. For each of the 10 experiments, 50 F-waves were measured (mean of fastest F-waves to supramaximal stimulation, 25.9 ms (range 23.2–29.6 ms); mean of slowest F-waves, 37.3 ms (range 31.4–49.5 ms), see Fig. 8).
Figure 8. F-wave latencies.
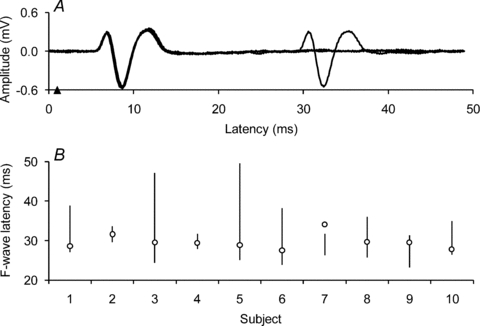
A, three superimposed traces from a single unit recording showing the M-wave occurring 5.9 ms after the test stimulus delivered at 1 ms (arrowhead; stimulus artefact is not seen due to artefact subtraction). One trace shows an F-wave occurring at 29.6 ms, i.e. at a latency of 28.6 ms. F-waves were seen with 10 of the 22 single unit recordings. B, latencies of F-waves generated by supramaximal stimulation of the whole median nerve in 10 experiments (NB no. 8 and no. 9 represent the left and right sides of a single subject, respectively). The vertical lines represent the range of latencies for each subject (so-called ‘chronodispersion’ for 50 trials containing F-waves, for each subject). The latencies of the 10 single unit F-waves are represented by circle markers. Note that one single unit (subject no. 7) had an F-wave latency that exceeded the longest latency F-wave generated by supramaximal stimulation in that experiment. The F-wave latencies suggest that the single unit recordings came from relatively fast axons, but not from the axons with the fastest conduction velocities.
For one unit the F-wave latency was longer than for all of the 50 F-wave recordings to supramaximal stimulation in that experiment (subject no. 7 in Fig. 8B). The most likely explanation is that this unit represents a reflexly accessible motoneurone, presumably of relatively small size (Espiritu et al. 2003; Pierrot-Deseilligny & Burke, 2005). The F-wave of the unit in question was not among the 50 F-waves recorded in response to supramaximal stimuli, probably because the supramaximal stimulus activated a Ia afferent volley sufficient to produce an H-reflex discharge in this motor axon, which then occluded antidromic discharge that otherwise might have produced the F-wave. On the other hand the weak stimulus, at threshold for the relevant motor axon, produced an Ia volley that was too weak to produce a reflex discharge. As a result the antidromic volley could reach the motoneurone and produce an F-wave in the single unit.
For the remaining nine units, F-wave latency was longer than the latency of the shortest F-wave produced by supramaximal stimulation in that experiment (mean difference, 3.3 ms), but shorter than the longest F-wave latency (mean difference, 8.8 ms). The range from fastest to slowest latency differed greatly for different units, again probably because of the inability of reflexly activated motoneurones to generate F-waves, and because this differed across subjects. Given that F-waves can be generated only by motoneurones that are not reflexly accessible, these findings suggest that these motor units were among the larger motor units in the pool.
Compound muscle action potentials of different size
A 40% CMAP is the usual target size when tracking compound potentials because it falls on the steeply rising part of the stimulus–response curve. The 5% target was chosen as the compound potential most closely approximating the low-threshold axons likely to be electrically recruited and tracked in the single unit recordings. The excitability measurements obtained when tracking the four different target CMAPs are presented in Fig. 6A–D (for comparison, the single unit data are presented as dotted lines). There was no significant difference in strength–duration time constant (Fig. 6A) between the 40% and 5% compound potentials.
In the threshold electrotonus and current–voltage plots, there was a graded decrease in the threshold change to hyperpolarizing conditioning stimuli (Fig. 6B and C) as the size of the target potential was reduced. The threshold change at the end of the hyperpolarizing current in threshold electrotonus was significantly greater for the 40% CMAPs than for the 5% CMAPs (25.1 ± 3.4%, mean difference ±s.e.m.; P < 0.0001; n= 21, 5% CMAP hyperpolarizing threshold electrotonus data not recorded in one subject). In the depolarizing direction, threshold changes were significantly less for the 40% CMAPs than the 5% CMAPs, the mean difference in threshold change 10–20 ms after the onset of the depolarizing pulse being 4.0 ± 1.5% (P= 0.01; n= 22). However, there was no significant difference in mean threshold change 90–100 ms after the onset of the depolarizing pulse between the two datasets. The recovery cycles were generally similar with no consistent trend across CMAP size in relative refractory period, the extent of supernormality or the extent of late subexcitability.
There was no significant difference between the single units and the 5% CMAPs with respect to resting current–voltage slope or minimal current–voltage slope, but both were significantly different from the 40% CMAPs with respect to these two indices (for the single unit dataset P= 0.0001 and P < 0.0001, respectively). The single units had significantly less late subexcitability than both the 40% and 5% CMAPs (P= 0.01 and P < 0.002, respectively) but there was no significant difference in the extent of subexcitability between the 40% and 5% CMAPs.
Computer modelling
The parameters of the standard motor axon model were adjusted, using an iterative least squares procedure, to fit the data for the 40% CMAPs, and the parameter changes necessary to best-fit the single unit dataset were then determined (Fig. 6E–H). The best single parameter change was increasing the conductance of Ih (Gh) by 107%; this resulted in a 82.6% reduction in the overall discrepancy between the 40% baseline and the single unit dataset. However, by allowing Gh and the leak conductance (GLkRel) to co-vary the discrepancy between the two datasets was reduced by 87.6%. This involved increasing Gh by 45% and GLkRel by 110%.
Discussion
This study has demonstrated differences in the biophysical properties of motor axons with different thresholds for electrical recruitment. It had been expected that one of the key differences would be in the persistent Na+ conductance active at rest, but the excitability measurements provided no evidence for this. However, the findings suggest significant differences between motor axons in the current through the hyperpolarization-activated cyclic nucleotide-gated (HCN) channels, and these differences do appear to correlate with electrical threshold.
The finding that there are probably conductance differences between motor axons of low threshold and those of higher threshold does not exclude the possibility that size and/or ease of current access (proximity or some quirk of current flow) might also contribute to axons having a low threshold. It is noted that the 10 motor axons that generated F-waves were not the fastest in their motoneurone pools. However, given that the range of F-wave latencies underestimates the full range of conduction times (because motoneurones that have discharged reflexly cannot generate F-waves, see Espiritu et al. 2003), it is likely that 9 of the 10 units had larger axons than the majority of the motoneurone pool. While there are a number of papers about excitability changes in peripheral nerves with maturation (for example, Boërio et al. 2009; Mori et al; 2010), there are no data on the excitability parameters of mature axons of different size.
Persistent sodium current
The strength–duration time constant is determined by both the passive electrotonic properties of the axon and currents active at rest, specifically INaP (Baker & Bostock, 1997; Bostock & Rothwell, 1997). The finding that the strength–duration time constant does not differ significantly between the low-threshold motor units and the higher-threshold axons suggests that persistent Na+ current was similar for the two groups of motor axons. Latent addition provides a more specific, though still indirect measure of persistent Na+ conductances, independent of the passive membrane properties. The lack of a significant difference in the threshold change measured at 0.2 ms between the 40% and single unit datasets is a further indication that INaP is not the key difference between motor axons of low and high threshold.
Mogyoros and colleagues (Mogyoros et al. 1996) found no significant difference between time constants of CMAPs of 30%, 60% and 90% of maximum. They did, however, find that the strength–duration time constant for single axons was shorter (343 ± 127 μs; mean ±s.d.) than that of 30% CMAPs (459 ± 126 μs). Bergmans (1970) measured chronaxie in 40 motor axons and found it varied from 10 to 350 μs, with 70% of the axons having a chronaxie less than 50 μs. The single unit strength–duration time constants measured in the present study were longer than those reported by either Mogyoros and colleagues or Bergmans. Bergmans’ values are remarkably short, as he himself notes. However, he used uninsulated needle electrodes inserted near the nerve trunk for stimulation rather than the surface electrodes used in this study and the Mogyoros study. Kuhn and colleagues (Kuhn et al. 2009) report that changes in electrode size and nerve depth are the most important parameters affecting chronaxie: the smaller the electrodes and the more superficial the nerve the lower chronaxie. Strength–duration time constant was measured twice in each experimental session, once with the Trond protocol (5 stimulus widths; 0.2–1 ms) and once with the latent addition protocol (17 stimulus widths; 0.06–1 ms), and the values obtained were consistent across the protocols.
Hyperpolarization-activated cyclic nucleotide-gated current
The low-threshold axons recruited in this study underwent greater accommodation to hyperpolarizing currents. Hyperpolarization-activated inwardly rectifying currents, Ih, flow through hyperpolarization-activated cyclic nucleotide-gated (HCN) channels. The isoforms HCN1, HCN2 and HCN4 are present in mammalian peripheral neurones (Chaplan et al. 2003; Doan et al. 2004; Hofmann et al. 2005), but the expression of different isoforms on human motor and sensory axons has yet to be determined. Hyperpolarization-activated currents are thought to limit electrogenic hyperpolarization (Baker et al. 1987) and contribute to resting membrane potential (Pape, 1996). The increase in inward rectification in the low-threshold axons may reflect greater expression of one or more of the HCN isoforms or a difference in HCN channel kinetics. The computer model suggested a near doubling of the hyperpolarization-activated and leak conductances in low-threshold axons. In this model, the leak conductance may perform the function of an otherwise unmodelled component of Ih (Robinson & Siegelbaum, 2003) and, if this is the case, the simulation may have underestimated the role of Ih in determining the resting membrane potential of the low-threshold units.
While there was considerable variability in the degree of accommodation to hyperpolarization for the 22 units in the present study, the degree of accommodation was always greater than for the 40% CMAP in each experiment. Further, both the significant difference in threshold at 100 ms to depolarizing currents and in resting current–voltage slope between the single units and 40% CMAPs point to the single units being slightly more depolarized at rest. We therefore suggest that an HCN isoform expressed on motor axons could be active at rest and that the greater activity of Ih in the single units was a factor in their low threshold.
Functional implications
The F-wave latencies suggest that most (9 of 10) motor axons with the lowest electrical threshold are likely to have relatively large diameters and to arise from larger motoneurones in the pool (Clamann & Henneman, 1976). The discharge pattern of such motoneurones involves higher discharge rates and high-frequency bursts of impulses, and it would make some physiological sense for their axons to have greater expression of an accommodative conductance that limited the extent of hyperpolarization that this discharge would produce.
The importance of Ih in axonal excitability has been highlighted by a number of pathophysiological conditions where it has been shown to be abnormal, such as diabetic neuropathy (Horn et al. 1996), neuropathic pain (Chaplan et al. 2003) and following a stroke (Jankelowitz et al. 2007a). In addition, there is evidence for a decline in Ih function with ageing (Jankelowitz et al. 2007b). If Ih contributes to resting membrane potential in motor axons, it may well be more important in sensory axons which appear to undergo greater inward rectification than motor axons (Bostock et al. 1994; Lin et al. 2002; Kiernan et al. 2004).
A number of techniques have been developed for estimating the number of motor units in a muscle (Shefner, 2001; Bromberg, 2007). All depend on electrical stimulation, often of only low-threshold motor axons. The present study suggests that these motor units may not be representative of the motor unit pool, at least for some properties.
Finally the present studies have implications for the interpretation of excitability studies. It is notable that the single unit responses were most similar to those of the 5% CMAPs with respect to accommodation to hyperpolarization. However, the similarity to 5% CMAPs did not hold with the recovery cycle. Review of the original traces from the recordings confirms that the same axon was tracked throughout the single unit recovery cycles. However, we cannot be certain that the small 5% compound potentials were composed of exactly the same motor units throughout the entire recovery cycle. This reinforces the view that for threshold tracking in normal subjects the optimal CMAP size is 40–50% of maximum (Bostock et al. 1998), though this may not be so in pathological nerves.
Acknowledgments
This research was supported by the National Health and Medical Research Council of Australia.
Glossary
Abbreviations
- CMAP
compound muscle action potential
- Gh
conductance of hyperpolarization-activated inwardly rectifying current
- GLkRel
leak conductance
- HCN
hyperpolarization-activated cyclic nucleotide-gated
- Ih
hyperpolarization-activated inwardly rectifying current
- INaP
persistent sodium current
- MUAP
motor unit action potential
Author contributions
All of the authors contributed to all aspects of the study and approved of the final version of the manuscript. The experiments were performed in the Medical Foundation Building at The University of Sydney, Australia.
References
- Baker MD, Bostock H. Low-threshold, persistent sodium current in rat large dorsal root ganglion neurons in culture. J Neurophysiol. 1997;77:1503–1513. doi: 10.1152/jn.1997.77.3.1503. [DOI] [PubMed] [Google Scholar]
- Baker M, Bostock H, Grafe P, Martius P. Function and distribution of three types of rectifying channel in rat spinal root myelinated axons. J Physiol. 1987;383:45–67. doi: 10.1113/jphysiol.1987.sp016395. [DOI] [PMC free article] [PubMed] [Google Scholar]
- Bergmans J. The Physiology of Single Human Nerve Fibres. Belgium: Vander, University of Louvain; 1970. [Google Scholar]
- Boërio D, Greensmith L, Bostock H. Excitability properties of motor axons in the maturing mouse. J Peripher Nerv Syst. 2009;14:45–53. doi: 10.1111/j.1529-8027.2009.00205.x. [DOI] [PubMed] [Google Scholar]
- Bostock H. MEMFIT: A computer program to aid interpretation of multiple excitability measurements on human motor axons. Clin Neurophysiol. 2006;117:S85. [Google Scholar]
- Bostock H, Baker M. Evidence for two types of potassium channel in human motor axons in vivo. Brain Res. 1988;462:354–358. doi: 10.1016/0006-8993(88)90564-1. [DOI] [PubMed] [Google Scholar]
- Bostock H, Baker M, Grafe P, Reid G. Changes in excitability and accommodation of human motor axons following brief periods of ischaemia. J Physiol. 1991a;441:513–535. doi: 10.1113/jphysiol.1991.sp018765. [DOI] [PMC free article] [PubMed] [Google Scholar]
- Bostock H, Baker M, Reid G. Changes in excitability of human motor axons underlying post-ischaemic fasciculations: evidence for two stable states. J Physiol. 1991b;441:537–557. doi: 10.1113/jphysiol.1991.sp018766. [DOI] [PMC free article] [PubMed] [Google Scholar]
- Bostock H, Bergmans J. Post-tetanic excitability changes and ectopic discharges in a human motor axon. Brain. 1994;117:913–928. doi: 10.1093/brain/117.5.913. [DOI] [PubMed] [Google Scholar]
- Bostock H, Burke D, Hales JP. Differences in behaviour of sensory and motor axons following release of ischaemia. Brain. 1994;117:225–234. doi: 10.1093/brain/117.2.225. [DOI] [PubMed] [Google Scholar]
- Bostock H, Cikurel K, Burke D. Threshold tracking techniques in the study of human peripheral nerve. Muscle Nerve. 1998;21:137–158. doi: 10.1002/(sici)1097-4598(199802)21:2<137::aid-mus1>3.0.co;2-c. [DOI] [PubMed] [Google Scholar]
- Bostock H, Lin CS-Y, Howells J, Trevillion L, Jankelowitz S, Burke D. After-effects of near-threshold stimulation in single human motor axons. J Physiol. 2005;564:931–940. doi: 10.1113/jphysiol.2005.083394. [DOI] [PMC free article] [PubMed] [Google Scholar]
- Bostock H, Rothwell JC. Latent addition in motor and sensory fibres of human peripheral nerve. J Physiol. 1997;498:277–294. doi: 10.1113/jphysiol.1997.sp021857. [DOI] [PMC free article] [PubMed] [Google Scholar]
- Bromberg MB. Updating motor unit number estimation (MUNE) Clin Neurophysiol. 2007;118:1–8. doi: 10.1016/j.clinph.2006.07.304. [DOI] [PubMed] [Google Scholar]
- Burke RE, Levine DN, Tsairis P, Zajac FE. Physiological types and histochemical profiles in motor units of the cat gastrocnemius. J Physiol. 1973;234:723–748. doi: 10.1113/jphysiol.1973.sp010369. [DOI] [PMC free article] [PubMed] [Google Scholar]
- Chaplan SR, Guo H-Q, Lee DH, Luo L, Liu C, Kuei C, Velumian AA, Butler MP, Brown SM, Dubin AE. Neuronal hyperpolarization-activated pacemaker channels drive neuropathic pain. J Neurosci. 2003;23:1169–1178. doi: 10.1523/JNEUROSCI.23-04-01169.2003. [DOI] [PMC free article] [PubMed] [Google Scholar]
- Clamann HP, Henneman E. Electrical measurement of axon diameter and its use in relating motoneuron size to critical firing level. J Neurophysiol. 1976;39:844–851. doi: 10.1152/jn.1976.39.4.844. [DOI] [PubMed] [Google Scholar]
- Dalpozzo F, Gérard P, De Pasqua V, Wang F, Maertens de Noordhout A. Single motor axon conduction velocities of human upper and lower limb motor units. A study with transcranial electrical stimulation. Clin Neurophysiol. 2002;113:284–291. doi: 10.1016/s1388-2457(01)00732-5. [DOI] [PubMed] [Google Scholar]
- Doan TN, Stephans K, Ramirez AN, Glazebrook PA, Andresen MC, Kunze DL. Differential distribution and function of hyperpolarization-activated channels in sensory neurons and mechanosensitive fibres. J Neurosci. 2004;24:3335–3343. doi: 10.1523/JNEUROSCI.5156-03.2004. [DOI] [PMC free article] [PubMed] [Google Scholar]
- Espiritu MG, Lin CS-Y, Burke D. Motoneuron excitability and the F wave. Muscle Nerve. 2003;27:720–727. doi: 10.1002/mus.10388. [DOI] [PubMed] [Google Scholar]
- Fuglevand AJ, Macefield VG, Bigland-Ritchie B. Force-frequency and fatigue properties of motor units in muscles that control digits of the human hand. J Neurophysiol. 1999;81:1718–1729. doi: 10.1152/jn.1999.81.4.1718. [DOI] [PubMed] [Google Scholar]
- Hales JP, Lin CS-Y, Bostock H. Variations in excitability of single human motor axons, related to stochastic properties of nodal sodium channels. J Physiol. 2004;559:953–964. doi: 10.1113/jphysiol.2004.068726. [DOI] [PMC free article] [PubMed] [Google Scholar]
- Henneman E, Somjen G, Carpenter DO. Functional significance of cell size in spinal motoneurons. J Neurophysiol. 1965;28:560–580. doi: 10.1152/jn.1965.28.3.560. [DOI] [PubMed] [Google Scholar]
- Hofmann F, Biel M, Kaupp UB. International union of pharmacology. LI. Nomenclature and structure-function relationships of cyclic nucleotide-regulated channels. Pharmacol Rev. 2005;57:455–462. doi: 10.1124/pr.57.4.8. [DOI] [PubMed] [Google Scholar]
- Horn S, Quasthoff S, Grafe P, Bostock H, Renner R, Schrank B. Abnormal axonal inward rectification in diabetic neuropathy. Muscle Nerve. 1996;19:1268–1275. doi: 10.1002/mus.880191002. [DOI] [PubMed] [Google Scholar]
- Jankelowitz SK, Howells J, Burke D. Plasticity of inwardly rectifying conductances following a corticospinal lesion in human subjects. J Physiol. 2007a;581:927–940. doi: 10.1113/jphysiol.2006.123661. [DOI] [PMC free article] [PubMed] [Google Scholar]
- Jankelowitz SK, McNulty PA, Burke D. Changes in measures of motor axon excitability with age. Clin Neurophysiol. 2007b;118:1397–1404. doi: 10.1016/j.clinph.2007.02.025. [DOI] [PubMed] [Google Scholar]
- Kiernan MC, Isbister GK, Lin CS-Y, Burke D, Bostock H. Acute tetrodotoxin-induced neurotoxicity after ingestion of puffer fish. Ann Neurol. 2005;57:339–348. doi: 10.1002/ana.20395. [DOI] [PubMed] [Google Scholar]
- Kiernan MC, Lin CS-Y, Burke D. Differences in activity-dependent hyperpolarization in human sensory and motor axons. J Physiol. 2004;558:341–349. doi: 10.1113/jphysiol.2004.063966. [DOI] [PMC free article] [PubMed] [Google Scholar]
- Kiernan MC, Mogyoros I, Burke D. Differences in the recovery of excitability in sensory and motor axons of human median nerve. Brain. 1996;119:1099–1105. doi: 10.1093/brain/119.4.1099. [DOI] [PubMed] [Google Scholar]
- Krishnan A, Lin CS-Y, Kiernan MC. Excitability differences in lower-limb motor axons during and after ischemia. Muscle Nerve. 2005;31:205–213. doi: 10.1002/mus.20258. [DOI] [PubMed] [Google Scholar]
- Kuhn A, Keller T, Lawrence M, Morari M. A model for transcutaneous current stimulation: simulations and experiments. Med Biol Eng Comput. 2009;47:279–289. doi: 10.1007/s11517-008-0422-z. [DOI] [PubMed] [Google Scholar]
- Kuwabara S, Cappelen-Smith C, Lin CS-Y, Mogyoros I, Burke D. Differences in accommodative properties of median and peroneal motor axons. J Neurol Neurosurg Psychiatry. 2001;70:372–376. doi: 10.1136/jnnp.70.3.372. [DOI] [PMC free article] [PubMed] [Google Scholar]
- Lin CS-Y, Kuwabara S, Cappelen-Smith C, Burke D. Responses of human sensory and motor axons to the release of ischaemia and to hyperpolarizing currents. J Physiol. 2002;541:1025–1039. doi: 10.1113/jphysiol.2002.017848. [DOI] [PMC free article] [PubMed] [Google Scholar]
- Mogyoros I, Kiernan MC, Burke D. Strength-duration properties of human peripheral nerve. Brain. 1996;119:439–447. doi: 10.1093/brain/119.2.439. [DOI] [PubMed] [Google Scholar]
- Mogyoros I, Lin CS-Y, Kuwabara S, Cappelen-Smith C, Burke D. Strength-duration properties and their voltage dependence as measures of a threshold conductance at the node of Ranvier of single motor axons. Muscle Nerve. 2000;23:1719–1726. doi: 10.1002/1097-4598(200011)23:11<1719::aid-mus8>3.0.co;2-w. [DOI] [PubMed] [Google Scholar]
- Mori A, Nodera H, Shibuta Y, Okita T, Bostock H, Kaji R. Threshold-dependent effects on peripheral nerve in vivo excitability properties in the rat. Neurosci Lett. 2010;468:248–253. doi: 10.1016/j.neulet.2009.11.006. [DOI] [PubMed] [Google Scholar]
- Ng K, Howells J, Pollard JD, Burke D. Up-regulation of slow K+ channels in peripheral motor axons: a transcriptional channelopathy in multiple sclerosis. Brain. 2008;131:3062–3071. doi: 10.1093/brain/awn180. [DOI] [PubMed] [Google Scholar]
- Pape HC. Queer current and pacemaker: the hyperpolarization-activated cation current in neurons. Annu Rev Physiol. 1996;58:299–327. doi: 10.1146/annurev.ph.58.030196.001503. [DOI] [PubMed] [Google Scholar]
- Pierrot-Deseilligny E, Burke D. The Circuitry of the Human Spinal Cord: Its Role in Motor Control and Movement Disorders. Cambridge: Cambridge University Press; 2005. [Google Scholar]
- Robinson RB, Siegelbaum SA. Hyperpolarization-activated cation currents: from molecules to physiological function. Annu Rev Physiol. 2003;65:453–480. doi: 10.1146/annurev.physiol.65.092101.142734. [DOI] [PubMed] [Google Scholar]
- Shefner JM. Motor unit number estimation in human neurological diseases and animal models. Clin Neurophysiol. 2001;112:955–964. doi: 10.1016/s1388-2457(01)00520-x. [DOI] [PubMed] [Google Scholar]
- Zajac FE, Faden JS. Relationship among recruitment order, axonal conduction velocity, and muscle-unit properties of type-identified motor units in cat plantaris muscle. J Neurophysiol. 1985;53:1303–1322. doi: 10.1152/jn.1985.53.5.1303. [DOI] [PubMed] [Google Scholar]