Abstract
Goals
To assess the effects of thickness and position of cartilage used to reconstruct the tympanic membrane (TM) using a novel technique, time-averaged laser holography.
Background
Cartilage is commonly used in TM reconstruction to prevent formation of retraction pockets. The thickness, position, and shape of the cartilage graft may adversely affect TM motion and hearing. We sought to systematically investigate these parameters in an experimental setting.
Methods
Computer-assisted optoelectronic laser holography was used in 4 human cadaveric temporal bones to study sound-induced TM motion for 500 Hz to 8 kHz. Stapes velocity was measured with a laser Doppler vibrometer. Baseline (control) measurements were made with the TM intact. Measurements were repeated after a 0.5- or 1.0-mm-thick oval piece of conchal cartilage was placed on the medial TM surface in the posterior-superior quadrant. The cartilage was rotated so that it was either in contact with the bony tympanic rim and manubrium or not.
Results
At frequencies less than 4 kHz, the cartilage graft had only minor effects on the overall TM fringe patterns. The different conditions had no effects on stapes velocity. Greater than 4 kHz, TM motion was reduced over the grafted TM, both with 0.5- and 1.0-mm-thick grafts. No significant differences in stapes velocity were seen with the 2 different thicknesses of cartilage compared with control.
Conclusion
Computer-assisted optoelectronic laser holography is a promising technique to investigate middle ear mechanics after tympanoplasty. Such positioning may prevent postoperative TM retraction. These findings and conclusions apply to cartilage placed in the posterior-superior TM quadrant.
Keywords: Cartilage, Time-averaged holography, Tympanoplasty
Cartilage is commonly used in reconstruction of the tympanic membrane (TM) to provide mechanical stability to prevent formation of retraction pockets and also to reduce the extrusion of ossicular replacement prostheses. A variety of cartilage grafts of varying size, shape, and thicknesses have been described (1,2). Although commonly used, the effects of cartilage TM grafts on middle ear sound transmission have not been characterized in a systematic manner. Only a few studies have investigated the acoustics of cartilage TM grafts. Lee et al. (3,4), using a finite element model analysis, suggested that a cartilage graft should be as thin as possible to optimize its acoustic characteristics. Zahnert et al. (5) and Murbe et al. (6) studied the acoustic properties of cartilage grafts in an experimental setting.
In the present study, we investigated the mechanics of cartilage tympanoplasty by laser holography and laser Doppler vibrometry using a cadaveric temporal bone preparation. We applied computer-assisted high-speed optoelectronic holography (OEH) to study the vibration of the entire TM (7). The main features of OEH are that the holographic interference patterns are digitized, and the computation of the holographic images is enabled by the use of computer-controlled variations in the length of the optical path (8). Optoelectronic holography is a promising new technique for investigating middle ear function (7,9). Optoelectronic holography produces time-averaged holograms (TAHs) that show different kinds of fringe patterns depending on the sound-stimulus frequency and level. The fringe patterns can be divided into simple, complex, and ordered (7,10,11).
MATERIALS AND METHODS
Temporal-Bone Preparation
Four fresh cadaveric temporal bones and pieces of conchal cartilage, obtained from donors 63 to 87 years old, were used. All donors had no evidence of otologic disease, and the specimens were removed within 24 hours after death following the procedures described by Schuknecht (1968) (12) and were stored in isotonic sodium chloride solution at 4°C between measurements. This study was approved by our institutional review board.
The cartilaginous ear canal was resected, and the bony external ear canal was drilled away until the entire lateral surface of the TM was easily visible. The stapes and the medial side of the TM were accessed via a posterior tympanotomy by widely opening the mastoid and removing the mastoid segment of the facial nerve. The tendon of the stapedius muscle was severed. The middle ear cavity was left open to the atmosphere during the measurements. The temporal bone was kept moist by frequent moistening with saline or immersing the bone in saline for 20 minutes between different measurement sequences. To increase the amount of light reflected from the TM surface, the TM was painted lightly with a solution of TiO2 powder (Acros Organics, Morris Plains, NJ, USA) in saline (7).
Cartilage Grafts
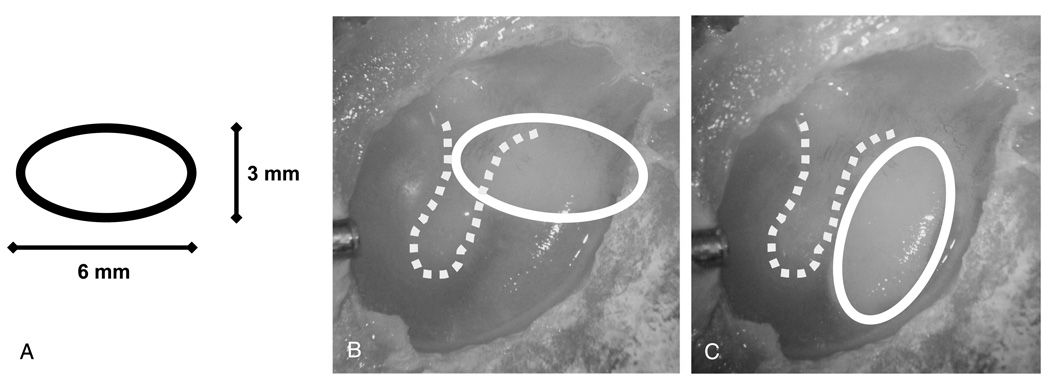
Pieces of conchal cartilage were cut into 1.0- and 0.5-mm-thick cartilage sheets using a commercially available cutting device (Kurz Company, Dusslingen, Germany). The sheets were cut with a sharp knife into oval-shaped (6 × 3 mm) plates (Fig. 1A). Either the 1.0- or 0.5-mm-thick oval plate of conchal cartilage was placed on the medial TM surface in the posterior or posterior-superior quadrant through the facial recess. Each cartilage plate was rotated so that it was either in contact with the bony tympanic rim and manubrium (Fig. 1B) or not (Fig. 1C).
FIG. 1.
Photograph of a cadaver TM showing the position of the cartilage. A, The oval shape and size of the graft used. B, The graft is interposed so that it is in contact with the bony tympanic rim and manubrium (BC). C, The graft is not in contact with the bone (NBC).
Computer-Assisted OEH
The painted and widely exposed TM was placed against a sound coupler integrated into the interferometer head and oriented such that the surface of the TM was perpendicular to the object beam of the laser (9). The sound coupler was connected to a Beyerdynamic DT-48 earphone (Beyerdynamic, Heilbronn, Germany). A calibrated Knowles EK-3103 hearing-aid microphone (Knowles Electronics, Itasca, IL, USA) and probe tube measured sound pressure near the edge of the TM. This system was used to study the vibration of TM using tonal stimuli of 0.5 to 8 kHz (7).
Computer-assisted OEH uses a digital camera synched with an optical phase shifter to capture multiple interference images while stepping the optical phase of 1 of the interfering beams in cyclic steps of 90 degrees (13). A TAH describes the magnitude of motion of a surface via a gray-scaled surface map in which the magnitude of the displacement at each point on the surface is coded by variations in image intensity. Each dark holographic fringe defines a spatial contour of displacement magnitude, where the areas of the largest displacement are surrounded by the largest number of fringes (7). Holographic images were analyzed with software written at Worcester Polytechnic Institute (8) and with Matlab (Mathworks, Natick, MA, USA).
Laser Doppler Vibrometry
Measurements of the sound-induced velocity of the stapes were made with a laser Doppler vibrometer (LDV; Polytec OFV 501 fiber interferometer and OFV 2600 vibrometer controller; Polytec Inc., Irvine, CA, USA) focused on 50-µm-diameter polystyrene microbeads that were placed on the posterior crus of the stapes (14). The measured stapes velocity was normalized by the stimulus sound pressure. The sound stimulus for the LDV measurements was a chirp containing frequencies of 200 Hz to 20 kHz. The sound pressure in the ear canal was measured near the TM with a calibrated probe-tube microphone. Stapes velocity measurements were made with the laser beam directed through the opened facial recess on the posterior crus, with the laser beam at an angle of 45 to 60 degrees to the plane of the stapes footplate. The “artifact” velocity was measured on the surface of promontory; artifact is a measure of the sound-induced velocity of the entire bone and represents the smallest possible stapes velocity that can be discriminated. Because of constraints placed by the OEH hardware, the artifact we observed was larger than usual especially in bands near 2 and 10 kHz.
Data Analysis
Time-averaged hologram images were analyzed by counting fringes where the largest number of concentric fringes was identified on TAHs taken with different sound pressure levels at 500 Hz and 1 kHz. Fringe counts were converted to the maximal spatial displacement by noting the zero values in the function described by the square of the zeroth order Bessel function of the product of the displacement magnitude and the 473-nm wavelength of the laser (7,15). Linear regression analyses of maximum displacements (in microns) gathered at multiple sound levels (in Pascals) were used to estimate the maximum mobility of the TM for each measurement condition, and the manipulation-induced change in mobility was coded in decibels (Excel, Microsoft, CA, USA). The manipulation-induced changes in LDV stapes-velocity data were computed with Matlab (Mathworks). The results of the temporal bone measurements were averaged and normalized. Sound pressure levels used in each experiment were calculated with Matlab. Student’s t test was used to test for statistically significant differences (*p < 0.05).
RESULTS
TAH Images
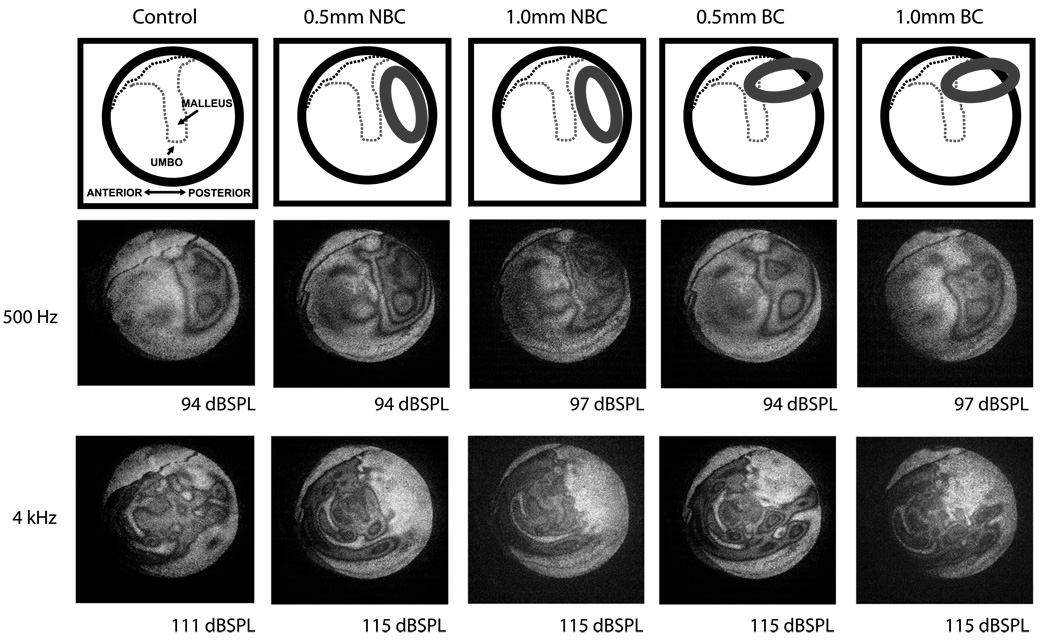
At 500 Hz, the cartilage graft had little effect on the overall TM fringe patterns, although there were observable changes in the posterior-superior region of the TM near the lateral process of the malleus. Fringe patterns were simple and easy to count (Fig. 2). At 1 kHz, the fringe patterns were similar to those at 500 Hz (data not shown). At 4 kHz, complex fringe patterns could be seen, but the area backed by cartilage did not form fringes. The nonmoving area was larger when the cartilage was oriented such that it did not contact the tympanic rim and the manubrium (0.5/0.1 mm no bone contact). The rest of the TM formed complex fringe patterns similar to the control (Fig. 2). At 8 kHz, the cartilage sheet had a similar effect on fringe patterns as at 4 kHz (data not shown).
FIG. 2.
Time-averaged holograms at 500 Hz and 4 kHz. At 500 Hz, the fringes show a simple pattern. The grafted area also has fringes. At 4 kHz, the fringes show a complex pattern, and no fringes can be seen on the TM over the graft. BC indicates bony contact; NBC, no bony contact.
Maximum Mobility of TM
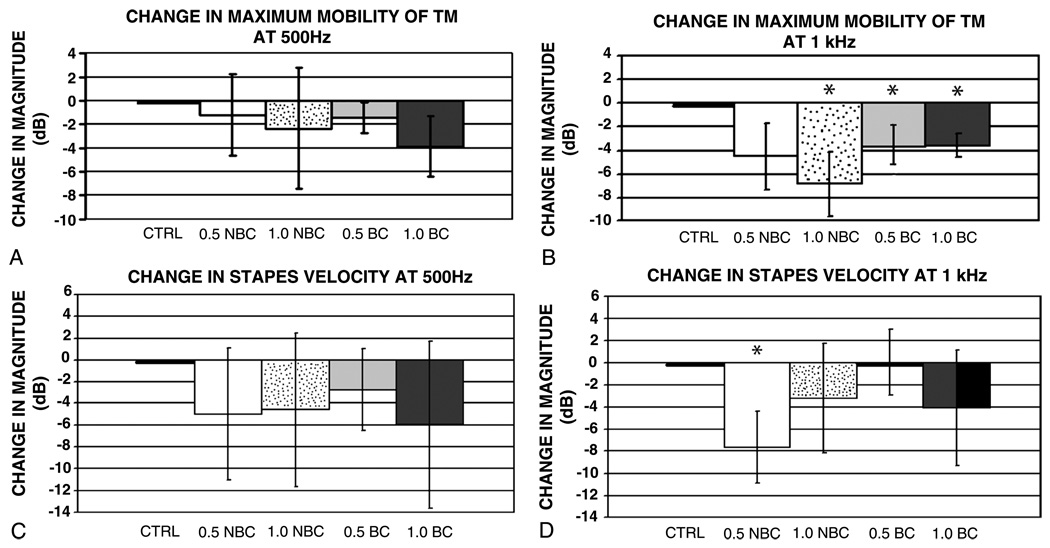
Comparisons of changes in the maximum mobility of the TM at 500 Hz under the different test conditions showed no significant differences (Fig. 3A). At 1 kHz, small (7 dB or less on average) cartilage-induced reductions in the magnitude of maximum mobility of TM wereseen; the 0.5-mm-thick graft with bony contact and 1.0-mm-thick cartilage grafts with both conditions induced significant reductions in TM motion from the control condition (Fig. 3B). However, there were no significant differences between the 0.5- and 1.0-mm-thick samples, nor were there differences when comparing orientation of the cartilage on the TM.
FIG. 3.
Mean ± standard deviation of normalized ratios (in decibels) of the maximum mobility of TM after cartilage reconstruction. A, Small cartilage-induced changes in magnitude of maximum mobility of TM at 500 Hz. B, Cartilage-induced reductions in magnitude of maximum mobility of TM at 1 kHz. C, Cartilage-induced reductions in stapes velocity at 500 Hz. D, Small (8 dB or less on average) cartilage-induced changes in magnitude of stapes velocity at 1 kHz. In all, n = 4, 0.5-/1.0-mm NBC = 0.5-/1.0-mm cartilage without bone contact, 0.5-/1.0-mm BC = 0.5-/1.0-mm cartilage graft with bone contact. Asterisk marks those conditions that are significantly different (p < 0.05) from the control.
Stapes Velocity
At 500 Hz, small (6 dB or less on average) cartilage-induced reductions in stapes velocity were seen (Fig. 3C), but none of these reductions were statistically significant. The normalized magnitude ratio at 1 kHz showed small (8 dB or less on average) cartilage-induced changes in the magnitude of stapes velocity normalized by stimulus sound pressure (Fig. 3D). The 0.5-mm-thick cartilage graft was not in contact with the bony tympanic rim or manubrium, and the velocity did differ significantly from the control. With all the other conditions, there were no statistically significant differences compared with the control.
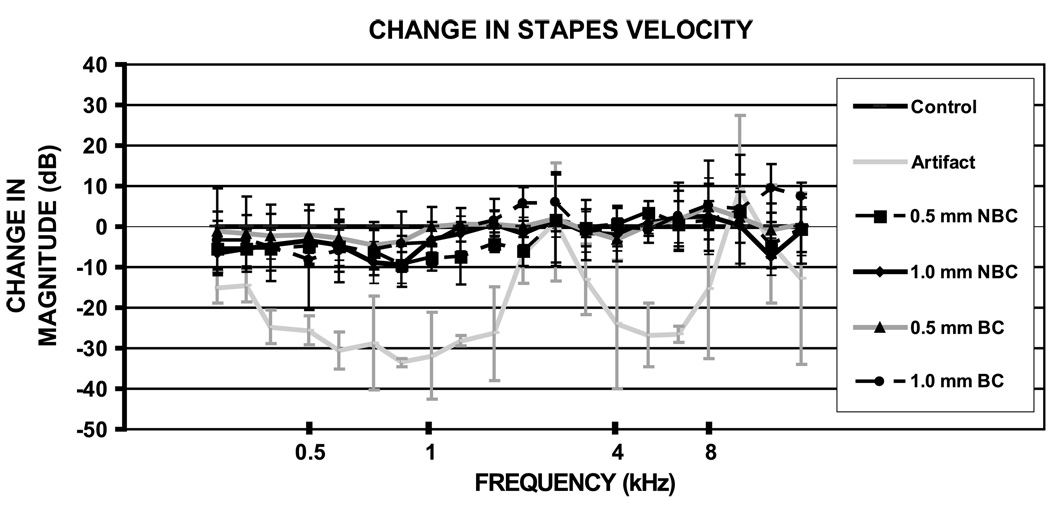
Figure 4 shows the ratio of the magnitudes of the averaged and normalized stapes velocities for the different conditions from frequencies of 200 Hz to 20 kHz. The 0.5- and 1.0 -mm measurements with or without bone contact did not significantly differ from each other at 4 or at 8 kHz, nor did they differ significantly from the control. Figure 4 also illustrates the measured velocity artifact, which dominates the measured velocity near 2.5 and 10 kHz, but is 15 to 30 dB less than the measured stapes velocity at frequencies less than 1.5 kHz and between 3 and 9 kHz.
FIG. 4.
Mean ± standard deviation normalized magnitude ratio of stapes velocity as a function of frequency from 200 Hz up to 20 kHz. The measurements made at frequencies between 2 and 3 and greater than 12 kHz are contaminated by measurement artifact, that is, at these frequencies, the entire bone was moving with significant velocity. The cartilage graft measurements (both thicknesses and positions) do not differ significantly from each other. n = 4, 0.5-/1.0-mm NBC = 0.5-/1.0-mm cartilage without bone contact, 0.5-/1.0-mm BC = 0.5-/1.0-mm cartilage with bone contact.
DISCUSSION
The fringe patterns in TAH images of the normal human TM stimulated by pure tones from 0.2 to 25 kHz can be divided into 3 categories. A simple fringe pattern is seen at frequencies less than or equal to 1 kHz. In simple patterns, there are a few areas of maximal displacement on the TM surface, where each area is defined by several concentric dark fringes (7,11). As frequency increases, the patterns become more complicated, with interdigitating multiple maximal displacement areas. Complex patterns are observed at frequencies between 1 and 6 kHz. When the frequency is higher than 6 kHz, ordered patterns are seen with many small displacement maxima, each composed of a series of fringes. In our human temporal bone model, fringe counts could be done only with the simple pattern of fringes with frequencies at 500 Hz and 1 kHz to evaluate the maximum mobility of TM but could not be performed easily in the more complicated or ordered regime.
Counts of the maximum number of concentric fringes in the simple TAHs at 500 Hz and 1 kHz showed only small differences between 0.5- and 1.0-mm-thick cartilage grafts. Furthermore, the position of the grafts had no significant effect on the motion of TM. Although the grafts induced some small changes in pattern near the lateral process at 500 Hz and 1 kHz, the area of maximum displacement did not change its location after cartilage placement. At 4 and 8 kHz, TAHs revealed obvious decreases in the motion of areas of the TM that apposed the cartilage. However, stapes velocity measurements with the cartilage in place showed no significant change from the control condition at frequencies of 3 to 9 kHz, with no systematic changes in velocity at lower frequencies. The combination of large cartilage-induced alterations in the high-frequency (4 and 8 kHz) displacement patterns of the TM and no measurable effects on stapes velocity is consistent with the hypothesis that large regions of the TM are uncoupled from the ossicular chain with high-frequency sound stimulation (16–18).
Zahnert et al. (5) and Murbe et al. (6) investigated the acoustic properties of cartilage plates of 0.3- to 1.0-mm thickness used for TM reconstruction. They concluded that cartilage grafts that were thin (especially ≤0.5 mm) and those that did not contact the bony annulus would give better hearing results. The results of the present study are different in that we found no significant losses in middle ear sound transmission for any of the cartilage grafts. A key difference between the earlier 2 studies and the present study is that the studies of Zahnert et al. (5) and Murbe et al. (6) were done with cartilage grafts placed at the end of an artificial ear canal without being loaded by the ossicles or the cochlea (as was the case in the present study). Although our OEH data showed clear decreases in TM motion in areas in contact with the cartilage, this did not lead to a significant decrease in middle ear sound transmission. Our data are consistent with the hypothesis that large regions of the TM are uncoupled from the ossicular chain especially at higher frequencies (16–18).
Cartilage is commonly placed in the posterior-superior quadrant of the TM to cover ossicular prosthesis to minimize their extrusion and to prevent TM retraction. Our data suggest that the thickness and positioning of such cartilage grafts will have little adverse effect on the mechanics of the tympanoplasty, keeping in mind that our study was restricted to cartilage grafts that were 6 × 3 mm in size, either 0.5 or 1 mm in thickness, and positioned in the superior or posterior part of the TM. Future work is needed to study the effects of reconstruction of larger areas of the TM with cartilage, reconstruction of the entire TM with cartilage, and the effects of palisade cartilage reconstructions.
CONCLUSION
Computer-assisted OEH is a promising technique to investigate middle ear mechanics after tympanoplasty. Covering the posterior-superior quadrant of the TM with thick or thin cartilage has little effect on middle ear sound transmission. In addition, allowing the cartilage to extend a little beyond the bony annulus to help prevent postoperative TM retraction does not adversely affect middle ear sound transmission.
Acknowledgments
Supported by the National Institute on Deafness and Other Communication Disorders, Lakshmi Mittal, Axel Eliasen, and the Academy of Finland.
REFERENCES
- 1.Yung M. Cartilage tympanoplasty: literature review. J Laryngol Otol. 2008;122:663–672. doi: 10.1017/S0022215108001813. [DOI] [PubMed] [Google Scholar]
- 2.Tos M. Cartilage tympanoplasty methods: proposal of a classification. Otolaryngol Head Neck Surg. 2008;139:747–758. doi: 10.1016/j.otohns.2008.09.021. [DOI] [PubMed] [Google Scholar]
- 3.Lee CF, Hsu LP, Chen PR, et al. Biomechanical modeling and design optimization of cartilage myringoplasty using finite element analysis. Audiol Neurootol. 2006;11:380–388. doi: 10.1159/000095900. [DOI] [PubMed] [Google Scholar]
- 4.Lee CF, Chen JH, Chou YF, et al. Optimal graft thickness for different sizes of tympanic membrane perforation in cartilage myringoplasty: a finite element analysis. Laryngoscope. 2007;117:725–730. doi: 10.1097/mlg.0b013e318031f0e7. [DOI] [PubMed] [Google Scholar]
- 5.Zahnert T, Huttenbrink KB, Murbe D, et al. Experimental investigations of the use of cartilage in tympanic membrane reconstruction. Am J Otol. 2000;21:322–328. doi: 10.1016/s0196-0709(00)80039-3. [DOI] [PubMed] [Google Scholar]
- 6.Murbe D, Zahnert T, Bornitz M, et al. Acoustic properties of different cartilage reconstruction techniques of the tympanic membrane. Laryngoscope. 2002;112:1769–1776. doi: 10.1097/00005537-200210000-00012. [DOI] [PubMed] [Google Scholar]
- 7.Rosowski JJ, Cheng JT, Ravicz ME, et al. Computer-assisted time-averaged holography of the motion of the surface of the tympanic membrane with sound stimuli of 0.4 to 25 kHz. Hear Res. 2009;253:83–96. doi: 10.1016/j.heares.2009.03.010. [DOI] [PMC free article] [PubMed] [Google Scholar]
- 8.Furlong C, Rosowski JJ, Hulli N, et al. Preliminary analyses of tympanic-membrane motion from holographic measurements. Strain. 2009;45:301–309. doi: 10.1111/j.1475-1305.2008.00490.x. [DOI] [PMC free article] [PubMed] [Google Scholar]
- 9.Hernández-Montes MDS, Furlong C, Rosowski JJ, et al. Optoelectronic holographic otoscope for measurement of nano-displacements in tympanic membrane. J. Biomed Optics. 2009;14:034023. doi: 10.1117/1.3153898. [DOI] [PMC free article] [PubMed] [Google Scholar]
- 10.Khanna SM, Tonndorf J. Tympanic membrane vibrations in cats studied by time-averaged holography. J Acoust Soc Am. 1972;51:1904–1920. doi: 10.1121/1.1913050. [DOI] [PubMed] [Google Scholar]
- 11.Tonndorf J, Khanna SM. Tympanic membrane vibrations in human cadaver ears studied by time-averaged holography. J Acoust Soc Am. 1972;52:1221–1233. doi: 10.1121/1.1913236. [DOI] [PubMed] [Google Scholar]
- 12.Schuknecht H. Temporal bone removal at autopsy. Preparation and uses. Arch Otolaryngol. 1968;87:129–137. doi: 10.1001/archotol.1968.00760060131007. [DOI] [PubMed] [Google Scholar]
- 13.Furlong C, Pryputniewicz RS. Hybrid computational and experimental approach for the study and optimization of mechanical components. Opt Eng. 1998;37:1448–1455. [Google Scholar]
- 14.Nakajima HH, Ravicz ME, Merchant SN, et al. Experimental ossicular fixations and the middle ear’s response to sound: evidence for a flexible ossicular chain. Hear Res. 2005;204:60–77. doi: 10.1016/j.heares.2005.01.002. [DOI] [PubMed] [Google Scholar]
- 15.Kreis T. Handbook of Holographic Interferometry: Optical and Digital Methods. Weinheim: Wiley-VCH Verlag GmbH & Co. KGaA; 2005. [Google Scholar]
- 16.Tonndorf J, Khanna SM. The role of the tympanic membrane in middle ear transmission. Ann Otol. 1970;79:743–753. doi: 10.1177/000348947007900407. [DOI] [PubMed] [Google Scholar]
- 17.Tonndorf J, Khanna SM. The tympanic membrane as a part of the middle ear transformer. Acta Otolaryngol. 1971;71:177–180. doi: 10.3109/00016487109125347. [DOI] [PubMed] [Google Scholar]
- 18.Shaw EG, Stinson MR. The human external and middle ear: models and concepts. In: deBoer E, Viergever MA, editors. Mechanics of Hearing. Amsterdam, The Netherlands: Delft University Press; 1983. pp. 3–10. [Google Scholar]


