

Abstract
The relative contribution of advantageous and neutral mutations to the evolutionary process is a central problem in evolutionary biology. Current estimates suggest that whereas Drosophila, mice, and bacteria have undergone extensive adaptive evolution, hominids show little or no evidence of adaptive evolution in protein-coding sequences. This may be a consequence of differences in effective population size. To study the matter further, we have investigated whether plants show evidence of adaptive evolution using an extension of the McDonald–Kreitman test that explicitly models slightly deleterious mutations by estimating the distribution of fitness effects of new mutations. We apply this method to data from nine pairs of species. Altogether more than 2,400 loci with an average length of ≈280 nucleotides were analyzed. We observe very similar results in all species; we find little evidence of adaptive amino acid substitution in any comparison except sunflowers. This may be because many plant species have modest effective population sizes.
Keywords: adaptive evolution, distribution of fitness effects, plants, effective population size, McDonald-Kreitman test
Introduction
The contribution of adaptive evolution relative to genetic drift is a fundamental problem in molecular evolution (Kimura 1983, Gillespie 1991). Several methods to estimate the fraction of adaptive substitutions, α, have been developed based on the McDonald–Kreitman (MK) test (McDonald and Kreitman 1991) that contrast polymorphism and divergence between selectively and neutrally evolving sites (Charlesworth 1994, Fay et al. 2001, Smith and Eyre-Walker 2002, Bierne and Eyre-Walker 2004, Welch 2006, Boyko et al. 2008, Eyre-Walker and Keightley 2009). These methods have been applied to a variety of species. Estimates in Drosophila (Smith and Eyre-Walker 2002, Bierne and Eyre-Walker 2004, Welch 2006, Bachtrog 2008) and rodents (Halligan et al. 2010) suggest that ≈50% of all amino acid substitutions have been fixed as a consequence of adaptive evolution and for microorganisms estimates may be even higher (Charlesworth and Eyre-Walker 2006, Liti et al. 2009). However, although analyses of DNA sequence diversity show signs of some adaptive evolution (Fay et al. 2001, Zhang and Li 2005), overall the level of adaptive evolution in hominids appears to be very low (Chimpanzee Sequencing and Analysis Consortium 2005, Zhang and Li 2005, Boyko et al. 2008, Eyre-Walker and Keightley 2009). The contrast between hominids and other animals has led to the suggestion that effective population size may be an important determinant of the rate of adaptive evolution because hominids typically have low effective population sizes in contrast to rodents, insects, and bacteria (Eyre-Walker et al. 2002, Fraser et al. 2007, Halligan et al. 2010). However, some caution should be exercised because the level of adaptive evolution is typically measured as the proportion of substitutions that are adaptive and this depends both on the numbers of substitutions that are effectively neutral and the number that are advantageous. It has been shown that the number of effectively neutral mutations is negatively correlated to the effective population size in many species (Woolfit and Bromham 2003, Woolfit and Bromham 2005, Popadin et al. 2007, Moran et al. 2008, Piganeau and Eyre-Walker 2009). Hence, the correlation between proportion of substitutions that are adaptive and Ne may be a consequence of the correlation between the proportion of effectively neutral mutations and Ne and may not reflect any change in the absolute rate of adaptive evolution.
The rate of adaptive evolution has also been studied in plants. On a genome-wide scale, previous studies in Arabidopsis thaliana have shown little evidence for adaptive evolution (Bustamante et al. 2002, Barrier et al. 2003, Schmid et al. 2005). This was attributed to the high frequency of inbreeding in A. thaliana and the reduction in effective population size that this caused. However, the outcrossing species A. lyrata (Barnaud et al. 2008, Foxe et al. 2008), the partially outcrossing cultivated tropical grass Sorghum bicolor (Hamblin et al. 2006), and the mainly outcrossing Zea species (Bijlsma et al. 1986, Ross-Ibarra et al. 2009) also show little evidence of positive selection. Instead, all these species show evidence of slightly deleterious mutations (SDMs) segregating. In contrast, to the pattern in other plant species, Strasburg et al. (2009), Ingvarsson (2010), and Slotte et al. (2010) have recently estimated that ≈75%, ≈30%, and ≈40% of fixed amino acid differences were driven by adaptive substitutions in sunflowers, aspen trees, and some Brassicaceae species, respectively.
There is evidence that SDMs contribute to variation in many populations (Akashi 1999, Cargill et al. 1999, Fay et al. 2002, Hughes 2005, Charlesworth and Eyre-Walker 2006). They are subject to weak negative selection (Nes ≈ 1), segregate at lower frequencies than neutral mutations, and contribute proportionally more to polymorphism than to divergence when compared with neutral mutations. The presence of SDMs in the analyses of Arabidopsis sp., S. bicolor, and Zea sp. may explain why there is so little apparent positive selection because SDMs are expected to bias the estimate of adaptive evolution downward if population sizes are either stationary or contracting—they can lead to an overestimate if population sizes have expanded (McDonald and Kreitman 1991, Eyre-Walker 2002). Here, we apply a method to estimate the proportion of adaptive substitutions that controls for the effects of SDMs by estimating the distribution of fitness effects (DFE) of new mutations (Eyre-Walker and Keightley 2009). It estimates the DFE from the polymorphic data and predicts the expected number of substitutions originating from neutral and SDMs. If the observed number of substitutions is greater than the expectation inferred from the DFE, it can be attributed to advantageous substitutions, yielding an estimate of α. We present a new parameterization of this method that allows us to estimate the rate of adaptive substitution relative to the rate of synonymous substitution, thereby allowing us to explore whether the rate of adaptive evolution depends on Ne independent of the effects of Ne on the number of effectively neutral substitutions.
We also apply the method of Fay et al. (2001), who suggested controlling for SDMs by removing low-frequency mutations from the analysis. We apply these methods to 11 data sets covering the divergence between nine pairs of largely independent species. We find little evidence of adaptive amino acid substitution in any comparison except sunflowers. Moreover, we estimate the effective population size and find that some of the plant species analyzed have large effective population sizes, suggesting that other factors may be more important than population size in determining the rate of adaptive evolution.
Materials and Methods
Sequence Data
Data were retrieved from Genbank (http://www.ncbi.nlm.nih.gov/Genbank) for Oryza spp. (GenBank IDs: EF000002–EF01059, Caicedo et al. 2007), Populus tremula (EU752500–EU753117, Ingvarsson 2008b), A. lyrata (BV683158–BV686427, EF502173–EF502282, EF502359–EF502483, and EF502558–EF502973, Ross-Ibarra et al. 2008; EU592234–EU592323, Foxe et al. 2008), Zea mays (BV123534–BV144210 and BV446558–BV447590, Wright et al. 2005), S. bicolor (DQ427111–DQ430705, Hamblin et al. 2006), Boechera stricta (FJ573482–FJ577247, Song et al. 2009; GQ907358–GQ910665), Schiedea globosa (GU830974–GU831538), and Helianthus petiolaris and H. annuus (Strasburg et al. 2009; supplementary table S1, Supplementary Material online). Polymorphic data for A. thaliana were downloaded from http://walnut.usc.edu/2010 and for P. balsamifera from http://www.popgen.uaf.edu/data (Olson et al. 2010).
The annotated protein-coding genome of A. thaliana was obtained from TAIR (ftp://ftp.arabidopsis.org/home/tair/Genes/TAIR8_genome_release). The annotated P. trichocarpa and S. bicolor genomes were obtained from JGI (http://genome.jpi-psf.org/Poptr1_1, Tuskan et al. 2006 and http://genome.jgi-psf.org/Sorbi1, Paterson et al. 2009). Predicted coding sequences of Z. mays were obtained from http://magi.plantgenomics.iastate.edu/downloadall.html (Fu et al. 2005) and http://ftp.maizesequence.org/release-3b.50/sequences/. The rice genome was downloaded from ftp://ftp.plantbiology.msu.edu/pub/data/Eukaryotic_Projects/o_sativa/annotation_dbs/pseudomolecules/version_6.0/all.dir/. We analyzed the polymorphism data for each of the 11 plant species. Additionally, for some data sets, information about populations were available; five populations of A. thaliana (Nordborg et al. 2005), six populations of A.lyrata (Ross-Ibarra et al. 2008), three domesticated subspecies of O. sativa, one domesticated subspecies (Z. mays mays) and one wild subspecies (Z. mays parviglumis) of Z. mays, two populations of B. stricta, three populations of S. globosa, and three populations of P.balsamifera (Keller et al. 2010).
Preparation of the Data
Sequences were aligned using ClustalW using default parameter values (Thompson et al. 1994). Coding regions were assigned using protein-coding genomic data or, if given, taken from the GenBank input files. The outgroup was assigned using the best Blast (Altschul et al. 1990) hit or, if given, taken from the polymorphism data set. We only used polymorphism data for which we could assign an outgroup sequence with the exception of A. thaliana for which no outgroup data are currently available (the A. lyrata sequence is nearly complete but unpublished). For all analyses, the number of synonymous sites served as the neutral standard. For computational reasons, the method to estimate the DFE needs all sites to have been sampled in the same number of chromosomes for each species; because some loci had been sampled in more individuals than others and other loci had missing data, we reduced the data set to a common number of chromosomes by randomly sampling the polymorphisms at each site without replacement. The numbers of synonymous and nonsynonymous sites and substitutions were computed using the F3x4 model implemented in PAML (Yang 1997) in which codon frequencies are estimated from the nucleotide frequencies at the three codon positions. The proportion of sites estimated by PAML were also used to compute the numbers of synonymous and nonsynonymous sites for the polymorphism data. For each species or population, data were summed across all genes, although analyses run on the unsummed data gave similar results (results not presented). Statistics concerning numbers of loci, numbers of sites as well as polymorphic sites are shown in table 1.
Table 1.
Summary of data sets used for the analyses. Number of coding sites (Sites) and number of segregating sites (Segregating) are from the polymorphic data. Average divergence between the species pairs at silent sites (ds) and nucleotide diversity for synonymous sites (πs). Sample size (Alleles) is constant for each species for computational reasons.
| Plant family | Ingroup | Population | Outgroup | Alleles | Loci | Sites | Segregating | ds | πs |
| Brassicaceae | Arabidopsis lyrata | A. thaliana | 24 | 72 | 22,739 | 610 | 0.15 | 0.018 | |
| Germany | 14 | 51 | 14,263 | 191 | |||||
| United States | 14 | 47 | 16,401 | 74 | |||||
| Russia | 16 | 48 | 17,332 | 93 | |||||
| Iceland | 12 | 63 | 18,651 | 142 | |||||
| Canada | 16 | 51 | 19,458 | 103 | |||||
| Sweden |
8 |
62 |
20,609 |
123 |
|||||
| A. thaliana | None | 24 | 919 | 260,737 | 3,401 | 0.007 | |||
| United States | 8 | 664 | 167,990 | 888 | |||||
| North Sweden | 8 | 742 | 191,492 | 902 | |||||
| South Sweden | 8 | 771 | 202,016 | 1,480 | |||||
| Central Europe | 8 | 789 | 211,398 | 1,430 | |||||
| England |
8 |
816 |
222,405 |
1,252 |
|||||
| Boechera stricta | A. thaliana | 24 | 134 | 40,915 | 220 | 0.21 | 0.003 | ||
| North | 16 | 130 | 38,589 | 111 | |||||
| South |
10 |
130 |
39,800 |
123 |
|||||
| Poaceae |
Sorghum bicolora |
S. propinquum |
14 |
135 |
30,241 |
129 |
0.03 |
0.006 |
|
|
Oryza rufipogon |
S. bicolora |
18 |
73 |
18,176 |
121 |
0.78 |
0.005 |
||
| O. sativaa | S. bicolora | 0.78 | 0.006 | ||||||
| Temperatea | 18 | 73 | 18,163 | 22 | |||||
| Tropicala | 18 | 71 | 17,618 | 85 | |||||
|
Indicaa |
18 |
73 |
18,197 |
68 |
|||||
| Zea maysa | S. bicolora | 0.27 | |||||||
| spp. maysa | 8 | 478 | 74,155 | 939 | 0.015 | ||||
| spp. parviglumis |
10 |
378 |
59,944 |
1,241 |
0.021 |
||||
| Salicaceae |
Populus tremula |
P. trichocarpa |
24 |
69 |
32,255 |
578 |
0.05 |
0.01 |
|
| P. balsamifera | P. trichocarpa | 24 | 508 | 174,855 | 1,446 | 0.01 | 0.004 | ||
| Central | 14 | 501 | 172,046 | 1,108 | |||||
| East | 6 | 519 | 178,473 | 643 | |||||
| North |
10 |
508 |
178,743 |
919 |
|||||
| Asteraceae |
Helianthus annuss |
H. petiolaris |
14 |
54 |
7,183 |
259 |
0.05 |
0.029 |
|
|
H. petiolaris |
H. annuus |
10 |
54 |
7,231 |
175 |
0.05 |
0.027 |
||
| Caryophyllaceae | Schiedea globosa | S. adamantis | 24 | 23 | 8,030 | 189 | 0.02 | 0.014 | |
| Maui | 14 | 23 | 8,026 | 98 | |||||
| Molokai | 12 | 23 | 8,029 | 122 | |||||
| Oahu | 12 | 23 | 8,027 | 122 |
Includes domesticated species.
The DFE of new mutations and the proportion of adaptive substitutions (α) were estimated using the method II of Eyre-Walker and Keightley (2009), which accounts for the segregation and fixation of SDMs. To estimate the rate of adaptive evolution in a manner that is independent of the number of effectively neutral substitutions, we reparameterize the method as follows. In the original formulation, the expected numbers of synonymous, Ds, and nonsynonymous, Dn, substitutions were as follows:
 |
where Ls and Ln are the numbers of synonymous and nonsynonymous sites, u is the nucleotide mutation rate, and t is the time of divergence. D(S) is the distribution of S, the strength of selection (multiplied by four times the effective population size), P(S) is Ne times the probability of fixation, and α is the proportion of substitutions that are adaptive. We can reparameterize the expression for Dn as follows:
 |
where ωa is the ratio of the rate of adaptive nonsynonymous substitution to synonymous substitution. This is similar to the parameterizations given by Bierne and Eyre-Walker (2004) and Obbard et al. (2009).
Levels of polymorphism were quantified using Watterson's estimator of 4Neμ (θW) (Watterson 1975) and nucleotide diversity, π (Tajima 1983) for synonymous sites. Our estimates of π and θW differ slightly from previous published estimates due to the fact that we have excluded some data and alleles from our analysis. We estimated the effective population size using the level of synonymous site diversity and dividing this by an estimate of the mutation rate per generation. Estimates of the synonymous mutation rate per year and generation times were taken from the literature: For species A. thaliana, A. lyrata, and B. stricta, we assumed, as other have done, the mutation rate of μ = 1.5×10 − 8 (9.9×10 − 9 to 2.1×10 − 8) per site per year as estimated in the Brassicaceae (Koch et al. 2000) and a generation time of 1 year for the annual A. thaliana (Koornneef et al. 2004) and 2 years for the perennials B. stricta (Dobes et al. 2004) and A. lyrata (Ross-Ibarra et al. 2008). For the genera Oryza, Sorghum, Helianthus, and Zea, we assumed the mutation rate to be μ = 1.0×10 − 8 (6×10 − 9 to 1.7×10 − 8) and a generation time of 1 year (Swigonová et al. 2004, Strasburg and Rieseberg 2008); for Populus, we assumed a mutation rate of μ = 2.5×10 − 9 (1.7×10 − 9 to 3.5×10 − 9) per site per year and a generation time of 15 years (Koch et al. 2000, Tuskan et al. 2006, Ingvarsson 2008b); and for Schiedea, we assumed a mutation rate of μ = 1.9×10 − 8 (1.4×10 − 8 to 4.6×10 − 8) per site per year and a generation time of 5 years (Filatov and Burke 2004, Wallace et al. 2009).
Simulations
To investigate the effects of population structure on our estimates of adaptive evolution, we performed forward population genetic simulations using SFS_CODE (Hernandez 2008). We investigated two scenarios. In the first, we have migration between two populations that divided sometime in the past and have continued to exchange migrants, but we only sample from one of the populations; and in the second, we sample from both populations equally. To simulate these two scenarios, we divided an ancestral population into three equal sized populations of 500 individuals 20,000 generations in the past; with a mutation rate of μ= 5×10 − 6 per site per generation, this would give an expected divergence at neutral sites of 20%, which is similar to that seen in some of our data sets. We allowed one of the populations to evolve independently; this was the outgroup. The other two populations exchanged migrants at various rates of 4Nem ranging from 0.01 to 10. All populations were subjected to mutation at 4Neu = 0.01 at 100 uncoupled loci with a length of 1,002 nucleotides each. Each simulation was repeated 100 times. Because SFS_CODE and convertSFS_CODE do not allow population mixing or the sampling of two populations, we allowed the two populations to exchange migrants at a very high rate (4Nem = 250) for the last five generations of the simulation (Supplementary fig. S1, Supplementary Material online).
Results
Data
To estimate the rate of adaptive substitution in plant protein-coding sequences, we compiled polymorphism data from 11 species and aligned 10 of these to outgroups to analyze the divergence between 9 pairs of species. The data sets range dramatically in size from 23 to 919 loci per species and 6 to 24 sequences per gene (table 1). Note that we treat O. sativa and O. rufipogon as the same species in our analysis, O. sativa being the domesticate of O. rufipogon. For most genera, we have access to polymorphism data from wild populations (A. lyrata, A. thaliana, B. stricta, P. tremula, P. balsamifera, O. rufipogon, H. annuus, H. petiolaris, and S. globosa); for one species from both wild and domesticated populations (Z. mays) and for the species S. bicolor and O. sativa, we only have data from domesticated populations. We use the polymorphism data of 11 species to estimate the DFE of new mutations and use this to further estimate the proportion and relative rates of adaptive substitutions between species. Our comparisons for Boechera, P. balsamifera, Schiedea, and Oryza are the first large-scale investigations of adaptive evolution in these groups. The available outgroup data only allow us to estimate the rate of adaptive substitution between nine pairs of species. We include the polymorphism data from A. thaliana as a comparison for the results obtained from A. lyrata; note also that the divergences between the Brassicaceae species and the Poaceae species are not entirely independent because the same outgroup (A. thaliana and S. bicolor, respectively) is used for different species. Based on average ds values (table 1), A. thaliana and A. lyrata share ≈30% of their divergence with B. stricta and O. rufipogon and Z. mays share ≈22% of their divergence with S. bicolor.
Distribution of Effects of New Mutations
Species-wide (e.g., ignoring population information within species) estimates of the DFE show a remarkably consistent picture among the investigated species (fig. 1) with the exception of B. stricta, P.balsamifera, and S. globosa. For all species, the largest proportion of mutations have Nes > 100 and hence are strongly deleterious and for most species less than 25% of amino acid–changing mutations behave as effectively neutral (0 < Nes < 1).
FIG. 1.

The DFE in 11 plant species. Estimates are given for the proportion of mutations in four different Nes ranges and SEs. For Z. mays, the results are shown for Z. mays spp. parviglumis.
In contrast to this, B. stricta, P. balsamifera, and S. globosa show an excess of neutral mutations ( > 25%) and a decrease of strongly deleterious mutations ( < 55%). The confidence intervals vary between species due to the varying sample sizes. Our estimates of the DFE are not greatly affected by the removal of singletons, suggesting that sequencing errors are not an issue (Supplementary fig. S2, Supplementary Material online). We additionally estimated the DFE from individual wild populations of Arabidposis, Populus, Boechera, and Schiedea. For all populations of A. thaliana and A. lyrata (Supplementary fig. S3, Supplementary Material online), the distributions between and within these species are fairly similar to each other, although the confidence intervals for A. lyrata are larger because of the smaller data set. In all the investigated Arabidopsis populations more than 50% of the mutations are strongly deleterious (Nes > 100) and more than 18% behave as effectively neutral (0 < Nes < 1). In contrast, populations of B. stricta and S. globosa show differences in their DFE, whereas populations of P. balsamifera are remarkably similar to each other (Supplementary fig. S4, Supplementary Material online). Additionally, we find some differences between the DFE estimated from the wild and domesticated populations of rice (Supplementary fig. S5, Supplementary Material online). Both domesticated varieties of O. japonica show a higher proportion of effectively neutral mutations than O. rufipogon, which may reflect the lower effective population of the domesticated varieties; the DFE for the domesticated populations of O. japonica are more like that found in B. stricta, P. balsamifera, and S. globosa. In contrast, O. indica shows a very different DFE both to other Oryza species and to all other plant species, with many mutations inferred to be slightly or mildly deleterious (1 < Nes < 100). However, the confidence intervals are large. The DFE inferred from domesticated Z. mays is similar to the wild population. These results suggest that the method to estimate the DFE copes well with the different demographic histories these populations have experienced, except possibly during some domestication events.
Adaptive Substitutions
Surprisingly, we find little evidence of adaptive evolution in any of the species we have considered (supplementary fig. 2, Supplementary Material online), except in one sunflower comparison, despite the fact that we have controlled for the effects of SDMs, which tend to bias estimates of adaptive evolution downward. The estimates of α are positive in the comparisons involving Populus species and S. globosa, but these are less than 15% and nonsignificant; the estimate of α using the polymorphism data from H. petiolaris is significantly positive. All other comparisons are negative, with the estimate using B. stricta being significantly negative, but not after correction for multiple tests. We obtain similar results for estimates of α for 23 subpopulations of seven species (supplementary table S1, Supplementary Material online) with all positive estimates being nonsignificant.
The mean estimate of α across all ten species-wide comparisons is − 0.18 (standard error [SE] = 0.47). This is not significantly different from zero, suggesting that plants generally go through very little adaptive evolution in their protein-coding sequences; however, it should be appreciated that we have overestimated the SE because of the nonindependence between some of the data sets. Similar results are obtained if we estimate ωa, the rate of adaptive nonsynonymous substitution relative to the rate of synonymous substitution (fig. 2b).
FIG. 2.
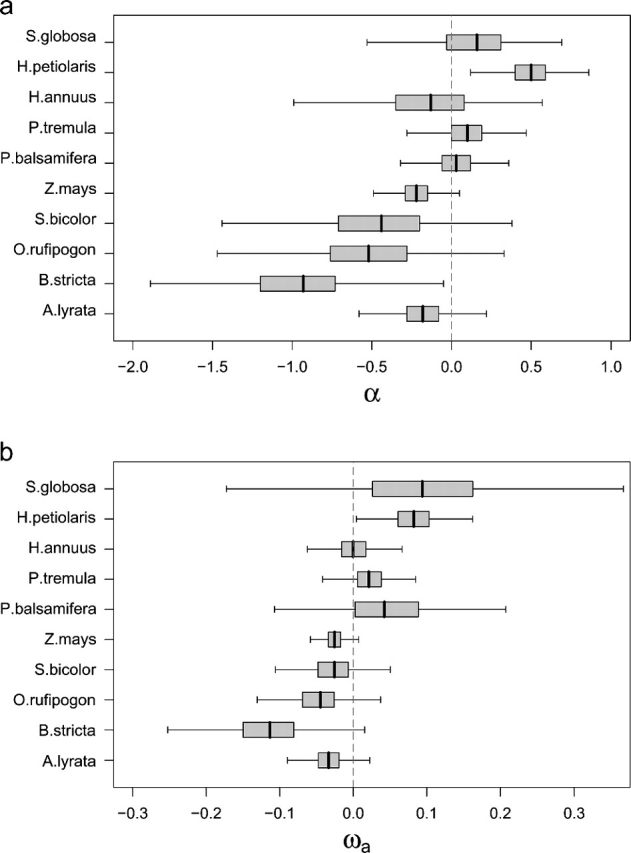
Estimates of α and ωa for ten plant comparisons. Mean estimates as well as 50% and 95% confidence intervals are indicated by the box plots. For Z. mays, the results are shown for Z. mays spp. parviglumis. Note the H. petiolaris and H. annuus analyses are for the same divergence using polymorphism data from different species.
Although the method, which we have used to control for SDMs in the estimation of α, appears to be robust (Eyre-Walker and Keightley 2009), we also estimated the proportion of adaptive substitutions using a simple method based on the MK test, which just uses the numbers of synonymous and nonsynonymous polymorphisms and substitution summed across genes (Fay et al. 2001) rather than the full site frequency spectrum. Estimates of α are negative in all species except H. petiolaris and S. globosa when we consider all polymorphisms (supplementary table S2, Supplementary Material online). Furthermore, the α estimates for the Populus species become positive if we remove polymorphisms below 15% to control for the effects of SDMs (supplementary table S2, Supplementary Material online). However, all positive estimates based on the method of Fay et al. (2001) are nonsignificant.
Discussion
We have estimated the proportion of nonsynonymous substitutions that are due to positive adaptive evolution in a range of plant species using an extension of the MK test. Surprisingly, we find little evidence of adaptive evolution in the plant species we have investigated; in four of the comparisons, the estimates of α, the proportion of substitutions driven by positive selection, are greater than zero, but for three of them, the estimates are less than 15% and not significantly different from zero. Similar results are obtained when we estimate ωa, the rate of adaptive amino acid substitution relative to the rate of synonymous substitution. The low estimated rate of adaptive evolution is consistent with previous estimates in Arabidopsis sp., Sorghum, and Zea (Bustamante et al. 2002, Hamblin et al. 2006, Foxe et al. 2008, Ross-Ibarra et al. 2009); however, in these previous analyses, it was not possible to exclude the possibility that the low estimates of adaptive evolution were simply a consequence of the segregation of SDMs, which tend to bias estimates of adaptive evolution downward (Fay et al. 2001, Charlesworth and Eyre-Walker 2008). In our analyses, we have used a method that explicitly models SDMs and takes these into account. Our estimate of α in the Helianthus species is also broadly consistent with the estimate of 75% obtained by Strasburg et al. (2009). Using the same data, we find significant evidence of adaptive evolution when we consider the divergence between H. annuus and H. petiolaris using the polymorphism data from H. petiolaris and a nonsignificant estimate of α when we use the polymorphism data from H. annuus. In both cases, our estimate of α is lower than that obtained by Strasburg et al. (2009), but there are several methodological differences between the analyses so this is perhaps not surprising and the confidence intervals on all estimates are large. Our estimate of α is also lower than the ≈30% estimate obtained by Ingvarsson (2010) for the divergence between P. tremula and P. trichocarpa using a similar data set but the method of Bierne and Eyre-Walker (2004); this seems to be largely due to the fact that we had to reduce those genes for which Ingvarsson had 38 haploid genomes to 24 so that all genes would have the same number of sampled chromosomes—this is a limitation of the Eyre-Walker and Keightley (2009) method used here. If we apply the method of Bierne and Eyre-Walker (2004) to our reduced data set removing polymorphisms below a frequency of 15%, as Ingvarsson did, we estimate α to be 0.1303 (95% confidence intervals: − 0.2447 to 0.3928), which is similar to the estimate obtained using the Eyre-Walker and Keightley (2009) method.
There are several reasons why the estimated rate of adaptive evolution might be low in plants. First, limited evidence in animals suggests that the proportion of adaptive substitutions may depend on the effective population size; primates appear to have relatively low rates of adaptive evolution and also low effective population sizes, whereas mice, Drosophila, and enteric bacteria have high rates of adaptive evolution (Smith and Eyre-Walker 2002, Bierne and Eyre-Walker 2004, Welch 2006, Charlesworth and Eyre-Walker 2006, Bachtrog 2008) and also large effective population sizes (Andolfatto 2001, Charlesworth and Eyre-Walker 2006, Piganeau and Eyre-Walker 2009). There is some evidence of this relationship in plants as well, with species such as Capsella grandiflora and H. petiolaris, which have large effective population sizes (Strasburg and Rieseberg 2008, Foxe et al. 2009), showing high rates of adaptive evolution (Strasburg et al. 2009, Slotte et al. 2010). This relationship between population size and the rate of adaptive evolution is expected if the rate of adaptive evolution is limited by the supply of advantageous mutations because species with large populations produce advantageous mutations at a higher rate, and selection is also more effective on those that are weakly selected. To investigate whether plants have low effective population sizes like primates, we estimated the effective population size in our plant species using estimates of θW from the loci involved in our analyses and estimates of the mutation rate per generation and generation time from the literature (see Materials and Methods). These estimates should be treated with caution because the mutation rate has not been directly estimated in plants, and actual demographic processes presumably deviate from the assumptions of these models.
The effective population sizes vary quite substantially between our species from B. stricta with an effective population size of just more than 25,000 to H. annuus with an Ne of more than 800,000, but most species have relatively modest population sizes of tens of thousands to just more than 100,000 (fig. 3). Our estimates agree closely with those previous estimates for O. rufipogon, but our estimate is lower than the previous estimate from P. tremula; Ingvarsson (2008b) used the mode θW value and estimated Ne to be 118,000, which is roughly two times larger than our estimate. As expected, our estimates for Helianthus species are midway between the estimates of the ancestral and derived population sizes for these species, which have undergone a recent population size expansion (Strasburg and Rieseberg 2008).
FIG. 3.

Estimates of the effective population sizes (Ne) for 11 different plant species based on θW. The confidence intervals are based on SE of the mutation rate μ.
The population-specific estimates of Ne (supplementary table S1, Supplementary Material online) are similar to the overall estimate of Ne in A. thaliana, B. stricta, P. balsamifera, and S. globosa and the estimates for the domesticated populations of rice and maize are substantially lower than for their wild relatives. In contrast to the other wild populations, in A. lyrata, the overall Ne is considerably greater than the population-specific estimates except the German population, reflecting the high level of population structure in this species (Ross-Ibarra et al. 2008). It therefore seems that most of these plants generally have higher effective population sizes than humans and chimpanzees, which have Ne values of 10,000–30,000 (Eyre-Walker et al. 2002). Zea mays has an effective population size of 500,000, which is of similar magnitude to that of rodents (Mus domesticus = 160,000, Eyre-Walker et al. 2002 and M. castaneus = 500,000 Halligan et al. 2010), species for which α is estimated to be 60%, and yet, it shows no evidence of adaptive evolution. Only the sunflower species show some evidence of adaptive evolution in our analysis and these do indeed have the largest effective population sizes; also C. grandiflora shows evidence of adaptive evolution (Slotte et al. 2010) and a large effective population size (Foxe et al. 2009). These results therefore suggest that the rate of adaptive evolution might be correlated to effective population size but that many plants do not undergo high rates because they have relatively small population sizes.
Although there appears to be no relationship between the current estimate of the effective population size and the rate of adaptive evolution in plants, the low estimates of α and ωa could be an artifact of a contracting population. If there are SDMs segregating and current population sizes are smaller than during the divergence between the species being considered, then α (and ωa) will be underestimated (McDonald and Kreitman 1991, Eyre-Walker 2002) because some SDMs that currently segregate would not have segregated or become fixed in the past. The extent of the bias depends on the magnitude of the difference in effective population size between the polymorphism and divergence phases, the DFE of new mutations, and the true level of adaptive evolution (Eyre-Walker 2002, Eyre-Walker and Keightley 2009). However, contracting effective population size seems an unlikely explanation for the patterns we observe in plants because we see little evidence of adaptive evolution across nine comparisons. In contrast, an expansion in population size might explain why sunflowers show evidence of adaptive evolution because they have recently undergone population expansion (Strasburg and Rieseberg 2008) and expansion can lead to an overestimate of adaptive evolution (McDonald and Kreitman 1991, Eyre-Walker 2002, Eyre-Walker and Keightley 2009).
A third possible explanation for the low levels of adaptive evolution in plants is population structure. Population structure can reduce the probability that an advantageous mutation will become fixed if migration rates are low because of the increased influence of drift within subdivided populations and the added influence of population extinction (Charlesworth et al. 2003, Whitlock 2003). Unfortunately, we do not have information about population structure for most of the species we have considered; A. thaliana and A. lyrata show contrasting levels of structure, so it is unclear what level of structure there was during the divergence of these species. Population structure could affect our estimates in two ways. First, it is possible that population structure could lead to biases in our method to estimate the DFE and hence the rate of adaptive evolution; this seems unlikely because our method gives similar estimates of the DFE for both the total population and each sub-population of Arabidopsis. Furthermore, it gives similar estimates to the method of Fay et al. (2001) when rare single nucleotide polymorphisms are excluded. However, to investigate the matter further, we performed a series of simulations in which we had two subpopulations with varying levels of migration between them (Supplementary fig. S1a and b, Supplementary Material online). Our method successfully estimates the proportion of adaptive substitutions irrespective of the level of migration (supplementary table S3, Supplementary Material online) if the polymorphism data are sampled from one subpopulation only. The method of Eyre-Walker and Keightley (2009) overestimated α if the level of migration was low between the two subpopulations and the polymorphism data included samples from both subpopulations. This is due to an excess of fixed differences between the two subpopulations, which will be treated as polymorphisms in a common data set and hence strongly affect the site frequency spectrum.
We may have also underestimated α because recent gene duplications are probably underrepresented in our data because of problems of identifying orthologs. Plant genomes contain high frequencies of duplicated genes (Arabidopsis Genome Initiative, 2000; The International Rice Genome Sequencing Project 2005, Tuskan et al. 2006, Jaillon et al. 2007) due to polyploidization (Blanc and Wolfe 2004, Soltis PS and Soltis DE 2009) and tandem duplications (Rizzon et al. 2006). These have been shown to have higher levels of adaptive evolution than single copy genes, at least in mammals (Han et al. 2009). Thus, we may be missing much of the adaptive evolution that goes in plants simply because it occurs in the divergence of paralogs, which we have not sampled. There may also be a bias toward conserved genes, particularly in the more divergent taxa, because of the need to be able to correctly identify the ortholog; if conserved genes undergo less adaptive evolution, then α will be underestimated.
In the MK framework, it is assumed that one category of mutations, in this analysis the synonymous mutations, are neutral. However, there is evidence in at least in Populus species that selection acts on synonymous codon use (Ingvarsson 2008a). Predicting the effects of selection, on the putatively neutral sites, on the estimation of the DFE and rates of adaptive evolution is not straightforward and deserves more investigation. If nonsynonymous polymorphisms are on average more deleterious than synonymous mutations, then the MK test and methods that estimate α from it are expected to be conservative if populations sizes are stationary, this is because the nonsynonymous polymorphisms are less likely to be fixed than the synonymous polymorphisms. With nonstationary population size, the predictions become complex. The fact that our method estimates a proportion of mutations to be slightly deleterious (1 < Nes < 10) in all species suggests that nonsynonymous polymorphisms are on average more deleterious than their synonymous counterparts. However, it is possible that selection at synonymous sites along with demographic changes is inducing an underestimate of α.
One potential problem with some of our comparisons is the very low level of divergence between the ingroup and outgroup species. It is intriguing that all three of the species pairs for which α is positive have a low level of synonymous divergence relative to nucleotide diversity: H. petiolaris (polymorphism)–H. annuus (outgroup) = 1.7, S. globosa–S. adamantis = 1.1, P. tremula–P. trichocarpa = 4.7, and P. balsamifera–P. trichocarpa = 2.1. Only H. annuus–H. petiolaris and S. bicolor–S. propinquum have comparable ratios; all other comparisons have a ratio greater than 10. This may lead to either an overestimation of α because the fixation time becomes important; advantageous and SDMs go to fixation faster than neutral mutations if they are due to fix (Kimura 1983) so there may be a time after the divergence of species where sites subject to selection are more likely to show fixed differences than neutral sites because the mutations are more likely to have already spread to fixation (Bierne and Eyre-Walker 2004). The application of the MK framework to closely related species requires more investigation. Although some of the species are very closely related to each other, rice is highly divergent from its outgroup sorghum; this could lead to an overestimate of α because we might expect synonymous sites to become saturated. There is no evidence of this effect in our data because the estimate of α for the divergence between rice and sorghum is negative.
The lack of adaptive evolution in plants is particularly surprising in some genera, such as Schiedea. Schiedea is a Hawaiian endemic that adapted to a wide range of ecological conditions (from cool rainforest to arid desert-like conditions of coastal cliffs) and evolved extremely different morphology (ranging from vines to bushes) and reproductive biology (dioecy, gynodioecy, and hermaphrodites) (Wagner et al. 2005). Given fairly low divergence between species in the genus (Ks < 4%), all the morphological and ecological diversity in Schiedea has evolved surprisingly rapidly. Thus, one might expect that species in the genus evolved under fairly strong selection, which should be detectable in Schiedea genes. Indeed, phylogeny-based maximum likelihood analysis revealed that positive selection is more widespread in Schiedea genes compared with mainland plant groups (Kapralov VK, Votintseva AA, Filatov DA, unpublished data). Thus, it is somewhat surprising that this rapidly evolving Hawaiian endemic does not show significantly positive α. However, in the current paper, the Schiedea data set is the smallest of all, and adding more genes might provide evidence of positive selection in Schiedea genes. On the other hand, the current analysis is restricted to population-level evolutionary processes in only one of the species. Thus, the approach presented in the current paper cannot detect positive selection that might have acted during the early history of the genus while it adapted to diverse ecological conditions.
Although the influence of effective population size on the rate of adaptive evolution in plants is unclear, there is a clear effect of Ne on the DFE; species with small Ne, such as B. stricta, P. balsamifera, and S. globosa, tend to have a relatively high proportion of mutations that are effectively neutral; there is a significant negative correlation between Pn/Ps and Ne, even when we take into account the nonindependence between these two statistics (fig. 4; r = − 0.75, p = 7×10 − 3, Spearman rank test) using the method of Piganeau and Eyre-Walker (2009) (note we do not add one to denominator, as suggested by Piganeau and Eyre-Walker because Ps is sufficiently large that this correction makes no difference). In contrast to the proportion of mutations that are effectively neutral, the proportion of mutations that are slightly deleterious, 1 < Nes < 10, and to a lesser extent the proportion of mutations that are moderately deleterious, 10 < Nes < 100, do not vary very much between species.
FIG. 4.

The correlation between Pn/Ps and Ne. Pn/Ps and Ne were estimated independently from two estimates of Ps that were obtained by splitting Ps into two independent halves according to the method suggested by Piganeau and Eyre-Walker (2009).
Conclusions
We have estimated the proportion of nonsynonymous substitutions that are a consequence of positive adaptive evolution between nine pairs of plant species; we find little evidence of adaptive evolution in any of them. This is in striking contrast to Drosophila, bacteria and mice in which rates of adaptive evolution have been estimated to be substantial. The low estimate is unlikely to be a methodological artifact, and it does not appear due to low effective population size because some plants appear to have population sizes that rival that of mice. It therefore seems that the rate of adaptive evolution may be determined by other reasons as much as by effective population size and plants may have an outstanding role.
Supplementary Material
Supplementary tables S1–S3 and figures S1–S5 are available at Molecular Biology and Evolution online (http://www.mbe.oxfordjournals.org/).
Supplementary Material
Acknowledgments
We are grateful for the access to the maize genome data, which were produced by the Genome Sequencing Center at Washington University School of Medicine in St Louis. We thank Matt Olson and Peter Tiffin for making the P. balsamifera data rapidly and readily available for the analysis. T.I.G. was financially supported by the John Maynard Smith studentship. The work was supported by the John Maynard Smith, National Science Foundation (award EF-0723447), the National Institute of Health (award R01 GM086496), Natural Environment Research Council UK, Duke University, the University of Sussex, and the Max Planck Society.
References
- Akashi H. Inferring the fitness effects of DNA mutations from polymorphism and divergence data: statistical power to detect directional selection under stationarity and free recombination. Genetics. 1999;151:221–238. doi: 10.1093/genetics/151.1.221. [DOI] [PMC free article] [PubMed] [Google Scholar]
- Altschul SF, Gish W, Miller W, Myers EW, Lipman DJ. Basic local alignment search tool. J Mol Biol. 1990;215:403–410. doi: 10.1016/S0022-2836(05)80360-2. [DOI] [PubMed] [Google Scholar]
- Andolfatto P. Contrasting patterns of X-linked and autosomal nucleotide variation in Drosophila melanogaster and Drosophila simulans. Mol Biol Evol. 2001;18:279–290. doi: 10.1093/oxfordjournals.molbev.a003804. [DOI] [PubMed] [Google Scholar]
- Arabidopsis Genome Initiative. Analysis of the genome sequence of the flowering plant Arabidopsis thaliana. Nature. 2000;408:796–815. doi: 10.1038/35048692. [DOI] [PubMed] [Google Scholar]
- Bachtrog D. Similar rates of protein adaptation in Drosophila miranda and D. melanogaster, two species with different current effective population sizes. BMC Evol Biol. 2008;8:334. doi: 10.1186/1471-2148-8-334. [DOI] [PMC free article] [PubMed] [Google Scholar]
- Barnaud A, Trigueros G, McKey D, Joly HI. High outcrossing rates in fields with mixed sorghum landraces: how are landraces maintained? Heredity. 2008;101:445–452. doi: 10.1038/hdy.2008.77. [DOI] [PubMed] [Google Scholar]
- Barrier M, Bustamante CD, Yu J, Purugganan MD. Selection on rapidly evolving proteins in the Arabidopsis genome. Genetics. 2003;163:723–733. doi: 10.1093/genetics/163.2.723. [DOI] [PMC free article] [PubMed] [Google Scholar]
- Bierne N, Eyre-Walker A. The genomic rate of adaptive amino acid substitution in Drosophila. Mol Biol Evol. 2004;21:1350–1360. doi: 10.1093/molbev/msh134. [DOI] [PubMed] [Google Scholar]
- Bijlsma R, Allard RW, Kahler AL. Nonrandom mating in an open-pollinated maize population. Genetics. 1986;112:669–680. doi: 10.1093/genetics/112.3.669. [DOI] [PMC free article] [PubMed] [Google Scholar]
- Blanc G, Wolfe KH. Widespread paleopolyploidy in model plant species inferred from age distributions of duplicate genes. Plant Cell. 2004;16:1667–1678. doi: 10.1105/tpc.021345. [DOI] [PMC free article] [PubMed] [Google Scholar]
- Boyko AR, Williamson SH, Indap AR, et al. 14 co-authors. Assessing the evolutionary impact of amino acid mutations in the human genome. PLoS Genet. 2008;4 doi: 10.1371/journal.pgen.1000083. e1000083. [DOI] [PMC free article] [PubMed] [Google Scholar]
- Bustamante CD, Nielsen R, Sawyer SA, Olsen KM, Purugganan MD, Hartl DL. The cost of inbreeding in Arabidopsis. Nature. 2002;416:531–534. doi: 10.1038/416531a. [DOI] [PubMed] [Google Scholar]
- Caicedo AL, Williamson SH, Hernandez RD, et al. 12 co-authors. Genome-wide patterns of nucleotide polymorphism in domesticated rice. PLoS Genet. 2007;3:1745–1756. doi: 10.1371/journal.pgen.0030163. [DOI] [PMC free article] [PubMed] [Google Scholar]
- Cargill M, Altshuler D, Ireland J, et al. 18 co-authors. Characterization of single-nucleotide polymorphisms in coding regions of human genes. Nat Genet. 1999;22:231–238. doi: 10.1038/10290. [DOI] [PubMed] [Google Scholar]
- Charlesworth B. The effect of background selection against deleterious mutations on weakly selected, linked variants. Genet Res. 1994;63:213–227. doi: 10.1017/s0016672300032365. [DOI] [PubMed] [Google Scholar]
- Charlesworth B, Charlesworth D, Barton N. The effects of genetic and geographic structure on neutral variation. Annu Rev Ecol Evol Syst. 2003;34:99–125. [Google Scholar]
- Charlesworth J, Eyre-Walker A. The rate of adaptive evolution in enteric bacteria. Mol Biol Evol. 2006;23:1348–1356. doi: 10.1093/molbev/msk025. [DOI] [PubMed] [Google Scholar]
- Charlesworth J, Eyre-Walker A. The McDonald-Kreitman test and slightly deleterious mutations. Mol Biol Evol. 2008;25:1007–1015. doi: 10.1093/molbev/msn005. [DOI] [PubMed] [Google Scholar]
- Chimpanzee Sequencing and Analysis Consortium. Initial sequence of the chimpanzee genome and comparison with the human genome. Nature. 2005;437:69–87. doi: 10.1038/nature04072. [DOI] [PubMed] [Google Scholar]
- Dobes CH, Mitchell-Olds T, Koch MA. Extensive chloroplast haplotype variation indicates Pleistocene hybridization and radiation of North American Arabis drummondii, A. x divaricarpa, and A. holboellii (Brassicaceae. Mol Ecol. 2004;13:349–370. doi: 10.1046/j.1365-294x.2003.02064.x. [DOI] [PubMed] [Google Scholar]
- Eyre-Walker A. Changing effective population size and the McDonald-Kreitman test. Genetics. 2002;162:2017–2024. doi: 10.1093/genetics/162.4.2017. [DOI] [PMC free article] [PubMed] [Google Scholar]
- Eyre-Walker A, Keightley PD. Estimating the rate of adaptive molecular evolution in the presence of slightly deleterious mutations and population size change. Mol Biol Evol. 2009;26:2097–2108. doi: 10.1093/molbev/msp119. [DOI] [PubMed] [Google Scholar]
- Eyre-Walker A, Keightley PD, Smith NGC, Gaffney D. Quantifying the slightly deleterious mutation model of molecular evolution. Mol Biol Evol. 2002;19:2142–2149. doi: 10.1093/oxfordjournals.molbev.a004039. [DOI] [PubMed] [Google Scholar]
- Fay JC, Wyckoff GJ, Wu CI. Positive and negative selection on the human genome. Genetics. 2001;158:1227–1234. doi: 10.1093/genetics/158.3.1227. [DOI] [PMC free article] [PubMed] [Google Scholar]
- Fay JC, Wyckoff GJ, Wu CI. Testing the neutral theory of molecular evolution with genomic data from Drosophila. Nature. 2002;415:1024–1026. doi: 10.1038/4151024a. [DOI] [PubMed] [Google Scholar]
- Filatov DA, Burke S. DNA diversity in Hawaiian endemic plant Schiedea globosa. Heredity. 2004;92:452–458. doi: 10.1038/sj.hdy.6800440. [DOI] [PubMed] [Google Scholar]
- Foxe JP, Slotte T, Stahl EA, Neuffer B, Hurka H, Wright SI. Recent speciation associated with the evolution of selfing in Capsella. Proc Natl Acad Sci U S A. 2009;106:5241–5245. doi: 10.1073/pnas.0807679106. [DOI] [PMC free article] [PubMed] [Google Scholar]
- Foxe JP, un Nisa Dar V, Zheng H, Nordborg M, Gaut BS, Wright SI. Selection on amino acid substitutions in Arabidopsis. Mol Biol Evol. 2008;25:1375–1383. doi: 10.1093/molbev/msn079. [DOI] [PMC free article] [PubMed] [Google Scholar]
- Fraser C, Hanage WP, Spratt BG. Recombination and the nature of bacterial speciation. Science. 2007;315:476–480. doi: 10.1126/science.1127573. [DOI] [PMC free article] [PubMed] [Google Scholar]
- Fu Y, Emrich SJ, Guo L, Wen TJ, Ashlock DA, Aluru S, Schnable PS. Quality assessment of maize assembled genomic islands (MAGIs) and large-scale experimental verification of predicted genes. Proc Natl Acad Sci U S A. 2005;102:12282–12287. doi: 10.1073/pnas.0503394102. [DOI] [PMC free article] [PubMed] [Google Scholar]
- Gillespie JH. The causes of molecular evolution. Oxford: Oxford University Press; 1991. [Google Scholar]
- Halligan DL, Oliver F, Eyre-Walker A, Harr B, Keightley PD. Evidence for pervasive adaptive protein evolution in wild mice. PLoS Genet. 2010;6 doi: 10.1371/journal.pgen.1000825. e1000825. [DOI] [PMC free article] [PubMed] [Google Scholar]
- Hamblin MT, Casa AM, Sun H, Murray SC, Paterson AH, Aquadro CF, Kresovich S. Challenges of detecting directional selection after a bottleneck: lessons from Sorghum bicolor. Genetics. 2006;173:953–964. doi: 10.1534/genetics.105.054312. [DOI] [PMC free article] [PubMed] [Google Scholar]
- Han MV, Demuth JP, McGrath CL, Casola C, Hahn MW. Adaptive evolution of young gene duplicates in mammals. Genome Res. 2009;19:859–867. doi: 10.1101/gr.085951.108. [DOI] [PMC free article] [PubMed] [Google Scholar]
- Hernandez RD. A flexible forward simulator for populations subject to selection and demography. Bioinformatics. 2008;24:2786–2787. doi: 10.1093/bioinformatics/btn522. [DOI] [PMC free article] [PubMed] [Google Scholar]
- Hughes AL. Evidence for abundant slightly deleterious polymorphisms in bacterial populations. Genetics. 2005;169:533–538. doi: 10.1534/genetics.104.036939. [DOI] [PMC free article] [PubMed] [Google Scholar]
- Ingvarsson PK. Molecular evolution of synonymous codon usage in Populus. BMC Evol Biol. 2008a;8:307. doi: 10.1186/1471-2148-8-307. [DOI] [PMC free article] [PubMed] [Google Scholar]
- Ingvarsson PK. Multilocus patterns of nucleotide polymorphism and the demographic history of. Populus tremula. Genetics. 2008b;180:329–340. doi: 10.1534/genetics.108.090431. [DOI] [PMC free article] [PubMed] [Google Scholar]
- Ingvarsson PK. Natural selection on synonymous and nonsynonymous mutations shapes patterns of polymorphism in Populus tremula. Mol Biol Evol. 2010;27:650–660. doi: 10.1093/molbev/msp255. [DOI] [PubMed] [Google Scholar]
- The International Rice Genome Sequencing Project. The map-based sequence of the rice genome. Nature. 2005;436:793–800. doi: 10.1038/nature03895. [DOI] [PubMed] [Google Scholar]
- Jaillon O, Aury JM, Noel B, et al. 57 co-authors. The grapevine genome sequence suggests ancestral hexaploidization in major angiosperm phyla. Nature. 2007;449:463–467. doi: 10.1038/nature06148. [DOI] [PubMed] [Google Scholar]
- Keller S, Olson M, Silim S, Schroeder W, Tiffin P. Genomic diversity, population structure, and migration following rapid range expansion in the balsam poplar. Populus balsamifera. Mol Ecol. 2010;19:1212–1226. doi: 10.1111/j.1365-294X.2010.04546.x. [DOI] [PubMed] [Google Scholar]
- Kimura M. The neutral theory of molecular evolution. Cambridge: Cambridge University Press; 1983. [Google Scholar]
- Koch MA, Haubold B, Mitchell-Olds T. Comparative evolutionary analysis of chalcone synthase and alcohol dehydrogenase loci in Arabidopsis, Arabis, and related genera (Brassicaceae) Mol Biol Evol. 2000;17:1483–1498. doi: 10.1093/oxfordjournals.molbev.a026248. [DOI] [PubMed] [Google Scholar]
- Koornneef M, Alonso-Blanco C, Vreugdenhil D. Naturally occurring genetic variation in Arabidopsis thaliana. Annu Rev Plant Biol. 2004;55:141–172. doi: 10.1146/annurev.arplant.55.031903.141605. [DOI] [PubMed] [Google Scholar]
- Liti G, Carter DM, Moses AM, et al. 26 co-authors. Population genomics of domestic and wild yeasts. Nature. 2009;458:337–341. doi: 10.1038/nature07743. [DOI] [PMC free article] [PubMed] [Google Scholar]
- McDonald JH, Kreitman M. Adaptive protein evolution at the Adh locus in Drosophila. Nature. 1991;351:652–654. doi: 10.1038/351652a0. [DOI] [PubMed] [Google Scholar]
- Moran NA, McCutcheon JP, Nakabachi A. Genomics and evolution of heritable bacterial symbionts. Annu Rev Genet. 2008;42:165–190. doi: 10.1146/annurev.genet.41.110306.130119. [DOI] [PubMed] [Google Scholar]
- Nordborg M, Hu TT, Ishino Y, et al. 24 co-authors. The pattern of polymorphism in Arabidopsis thaliana. PLoS Biol. 2005;3 doi: 10.1371/journal.pbio.0030196. e196. [DOI] [PMC free article] [PubMed] [Google Scholar]
- Obbard DJ, Welch JJ, Kim KW, Jiggins FM. Quantifying adaptive evolution in the Drosophila immune system. PLoS Genet. 2009;5 doi: 10.1371/journal.pgen.1000698. e1000698. [DOI] [PMC free article] [PubMed] [Google Scholar]
- Olson MS, Robertson AL, Takebayashi N, Silim S, Schroeder WR, Tiffin P. Nucleotide diversity and linkage disequilibrium in balsam poplar (Populus balsamifera) New Phytologist. 2010;186:526–536. doi: 10.1111/j.1469-8137.2009.03174.x. [DOI] [PubMed] [Google Scholar]
- Paterson AH, Bowers JE, Bruggmann R, et al. 45 co-authors. The Sorghum bicolor genome and the diversification of grasses. Nature. 2009;457:551–556. doi: 10.1038/nature07723. [DOI] [PubMed] [Google Scholar]
- Piganeau G, Eyre-Walker A. Evidence for variation in the effective population size of animal mitochondrial DNA. PLoS One. 2009;4 doi: 10.1371/journal.pone.0004396. e4396. [DOI] [PMC free article] [PubMed] [Google Scholar]
- Popadin K, Polishchuk LV, Mamirova L, Knorre D, Gunbin K. Accumulation of slightly deleterious mutations in mitochondrial protein-coding genes of large versus small mammals. Proc Natl Acad Sci U S A. 2007;104:13390–13395. doi: 10.1073/pnas.0701256104. [DOI] [PMC free article] [PubMed] [Google Scholar]
- Rizzon C, Ponger L, Gaut BS. Striking similarities in the genomic distribution of tandemly arrayed genes in Arabidopsis and rice. PLoS Comput Biol. 2006 doi: 10.1371/journal.pcbi.0020115. 2:e115. [DOI] [PMC free article] [PubMed] [Google Scholar]
- Ross-Ibarra J, Tenaillon M, Gaut BS. Historical divergence and gene flow in the genus Zea. Genetics. 2009;181:1399–1413. doi: 10.1534/genetics.108.097238. [DOI] [PMC free article] [PubMed] [Google Scholar]
- Ross-Ibarra J, Wright SI, Foxe JP, Kawabe A, DeRose-Wilson L, Gos G, Charlesworth D, Gaut BS. Patterns of polymorphism and demographic history in natural populations of Arabidopsis lyrata. PLoS One. 2008;3 doi: 10.1371/journal.pone.0002411. e2411. [DOI] [PMC free article] [PubMed] [Google Scholar]
- Schmid KJ, Ramos-Onsins S, Ringys-Beckstein H, Weisshaar B, Mitchell-Olds T. A multilocus sequence survey in Arabidopsis thaliana reveals a genome-wide departure from a neutral model of DNA sequence polymorphism. Genetics. 2005;169:1601–1615. doi: 10.1534/genetics.104.033795. [DOI] [PMC free article] [PubMed] [Google Scholar]
- Slotte T, Foxe JP, Hazzouri KM, Wright SI. Genome-wide evidence for efficient positive and purifying selection in Capsella grandiflora, a plant species with a large effective population size. Mol Biol Evol. 2010 doi: 10.1093/molbev/msq062. Advance Access published March 1, 2010, doi:10.1093/molbev/msq062. [DOI] [PubMed] [Google Scholar]
- Smith NGC, Eyre-Walker A. Adaptive protein evolution in Drosophila. Nature. 2002;415:1022–1024. doi: 10.1038/4151022a. [DOI] [PubMed] [Google Scholar]
- Soltis PS, Soltis DE. The role of hybridization in plant speciation. Annu Rev Plant Biol. 2009;60:561–588. doi: 10.1146/annurev.arplant.043008.092039. [DOI] [PubMed] [Google Scholar]
- Song BH, Windsor AJ, Schmid KJ, Ramos-Onsins S, Schranz ME, Heidel AJ, Mitchell-Olds T. Multilocus patterns of nucleotide diversity, population structure and linkage disequilibrium in Boechera stricta, a wild relative of Arabidopsis. Genetics. 2009;181:1021–1033. doi: 10.1534/genetics.108.095364. [DOI] [PMC free article] [PubMed] [Google Scholar]
- Strasburg JL, Rieseberg LH. Molecular demographic history of the annual sunflowers Helianthus annuus and H. petiolaris—large effective population sizes and rates of long-term gene flow. Evolution. 2008;62:1936–1950. doi: 10.1111/j.1558-5646.2008.00415.x. [DOI] [PMC free article] [PubMed] [Google Scholar]
- Strasburg JL, Scotti-Saintagne C, Scotti I, Lai Z, Rieseberg LH. Genomic patterns of adaptive divergence between chromosomally differentiated sunflower species. Mol Biol Evol. 2009;26:1341–1355. doi: 10.1093/molbev/msp043. [DOI] [PMC free article] [PubMed] [Google Scholar]
- Swigonová Z, Lai J, Ma J, Ramakrishna W, Llaca V, Bennetzen JL, Messing J. Close split of sorghum and maize genome progenitors. Genome Res. 2004;14:1916–1923. doi: 10.1101/gr.2332504. [DOI] [PMC free article] [PubMed] [Google Scholar]
- Tajima F. Evolutionary relationship of DNA sequences in finite populations. Genetics. 1983;105:437–460. doi: 10.1093/genetics/105.2.437. [DOI] [PMC free article] [PubMed] [Google Scholar]
- Thompson JD, Higgins DG, Gibson TJ. CLUSTAL W: improving the sensitivity of progressive multiple sequence alignment through sequence weighting, position-specific gap penalties and weight matrix choice. Nucleic Acids Res. 1994;22:4673–4680. doi: 10.1093/nar/22.22.4673. [DOI] [PMC free article] [PubMed] [Google Scholar]
- Tuskan GA, Difazio S, Jansson S, et al. (110 co-authors. The genome of black cottonwood, Populus trichocarpa (Torr. & Gray) Science. 2006;313:1596–1604. doi: 10.1126/science.1128691. [DOI] [PubMed] [Google Scholar]
- Wagner W, Weller S, Sakai A. Monograph of Schiedea (Caryophyllaceae subfam. Alsinoideae. Syst Bot Monogr. 2005;72:1–169. [Google Scholar]
- Wallace LE, Weller SG, Wagner WL, Sakai AK, Nepokroeff M. Phylogeographic patterns and demographic history of Schiedea globosa (Caryophyllaceae) on the Hawaiian Islands. Am J Bot. 2009;96:958–967. doi: 10.3732/ajb.0800243. [DOI] [PubMed] [Google Scholar]
- Watterson GA. On the number of segregating sites in genetical models without recombination. Theor Popul Biol. 1975;7:256–276. doi: 10.1016/0040-5809(75)90020-9. [DOI] [PubMed] [Google Scholar]
- Welch JJ. Estimating the genomewide rate of adaptive protein evolution in. Drosophila. Genetics. 2006;173:821–837. doi: 10.1534/genetics.106.056911. [DOI] [PMC free article] [PubMed] [Google Scholar]
- Whitlock MC. Fixation probability and time in subdivided populations. Genetics. 2003;164:767–779. doi: 10.1093/genetics/164.2.767. [DOI] [PMC free article] [PubMed] [Google Scholar]
- Woolfit M, Bromham L. Increased rates of sequence evolution in endosymbiotic bacteria and fungi with small effective population sizes. Mol Biol Evol. 2003;20:1545–1555. doi: 10.1093/molbev/msg167. [DOI] [PubMed] [Google Scholar]
- Woolfit M, Bromham L. Population size and molecular evolution on islands. Proc Biol Sci. 2005;272:2277–2282. doi: 10.1098/rspb.2005.3217. [DOI] [PMC free article] [PubMed] [Google Scholar]
- Wright SI, Bi IV, Schroeder SG, Yamasaki M, Doebley JF, McMullen MD, Gaut BS. The effects of artificial selection on the maize genome. Science. 2005;308:1310–1314. doi: 10.1126/science.1107891. [DOI] [PubMed] [Google Scholar]
- Yang Z. PAML: a program package for phylogenetic analysis by maximum likelihood. Comput Appl Biosci. 1997;13:555–556. doi: 10.1093/bioinformatics/13.5.555. [DOI] [PubMed] [Google Scholar]
- Zhang L, Li WH. Human SNPs reveal no evidence of frequent positive selection. Mol Biol Evol. 2005;22:2504–2507. doi: 10.1093/molbev/msi240. [DOI] [PubMed] [Google Scholar]
Associated Data
This section collects any data citations, data availability statements, or supplementary materials included in this article.