Abstract
Failure of the functional pancreatic β-cell mass to expand in response to increased metabolic demand is a hallmark of type 2 diabetes. Lineage tracing studies indicate that replication of existing β-cells is important for β-cell proliferation in adult animals. In rat pancreatic β-cell lines (RIN5F), treatment with 100 nm thyroid hormone (triiodothyronine, T3) enhances cell proliferation. This result suggests that T3 is required for β-cell proliferation or replication. To identify the role of thyroid hormone receptor α (TRα) in the processes of β-cell growth and cell cycle regulation, we constructed a recombinant adenovirus vector, AdTRα. Infection with AdTRα to RIN5F cells increased the expression of cyclin D1 mRNA and protein. Overexpression of the cyclin D1 protein in AdTRα-infected cells led to activation of the cyclin D1/cyclin-dependent kinase/retinoblastoma protein/E2F pathway, along with cell cycle progression and cell proliferation following treatment with 100 nm T3. Conversely, lowering cellular cyclin D1 by small interfering RNA knockdown in AdTRα-infected cells led to down-regulation of the cyclin D1/CDK/Rb/E2F pathway and inhibited cell proliferation. Furthermore, in immunodeficient mice with streptozotocin-induced diabetes, intrapancreatic injection of AdTRα led to the restoration of islet function and to an increase in the β-cell mass. These results support the hypothesis that liganded TRα plays a critical role in β-cell replication and in expansion of the β-cell mass during postnatal development. Thus, liganded TRα may be a target for therapeutic strategies that can induce the expansion and regeneration of β-cells.
Keywords: Cell Cycle, Cyclins, Diabetes, Gene Expression, Nuclear Receptors, Pancreatic Islet, Thyroid
Introduction
The pancreatic β-cell mass plays an essential role in determining the amount of insulin that is secreted to maintain blood glucose levels within a narrow range. Elucidation of the mechanisms that control the size of the β-cell mass is essential to allow development of regenerative therapy for both type 1 and type 2 diabetes, which are diseases characterized by an insufficient β-cell mass (1). Several mechanisms have been proposed to explain the process of adult β-cell mass expansion, including neogenesis from pancreatic duct cells or hematopoietic tissues, replication of highly active β-cell progenitors within the islets, and simple β-cell proliferation. The size of the β-cell mass is governed by the balance between the growth (differentiation and replication) and death (apoptosis) of these cells, but the mechanisms that sense the β-cell mass and maintain its homeostasis are largely unknown (2). Several recent reports have indicated that proliferation or replication of existing β-cells rather than differentiation of new β-cells from stem cells, is one mechanism involved in maintenance of the β-cell mass in adults (3, 4).
To clarify the mechanisms involved in the replication of β-cells, we focused on molecular regulation of the cell cycle in mature pancreatic β-cells. Terminally differentiated cells often make the decision to replicate at the interface of the G0/G1 phase of the cell cycle (5). Mitotic stimulation can induce entry into the cell cycle during the G1 phase through the assembly of cyclin D by cyclin-dependent kinase (CDK)2 4/6. The activated cyclin D-CDK 4/6 complex then phosphorylates retinoblastoma protein (pRb). This initial phosphorylation of pRb is followed by additional phosphorylation mediated by the cyclin E-CDK 2 complex. Once pRb has been phosphorylated, it releases the tethered transcription factor E2F and irreversibly commits the cell to progression through the cell cycle. It has been reported that complexes of CDK 4 with cyclin D1 or D2 are critical regulators of β-cell proliferation and β-cell mass homeostasis after birth (6). Although cyclin D plays a key role in regulating the transition of β-cells from a quiescent to a proliferative state, cyclin D alone is unlikely to be sufficient for committing cells to division.
Thyroid hormone nuclear receptors (TRs) belong to the superfamily of ligand-inducible transcription factors (7). Two TR genes located on two different chromosomes encode four isoforms that bind triiodothyronine (T3) and these isoforms are designated as α1, β1, β2, and β3. TRs bind to specific DNA sequences (thyroid hormone response elements) on promoters to regulate target gene transcription, and TR-mediated transcription is regulated at multiple levels. In addition to the role of T3 and the influence of the thyroid hormone response elements, TR transcription is modulated by tissue- and development-dependent TR isoform expression and by numerous co-repressors and co-activators. Thyroid hormone influences various physiological processes, including cell cycle progression and cell differentiation/development in the vertebrate nervous system. We previously reported that ligand binding to TR regulates the phosphatidylinositol 3-kinase/AKT pathway upstream of cyclin D1 (8, 9). It was also reported that ligand-binding TR regulates the transcription of cyclin D1 (10). Moreover, it was recently shown that TR interacts with cell cycle regulators such as cyclin D1 and p53 (11).
Pancreatic β-cells contain a range of nuclear receptors, many of which are implicated in the regulation of insulin secretion (12). Normally, there is a hyperbolic relationship between whole body insulin sensitivity and insulin secretion so that any change in insulin sensitivity elicits a reciprocal and proportional change in insulin secretion. However, the mechanisms by which ligand binding to TRs induce the proliferation of pancreatic β-cells are not clear, although it was recently reported that activation of the phosphatidylinositol 3-kinase pathway by liganded TR mediates pancreatic β-cell proliferation (13).
Insufficient understanding of the signals that regulate the growth and survival of adult β-cells remains one of the main challenges in diabetes research. However, new advances in identification of the factors involved in cell cycle progression by β-cells suggest that the molecular basis of this process may ultimately be revealed. In the present study, we investigated the influence of TRα on cell cycle progression by pancreatic β-cells. We explored the role of liganded TRα in β-cell replication and in expansion of the β-cell mass during postnatal development. The effects of TRα gene transfer into rat pancreatic cell lines or into the in vivo mouse pancreas were investigated using adenoviral vectors. Our findings led to the hypothesis that TRα might be involved in a positive regulatory mechanism that controls the maintenance of the pancreatic β-cell mass.
EXPERIMENTAL PROCEDURES
Construction of Recombinant Adenoviral Vectors
AdTRα is a recombinant adenoviral vector that expresses human TRα1 under the control of the cytomegalovirus immediate early promoter. The FLAG-TRα1 plasmid (14) was used as the template for cloning human TRα1 into pShuttle2 (Clontech, Mountain View, CA) using the polymerase chain reaction. The PCR primers were: FLAG-ApaI-5′ (AAGGGCCCGCCGCCATGGACTACAAAGACGATGACGAC), and TRα-3′ KpnI (TTAGGTACCTTAGACTTCCTGATCCTCAAAG) in which the underlines indicate restriction sites. All of the plasmid constructs were confirmed by DNA sequencing. An adenovirus vector was then constructed using the Adeno X Expressing System (Clontech) according to the manufacturer's protocol. AdLacZ, which contains the lacZ gene controlled by the cytomegalovirus promoter, was provided by Quantum Biotechnologies (Montréal, Canada) and was used as a control. A double-stranded short hairpin RNA, encoding sense and antisense siRNA sequences against mouse TRα (5′-CGCTCTTCCTGGAGGTCTT-3′) (15), separated by a loop sequence (TTCAAGAGA), was cloned into the pENTR/U6 vector. A recombinant adenovirus expressing this short hairpin RNA (AdshTRα) was generated using the pAd/BLOCK-iT-DEST vector kit (Invitrogen) according to the manufacturer's protocol. Recombinant adenoviruses were purified using a plaque-forming assay, were harvested 48 h after infection of 293 cells, and were further purified using double cesium chloride gradient ultracentrifugation (16). Viral titers were determined using a plaque-forming assay and cultured 293 cells, as described previously (17).
Cell Culture
RIN5F cells (ATCC CRL-2058) were grown in RPMI 1640 medium with 10% (v/v) fetal bovine serum (FBS) in a humidified incubator under a 5% CO2 atmosphere. Control siRNA (Stealth RNAi negative control, catalog number 12935), siRNA against cyclin D1 (Stealth RNAi mix; RSS329265, RSS329267, and RSS367610), or siRNA against TRα (Stealth RNAi mix; RSS330916 and RSS330917, RSS330918) were purchased from Invitrogen.
The number of cells treated with T3 was measured using a nonradioactive cell proliferation assay (Cell Counting Kit-8; Dojindo, Kumamoto, Japan). One day after plating, the cells were incubated with 10, 30, or 100 nm T3 in resin-stripped (T3-depleted) FBS (18). Cell viability was determined after 48 h of incubation by counting the cells according to the manufacturer's protocol.
Cells were synchronized in the G0/G1 phase by culture for 48 h in RPMI 1640 medium supplemented with 0.5% (v/v) FBS (19). The medium was then replaced with 10% (v/v) FBS-containing medium and the cells were then incubated with 30 multiplicities of infection (m.o.i.) of adenovirus for 12 h and 50 nm siRNA were transfected. After 24 h, cells were subsequently arrested in G0/G1. Arrest of the cells was confirmed by flow cytometry. For analysis, the cells were stained with 20 μg/ml of propidium iodide (Invitrogen) and analyzed with a BD Biosciences FACS Calibur (Franklin Lakes, NJ) using Cell Quest software version 3.0. The percentage of cells in the G1, S, or G2/M phase was calculated using ModFitLT version 3.1.
In the apoptosis studies, 30 m.o.i. of adenovirus-infected cells were incubated with or without T3 for 12 h, followed by transfection of 50 nm siRNA. After 24 h, the cells were plated on glass coverslips (Microscope coverglass, catalog number 12-545-84 18CIR-1D; Fisherbrand) at a density of 1 × 10⁵ cells per coverslip. After 24 h, the cells were exposed to streptozotocin (STZ) (Sigma) (15 mm) for 2 h in the presence or absence of T3. Terminal deoxynucleotidyl transferase-mediated dUTP nick end labeling (TUNEL) staining was performed using the DeadEnd Fluorometric TUNEL system (Promega, Madison, WI) according to the manufacturer's instructions.
Cell proliferation was also analyzed by a 5-bromo-2′-deoxyuridine (BrdUrd) uptake assay using a BrdUrd Labeling and Detection Kit (catalog number 11296736001; Roche Applied Science). Adenovirus-infected cells were incubated with or without T3 for 12 h followed by transfection of 50 nm siRNA. The cells were then passaged on glass coverslips at 1 × 10⁵ cells per coverslip. After 24 h, the cells were exposed to 10 μm BrdUrd labeling medium for 30 min. The cells were then washed twice with phosphate-buffered saline, fixed with 70% (v/v) ethanol, and incubated with anti-BrdUrd antibody (0.5 μg/ml) overnight at 4 °C. Cells that had incorporated BrdUrd were detected using fluorescein isothiocyanate-conjugated goat anti-mouse IgG (1 μg/ml). Nuclei were stained with DAPI (Vector Laboratories, Burlingame, CA) and laser scanning images were captured using an Olympus FV-1000 microscope (Olympus Corp., Tokyo, Japan).
Quantitative Real Time Reverse Transcriptase (RT)-PCR
RNA was extracted from tissues or cells using an RNeasy mini kit (Qiagen, Valencia, CA) according to the manufacturer's instructions. After quantification by spectrophotometry, 5 μg of total RNA was reverse transcribed to obtain cDNA using 160 μm deoxynucleotide triphosphate, 50 ng of random hexamer primers, and 200 units of SuperScript II according to the manufacturer's recommendations (Invitrogen). TaqMan probes for rat TRα (catalog number Rn00579692), rat TRβ (catalog number Rn00562044), rat cyclin D1 (catalog number Rn00432359), and 18 S rRNA (catalog number Hs99999901) were purchased from Applied Biosystems (Foster City, CA). Determination of mRNA levels by real time RT-PCR was carried out as described previously by Furuya et al. (20).
Western Blot Analysis and siRNA Knockdown
Adenovirus-infected (30 m.o.i.) RIN5F cells (1 × 10⁵ cells) were incubated with or without T3 for 12 h. Fifty nanomoles of control siRNA, or a mixture of three anti-cyclin D1, or three anti-TRα siRNAs, were then transfected into the cells using Lipofectamine 2000 (Invitrogen) according to the manufacturer's instructions. After 24 h, the cells were washed with phosphate-buffered saline (Ca2+ and Mg2+ free) and nuclear fractions were prepared using NE-PER nuclear and cytoplasmic extraction reagents according to the manufacturer's instructions (Pierce). Protein concentrations were determined by the method of Bradford (Pierce) using bovine serum albumin as the standard. For detection of cyclin D1, CDK4, CDK6, p21, and the Rb protein, the nuclear fractions of cell extracts (20 μg each) were separated by SDS-PAGE and the proteins were electrotransferred to a polyvinylidene difluoride membrane (Immobilon-P; Millipore Corporation) with Transblot buffer (Invitrogen). After blocking with 5% nonfat dry milk, the membranes were incubated with primary antibodies against cyclin D1 (1:1000) (Cell Signaling, number 2926), cyclin D2 (1:500) (Cell Signaling, number 2924), CDK4 (1:1000) (Santa Cruz, sc-260), CDK6 (1:1000) (Santa Cruz, sc-7180), p21 (1:100) (Santa Cruz, sc-6246), or Rb (1:100) (Santa Cruz, sc-50). After washing, the membranes were incubated with horseradish peroxidase-conjugated goat anti-mouse immunoglobulin G (IgG) or anti-rabbit IgG (1:2000 dilution: Amersham Biosciences) secondary antibodies, and the signal was subsequently detected using an ECL system (Amersham Biosciences). For control of protein loading, the blots were stripped and reacted with mouse monoclonal anti-γ2-tubulin antibodies (Santa Cruz, sc-134228).
Animal Experiments and Vector Injection
Immunodeficient, 4-week-old nude mice (BALB/cAJc1-nu/nu) were purchased from Clea Japan Inc. (Tokyo, Japan). Diabetes was induced using STZ (Sigma), which was injected intraperitoneally at a single dose of 200 mg/kg (21). Depletion of β-cells was confirmed by immunohistochemical staining of the pancreas, as well as by detection of severe hyperglycemia. At 7 days after STZ administration, mice that showed hyperglycemia were randomly divided into experimental groups that received 6 × 10¹⁰ plaque-forming units/mouse of AdTRα, AdshTRα, or control, AdLacZ groups I, II, and III, respectively. Mice were anesthetized by intraperitoneal injection of pentobarbitone (40 mg/kg). The pancreas was identified and mobilized at laparotomy. The recombinant adenoviral suspension (a total volume of 100 μl) was directly injected into 2–3 sites in the distal pancreas using a 27-gauge needle (21). The efficiency of viral infection was confirmed by immunostaining to determine maximal viral expression in pancreatic tissue. The abdomen was closed using 2 layers of 4-0 vicryl (Ethicon, Somerville, NJ). T3 (5 μg/20 g body weight) was injected intraperitoneally for 3 days (group I). Adenovirus administration was repeated in the mice in groups II or III, on day 21 or 35, respectively, following T3 treatment.
Cell proliferation in AdTRα-infected pancreas tissue was also analyzed using the BrdUrd Labeling and Detection Kit (Roche Applied Science). STZ-treated mice that showed hyperglycemia were injected with 6 × 10¹⁰ plaque-forming units/mouse of viral vector. Adenovirus-injected mice were then treated with T3 (5 μg/20 g body weight) for 3 days. Adenovirus administration was repeated on days 21 and 28 following T3 treatment. On day 35, mice were intravenously injected with a BrdUrd labeling reagent and BrdUrd incorporation was analyzed according to the manufacturer's protocol.
For histological studies of islet apoptosis, TUNEL staining was performed using the DeadEnd Fluorometric TUNEL system (Promega) according to the manufacturer's instruction. Adenovirus (6 × 10¹⁰ plaque-forming units) was injected 2 days before (200 mg/kg), and 3 days after STZ administration. The mice were sacrificed 5 days after STZ treatment. This pretreatment regimen was selected because it has been reported that pretreatment of mice with a glucagon-like peptide significantly reduces apoptosis in STZ-treated mice (22). The institutional biosafety committee of the University of Yamanashi approved the animal procedures and the use of recombinant DNA.
Measurement of Glucose and Insulin, and Glucose Tolerance Test
Serial blood glucose levels were monitored using a OneTouch Blood glucose meter (Johnson and Johnson, Milpitas, CA) after appropriate calibration. Blood was collected from the tail vein on day 0 (before injection of streptozotocin), on day 7 (before injection of the recombinant adenoviral vector), and during the intraperitoneal glucose tolerance test that was done according to the protocol of the animal models of diabetic complications consortium (niddk.nih.gov). On day 13 (day 6 after vector administration), mice were fasted overnight with free access to water. Glucose was injected intraperitoneally at a dose of 500 mg/kg of body weight in a volume of 1 ml. Blood glucose was measured before and 5, 15, 30, 60, and 120 min after glucose injection using an OneTouch Blood glucose meter (Johnson and Johnson, New Brunswick, NJ). Plasma insulin concentrations were measured by insulin enzyme-linked immunosorbent assay kit (Morinaga, Yokohama, Japan) using mouse insulin as a standard. Mice were exsanguinated by bleeding from the retro-orbital plexus at 0, 5, 15, 30, 60, and 120 min after glucose injection for the insulin assay.
Immunostaining
Organs were removed from mice, fixed in 10% buffered formalin, and subsequently embedded in paraffin. Then 3-μm sections were prepared and stained with hematoxylin and eosin, whereas other sections were processed for immunohistochemistry. Sections were permeabilized with 0.2% Triton X-100 in phosphate-buffered saline for 10 min at room temperature. Nonspecific binding of the antibodies was blocked with 3% bovine serum albumin before incubation overnight at 4 °C with primary antibody. Paraffin sections were stained for β-cells with guinea pig anti-insulin antibody (Dako, Glostrup, Denmark), for α-cells with anti-glucagon antibody (Dako), or for non-β-cells with a mixture of antisera (anti-glucagon, anti-somatostatin, and anti-pancreatic polypeptide). The sections were subsequently incubated with 1.0 μg/ml of rhodamine-conjugated goat anti-guinea pig IgG (Jackson ImmunoResearch, West Grove, PA) or fluorescein isothiocyanate-conjugated goat anti-mouse IgG. Nuclei were stained with DAPI (Vector Laboratories) and laser scanning images were captured using an Olympus FV-1000 microscope (Olympus Corp.).
The relative β-cell area was determined on insulin-stained sections and estimated by the following formula: β-cell mass (g) = the area of islets/the whole pancreatic area × pancreas weight (10 sections in each group). The area of insulin-stained pancreatic islets was measured using image analysis software (Image J). Using Image J, these β-cell areas were divided by the number of β-cell nuclei in the total area to calculate the mean area of the individual β-cells.
Statistics
Data are expressed as the mean ± S.D. Statistical analysis was performed using one-way analysis of variance or the unpaired 2-tailed Student's t test and probability values of less than 0.05 were considered to be significant.
RESULTS
T3 Enhances Pancreatic β-Cell Proliferation
To investigate the effect of T3 on pancreatic β-cell proliferation, we used a rat pancreatic β-cell line (RIN5F) that expresses endogenous nuclear TRs, TRα and TRβ, that mediate the actions of T3 (23). TRs function as ligand-dependent transcription factors to increase or decrease the expression of various target genes (24, 25). Recent reports indicate that liganded TRs have a critical role in the development of the central nervous system and skeletal muscles (26, 27). Our preliminary experiments indicated that T3 treatment significantly increased the number of RIN5F cells (data not shown).
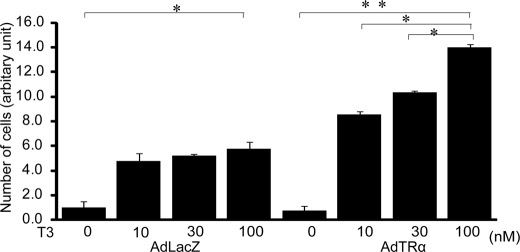
To further explore the role of TRα in the processes of β-cell proliferation, we determined the effect of overexpression of TRα using a recombinant adenovirus vector that expresses TRα (AdTRα). RIN5F cells were incubated in T3-depleted medium for 24 h and then infected with 30 m.o.i. of AdTRα or control AdLacZ. After 12 h of incubation in adenovirus-containing medium, the cells were cultured with or without T3 for a further 24 h. T3 treatment enhanced the cell number in AdLacZ-infected cells that express endogenous TRα (Fig. 1). The cell number of AdTRα-infected cells was significantly increased by treatment with 10, 30, or 100 nm T3, compared with the cell number of AdLacZ cells treated with 10, 30, or 100 nm T3, respectively (Fig. 1). These results supported the concept that T3 has a critical role in the growth or proliferation of β-cells and that infection with AdTRα enhances T3-induced cell proliferation.
FIGURE 1.
Effect of T3 on pancreatic β-cell proliferation. RIN5F cells were incubated in T3-depleted medium for 24 h and then infected with 30 m.o.i. of AdTRα or control AdLacZ. The cells were incubated in medium with 10, 30, or 100 nm T3 for an additional 48 h. Relative cell numbers were determined by arbitrarily setting the value for control cultures incubated in T3-free medium to 1. Data are expressed as the mean ± S.D. (n = 6). *, p < 0.05. **, p < 0.01.
Liganded TRα Specifically Induces Cell Cycle Progression of Pancreatic β-Cells via Induction of Cyclin D1 Expression
To explore the molecular mechanisms through which cell proliferation was induced by T3 treatment, we analyzed the effect of T3 on the expression of cyclin D1 mRNA, a cell cycle regulator. RIN5F cells were incubated in T3-depleted medium for 24 h and then infected with 30 m.o.i. of AdTRα or AdLacZ. After 12 h of incubation in adenovirus-containing medium, the cells were cultured with or without T3 (100 nm) for a further 24 h. Cyclin D1 mRNA expression was analyzed by quantitative RT-PCR and normalized to 18 S rRNA. As expected, treatment with T3 slightly enhanced the expression of cyclin D1 mRNA in AdLacZ-infected RIN5F cells (1.5-fold) because these cells constitutively express TRα (Fig. 2). However, in AdTRα-infected RIN5F cells, T3 treatment markedly enhanced cyclin D1 expression (5.6-fold).
FIGURE 2.
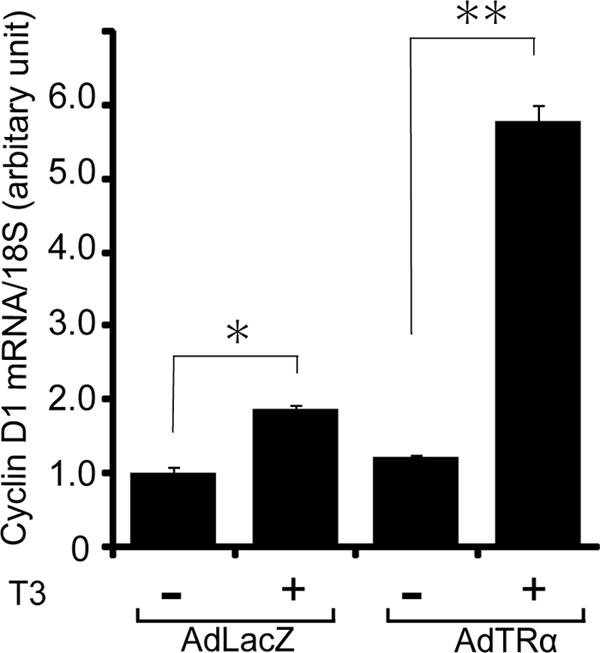
Effect of T3 on cyclin D1 mRNA expression. AdLacZ- or AdTRα-infected RIN5F cells were incubated with 100 nm T3 for 24 h. Total RNA was then isolated from four independent samples. The level of cyclin D1 mRNA was determined in triplicate measurements using quantitative real time RT-PCR and 100 ng of cDNA. Relative quantification of the target cDNA was done by arbitrarily setting the control value (AdLacZ-infected cells cultured without T3) to 1. Data are expressed as the mean ± S.D. *, p < 0.05. **, p < 0.01.
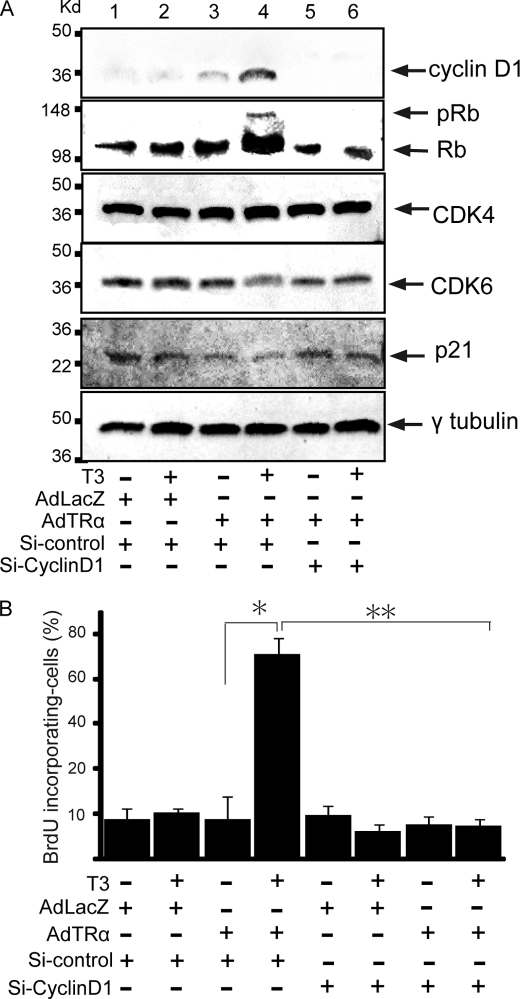
Enhanced expression of the cyclin D1 protein is known to be accompanied by concurrent activation of the CDK/Rb/E2F pathway and enhanced proliferation of pancreatic β-cells (6). To explore if the cyclin D1/CDK/Rb/E2F pathway was activated in AdTRα-infected β-cells, we analyzed the expression levels of CDK4, CDK6, Rb, and p21 proteins by Western blot analysis. The expression levels of cyclin D1 and Rb protein are enhanced in AdLacZ-infected RIN5F cells with T3 treatment, compared with no T3 treatment (Fig. 3A). T3 treatment of AdTRα-infected cells enhances cyclin D1 protein levels. p21 is a CDK inhibitor that binds to and inhibits the activity of cyclin-CDK complexes. The expression levels of CDK4, CDK6, or p21 proteins are not affected by the presence of liganded TRα. The abundance of the cyclin D2 protein is not affected by AdTRα infection (data not shown). Furthermore, hyperphosphorylated Rb protein is clearly detected in TRα-transfected RIN5F cells following T3 treatment (Fig. 3A). These results indicated that the cyclin D1/CDK/Rb/E2F pathway is activated in the pancreatic β-cell line in response to overexpression of liganded TRα. Endogenous TR is insufficient to induce obvious activation of the cyclin D1/CDK/Rb/E2F pathway.
FIGURE 3.
Activation of the cyclin D1/CDK/Rb pathway in AdTRα-infected RIN5F cells by T3 treatment. A, expression levels of the cyclin D1, Rb, CDK4, CDK6, and p21 proteins in AdLacZ- (lanes 1 and 2) or AdTRα (lanes 3–6)-infected RIN5F cells cotransfected with si-control (lanes 1–4) or si-cyclin D1 (lanes 5 and 6). The loading controls using γ2-tubulin are shown in the lower panel. Western blot analysis was carried out using 20 μg of nuclear protein. B, BrdUrd incorporation by AdLacZ- and AdTRα-infected cells. Cyclin D1 expression was knocked down in AdTRα-infected cells by si-cyclin D1. The ratio of cells with BrdUrd uptake to DAPI-stained cells is shown. Data are expressed as the mean ± S.D. (n = 6 to 10). *, p < 0.05; **, p < 0.01 compared with AdTRα-infected cells incubated with T3.
We next used a siRNA approach to ascertain the effect of knocking down cyclin D1 expression on the TRα-induced cyclin D1/CDK/Rb/E2F pathway. Knockdown of the cyclin D1 protein using specific siRNA was observed in AdTRα-infected cells with or without T3 treatment, as determined by Western blot analysis (Fig. 3A, lanes 5 and 6). Consistent with the reduced cyclin D1 protein, phosphorylation of its downstream effector, Rb, was decreased in AdTRα-infected RIN5F cells. The combined results suggested that enhancement of cyclin D1 by TRα, followed by activation of the Rb/E2F pathway, induces the proliferation of pancreatic β-cells.
DNA synthesis in AdTRα-infected cells was analyzed using a BrdUrd labeling. RIN5F cells were incubated with resin-stripped medium for 24 h and infected with 30 m.o.i. of adenovirus, followed by incubation with or without T3 (100 nm) for an additional 24 h. The ratio of BrdUrd incorporating nuclei to DAPI-stained nuclei is shown in Fig. 3B. When RIN5F cells were infected with AdTRα, BrdUrd accumulation was significantly increased (5.2-fold) in T3-treated cells compared with cells cultured in T3-depleted medium (p < 0.01) (Fig. 3B). This TRα-induced BrdUrd accumulation was not observed in cells in which cyclin D1 protein expression was inhibited by transfection with siRNA. These findings indicated that overexpression of liganded TRα induces cell cycle progression, DNA synthesis, and proliferation in pancreatic β-cells.
Liganded TRα Specifically Enhances Cell Proliferation of Pancreatic β-Cells
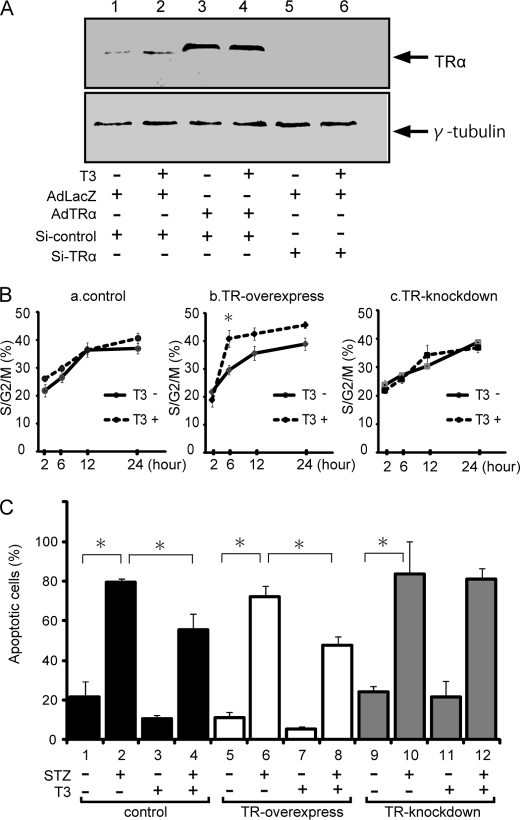
To confirm that the effect of TRα on cyclin D1 levels was reflected in an effect on cell cycle progression, we compared the effect of TRα overexpression with that of TRα knockdown on cell cycle progression. Western blot analysis of 30 m.o.i.-infected AdLacZ or AdTRα RINF cells, or TRα-specific siRNA-transfected cells are indicated as low, high, and inhibited expression of TRα protein, respectively (Fig. 4A). FACS analysis of cell cycle stages was then performed on these synchronized β-cells (Fig. 4B). Most of the AdLacZ-infected β-cells had proceeded to the S/G2 phase within 12 to 24 h after release from serum starvation. There were no significant differences between the presence and absence of T3 treatment. In AdTRα-transfected cells, T3 treatment accelerated an initial increment that progressed to the S/G2M phase compared with that in cells without T3 treatment (Fig. 4B). We employed the mixture of 3 vectors expressing different siRNAs against TRα to address whether endogenous TRα had a causal effect on cell cycle progression. Most of the siTRα-transfected cells had proceeded to the S/G2/M phase at 12 h after release from serum starvation. These results are consistent with previous results that the cyclin D1/CDK/Rb/E2F pathway is not activated in control adenovirus-infected cells (Fig. 3).
FIGURE 4.
Influence of liganded TRα on cell cycle progression and apoptosis. A, the levels of TRα protein expression in AdLacZ- (lanes 1, 2, 5, and 6) or AdTRα (lanes 3 and 4)-infected RIN5F cells cotransfected with si-control (lanes 1-4) or si-TRα (lanes 5 and 6). The loading controls using γ2-tubulin are shown in the lower panel. Western blot analysis was carried out using 20 μg of nuclear protein. B, the cells were synchronized in the G0/G1 phase by serum starvation. Synchronized cells were collected at time 0 and then released by culture in growth medium containing 10% fetal bovine serum with or without T3. Cells harvested at various times after release were subjected to FACS analysis to define the phase of the cell cycle. *, p < 0.05 compared with T3 depletion. C, induction of apoptosis in RIN5F cells by STZ treatment. After transfection with adenovirus and siRNA, the cells were incubated with 15 mm STZ for 2 h. Apoptosis was evaluated using the TUNEL method. The ratio of TUNEL-positive to DAPI-stained cells is shown. Data are expressed as the mean ± S.D. *, p < 0.05.
To assess whether liganded TRα could affect survival of β-cells exposed to a proapoptotic agent, apoptosis was induced using 15 mm STZ. As shown in Fig. 4C, the TUNEL assay, an indicator of apoptosis, was positive in 23% of control cells that were incubated with T3-depleted medium (lane 1) and STZ treatment enhanced apoptosis (3.3-fold) in these cells (lane 2). T3 treatment caused a 31% decrease in STZ-associated apoptosis (lanes 2 and 4). In AdTRα-infected cells, the TUNEL assay was positive in 11 or 6% of cells that were incubated in the absence or presence of T3, respectively (lanes 5 and 7). T3 treatment also reduced STZ-induced apoptosis (lanes 6 and 8). Lanes 9 and 10 show that, when endogenous TRα is knocked down, the T3-induced reduction in STZ-induced apoptosis in β-cells is not observed. These results indicated that liganded TRα could be considered a survival factor that protects β-cells from apoptosis.
Adenoviral Vector-mediated TRα Gene Transfer into the Mouse Pancreas Corrects Streptozotocin-induced Hyperglycemia and Insulin Secretion
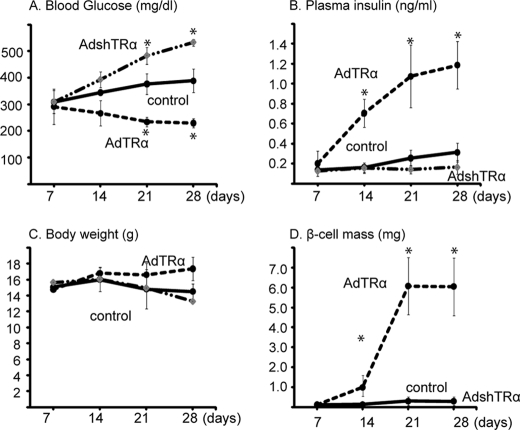
To analyze the effect of AdTRα on the replication of mature pancreatic β-cells in vivo, immunodeficient mice were made diabetic by injection of STZ. Hyperglycemic mice were injected with adenovirus (AdTRα or AdLacZ) into the distal pancreas on days 7, 14, or 21 after STZ injection, and then injected with T3 intraperitoneally every day for 3 days (5 μg/day). To further explore the role of endogenous TRα, the expression of TRα was inhibited by infection with an adenovirus expressing double-stranded short hairpin RNA against mouse TRα (AdshTRα). Mice treated with control adenovirus demonstrated hyperglycemia. In contrast, mice infected with AdTRα exhibited significantly lower blood glucose levels at 14, 21, and 28 days after STZ injection (Fig. 5A). AdshTRα-infected mice developed progressive hyperglycemia, with levels of blood glucose rising steadily several days after STZ administration. Levels of plasma insulin after day 7 were significantly higher in AdTRα-treated mice compared with those in control mice (Fig. 5B). Plasma insulin levels at day 28 in endogenous TRα-expressing mice were significantly higher than those in AdshTRα-infected mice. Body weight values were similar in each group. The improved glycemia values following AdTRα treatment were not due to decreased body weight secondary to an effect of TRα on appetite (Fig. 5C). To quantify the increase in β-cells, we analyzed the β-cell mass by immunostaining for insulin. AdTRα infection clearly enhanced β-cell mass on days 14, 21, and 28 (Fig. 5D). Following AdLacZ treatment, no obvious islet cell masses were observed 14 days after STZ administration and only small insulin-stained areas or scattered single or small clusters of insulin-positive cells were observed on days 21 and 28 (data not shown). An obvious β-cell mass was not observed in AdshTRα-infected mice. These data suggested that exogenous TRα in β-cells is coupled to the induction of β-cell proliferation and enhances the values of plasma insulin levels resulting in a reduction in blood glucose levels.
FIGURE 5.
Effects of TRα on β-cell mass replication in STZ-treated mice. Morning fed blood glucose levels, the levels of fed plasma insulin, and body weight over 28 days following STZ treatment of mice are shown in A–C, respectively. D, β-cell mass was calculated using the following formula: islet β-cell mass (mg) = the area stained by insulin antibody/the area of the whole pancreas × pancreas weight. All data are mean ± S.D. (n = 6–10). Bars represent the mean ± S.D. *, p < 0.05. compared with control.
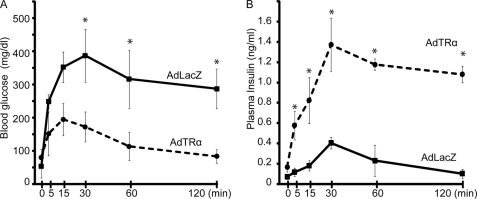
We compared the glucose tolerance of AdTRα- and AdLacZ-infected mice on day 14 (Fig. 6A). After an overnight fast, there were no differences in blood glucose levels between these two groups of mice. Similar findings were observed in young mice treated with STZ, as reported recently (28). At 15 min after glucose injection, the blood glucose level was maximal (200 mg/dl) in mice without STZ treatment, at which point the response to intraperitoneal injection of glucose solution at 500 mg/kg body weight was assessed. AdLacZ-treated control mice had significantly higher glucose levels after 15 min compared with AdTRα-injected mice (p < 0.05) (Fig. 6A). They showed peak glucose levels (407 mg/dl) after 30 min and a high glucose level (>300 mg/dl) still persisted after 60 min. In contrast, AdTRα-injected mice had the highest glucose value after 5 min and showed normal blood glucose levels from 15 min onward. Basal insulin levels in the AdTRα-treated mice were higher than those in control mice (2.3-fold). AdTRα-infected mice demonstrated rapid secretion of plasma insulin levels by 5 min, which peaked at 30 min and subsequently dropped. Control AdLacZ-infected mice did not exhibit a robust rise in levels of plasma insulin at 5 min or an increase in plasma insulin levels during the glucose tolerance test despite glycemic excursion. To evaluate the early phase of insulin secretion, we calculated the insulinogenic index between 0 and 30 min (Δ insulin (IRI)0–30min/Δ blood glucose (BG)0–30min), which represents early phase insulin response. The values of ΔIRI0–30min/ΔBG0–30min were significantly enhanced in AdTRα-treated mice compared with that in AdLacZ-treated mice (1.29 ± 0.26 versus 0.35 ± 0.06, p < 0.05). Insulin area under the blood concentration time curve was also enhanced in AdTRα-treated mice compared with controls (1.85 ± 0.46 versus 0.47 ± 0.17, p < 0.05). These data suggested that AdTRα treatment enhances insulin secretion in the pancreas of STZ-induced diabetic mice and improves glucose levels.
FIGURE 6.
Intraperitoneal glucose tolerance test in AdTRα- or AdLacZ-infected mice with STZ-induced diabetes. Each group of mice (n = 6) was injected with glucose and blood glucose levels (A) and plasma insulin levels (B) were measured after 0, 5, 15, 30, 60, and 120 min. Bars represent the mean ± S.D. *, p < 0.05.
Histological Assessment of Islet Proliferation in TRα-treated Mice
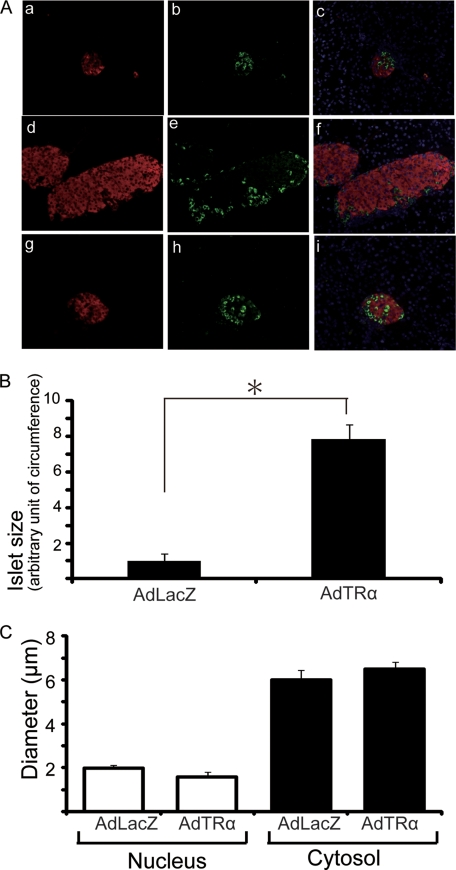
We assessed the histological consequences of AdTRα-induced replication of β-cells. Islet architecture in STZ-treated mice was severely disrupted 7 days after treatment, with non-β-cells located at the core of shriveled islets (Fig. 7A, a–c), whereas normally the islet core is occupied by β-cells. These observations are consistent with previous reports that STZ results in diabetes associated with β-cell destruction (29). The β-cell mass was clearly increased in AdTRα-treated pancreas compared with AdLacZ-treated control (Fig. 7A, d and g). There were no significant differences in the glucagon-stained area between AdTRα and AdLacZ treatments (Fig. 7A, e and h). As assessed by point counting morphometrics on immunostained paraffin sections, the size of islet was increased 7.6-fold in the AdTRα-treated pancreas compared with AdLacZ-treated control (Fig. 7B).
FIGURE 7.
Islet architecture in STZ-treated mice following AdTRα or AdLacZ infection. A, islet architecture 7 days after STZ treatment of non-infected control mice (a-c). Fourteen days following STZ treatment, AdTRα (d-f) or AdLacZ (g-i) mice were euthanized and the morphology of pancreatic islets was analyzed by immunohistochemistry. Insulin is stained red (a, d, and g) and glucagon is stained green (b, e, and h). Panels c, f, and i show the overlay of DAPI, insulin, and glucagon signals. B, the mean sizes ± S.D. of 30 islets in AdLacZ- and AdTRα-infected mice are shown. Relative quantification of islet size of circumference was determined by arbitrarily setting the control value from AdLacZ treatment to 1. All data are expressed as the mean ± S.D. *, p < 0.05. C, the mean diameters ± S.D. of β-cells or nuclei in 30 islets from AdLacZ- and AdTRα-infected mice are shown. There are no differences between AdLacZ- and AdTRα-infected mice.
Because increases in β-cell mass can result from either larger cells (hypertrophy) or more cells (replication), we measured the area of the individual β-cells. The mean size of individual β-cells of AdTRα-treated mice did not differ from those of the control (Fig. 7C). Because the increase in β-cell mass after AdTRα treatment was not due to increased cell size, the increased β-cell mass must result from replication.
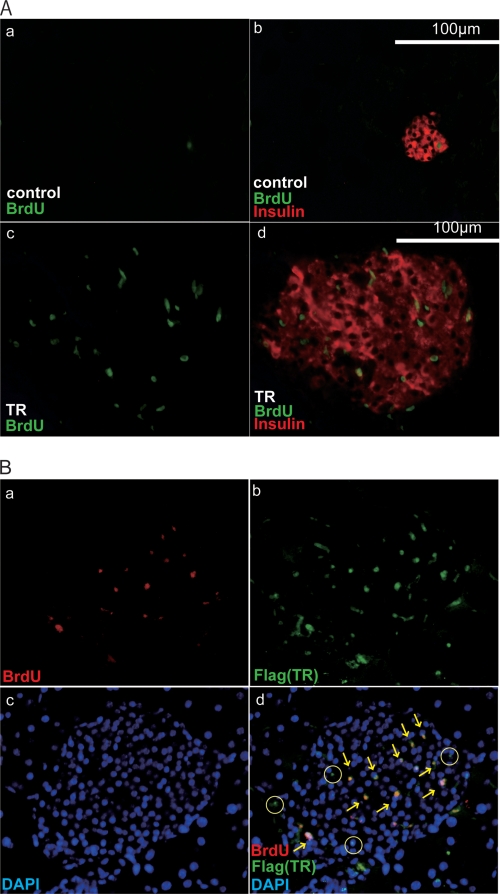
To further assess the process of AdTRα-induced replication of pancreatic β-cells, we measured the uptake of BrdUrd into mouse islets. Islets treated with AdTRα showed a striking increase in BrdUrd incorporation (Fig. 8Ac) such that nearly all sections from islets overexpressing TRα had multiple BrdUrd-positive cells. In contrast, sections from AdLacZ-treated control islets had few BrdUrd-positive cells (Fig. 8A, a). The enhanced number of BrdUrd-positive cells in AdTRα-treated islets correlated well with the results of the glucose tolerance test shown in Fig. 7 and clearly demonstrate a robust increase in the number of islet cells undergoing cell division in response to TRα overexpression (Fig. 8A, d).
FIGURE 8.
TRα stimulates islet β-cell replication in STZ-treated mice. A, histochemical staining of islet sections of the pancreas in AdLacZ-infected (a and b) or AdTRα-infected (c and d) mice. Islet sections were stained with antibodies that detect BrdUrd incorporation (a and c) or BrdUrd (green nuclear staining) and insulin (red cytosolic staining) (b and d). B, immunofluorescence analysis of BrdUrd incorporation in AdTRα-treated islets. BrdUrd (a) and TRα (b) were stained with anti-FLAG (M2) (green staining) and anti-BrdUrd (red staining) antibodies and visualized with labeled secondary antibodies. Panel c shows nuclear staining with DAPI. Panel d shows the overlay of all three signals. The yellow arrows identify the BrdUrd-labeled nuclei, which in all cases co-stain with TRα and DAPI. TRα-positive and BrdUrd-negative nuclei are marked as circles.
Co-staining studies were carried out to further investigate the relationship between BrdUrd accumulation and TR expression. Treatment of islets with AdTRα caused the appearance of an obvious nuclear TRα (FLAG) signal determined by co-staining with an anti-FLAG antibody and DAPI. The infection efficiency was 54.8 ± 3.1%. Importantly, overlay of BrdUrd and TRα nuclear staining (Fig. 8B) revealed that all BrdUrd-positive cells were also TRα positive. Conversely, a small proportion of TRα-positive cells was BrdUrd negative (Fig. 8B). A likely explanation for this observation is that BrdUrd was only added during the last 18 h of the 98-h period following exposure of the islets to AdTRα. Therefore, some TRα-overexpressing cells may have completed the S phase prior to the addition of BrdUrd.
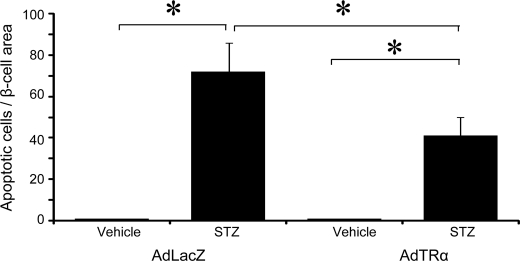
These results supported the hypothesis that AdTRα could lead to the formation of new β-cells through enhanced proliferation of pre-existing β-cells in the STZ-treated pancreas. Because STZ is known to induce β-cell destruction in part through activation of apoptotic pathways, we analyzed the possibility that TRα might also enhance β-cell mass via protection from cellular apoptosis. To test this hypothesis, mice were treated with STZ in the presence or absence of AdTRα that was administrated for 2 days before, and 3 days after, STZ treatment. Apoptosis of β-cells in the pancreas was studied using the TUNEL method. Only a rare apoptotic β-cell was detectable in histological sections from the pancreas of AdLacZ- or AdTRα-treated mice in the absence of STZ. The number of TUNEL-positive apoptotic β-cells was markedly increased in STZ-treated mice, and was significantly reduced in mice administrated AdTRα (Fig. 9). The combined data indicate that treatment of islets with AdTRα preferentially stimulates β-cell proliferation and also facilitates reduced apoptosis in STZ-treated mice.
FIGURE 9.
Islet apoptosis in AdTRα-infected mice following vehicle or STZ administration. STZ was administered to AdLacZ and AdTRα pre-infected mice, after which mice were euthanized 5 days later for histological assessment of islet apoptosis using a TUNEL assay. The number of apoptotic cells normalized to the relative islet area is shown. Approximately 30 islets were assessed, in which a minimum of 10 slides were analyzed per mouse. All data are expressed as mean ± S.D. *, p < 0.05.
DISCUSSION
Pancreatic islet β-cell mass is controlled by a dynamic balance between cell proliferation and cell death. Diabetes occurs when this balance is disrupted by autoimmune-mediated β-cell destruction or by failure of the β-cell mass to compensate for metabolic demand. Gaining a better understanding of molecular mechanisms that regulate β-cell replication and survival is therefore of great relevance for development of new diabetic therapies. In this report, we demonstrated that: 1) thyroid hormone treatment enhances the numbers of pancreatic β-cells; 2) adenovirus-mediated transfer of the TRα gene enhances cell cycle progression and proliferation of a pancreatic β-cell line; 3) TRα gene transfer also enhances cyclin D1 expression and activates the cyclin D1/CDK/Rb pathway; 4) in vivo TRα gene transfer induces restoration of insulin secretion and improvement of glucose tolerance associated with an increase of the β-cell mass in diabetic mice; and 5) TRα gene transfer confers strong protection against STZ-mediated β-cell apoptosis. These data provide new insights into the molecular mechanisms regulating pancreatic β-cell proliferation induced by liganded TRα.
Thyroid hormones reduce glucose tolerance in humans and other animals (30). Experimental hyperthyroidism induced by thyroid hormone treatment leads to a reduction in glucose-induced insulin secretion from the isolated pancreas (31), and this is not due to impairment of the insulin-secreting capacity of individual β-cells (32). It was also reported that stimulated insulin secretion is significantly increased in patients with hyperthyroidism, possibly reflecting increased β-cell sensitivity to glucose (33). Additionally, recent reports indicate that the thyroid hormone receptor mediates up-regulation of protein synthesis and cell size, along with cell proliferation and survival (34). In the present study, we also demonstrated that thyroid hormone treatment induced the proliferation of rat pancreatic β-cell lines. These results support the concept that thyroid hormone has a role in the proliferation of pancreatic β-cells.
Little is known about the molecular mechanisms involved in thyroid hormone-induced proliferation of pancreatic β-cells. A gene silencing study revealed nongenomic activation of the phosphatidylinositol 3-kinase/AKT pathway by endogenous TRβ in human pancreatic insulinoma cells (34). Our data suggested that liganded TRα also has an important role in the proliferation of pancreatic β-cells. Our in vitro studies also show that transfected TRα activates the cyclin D1/CDK/Rb pathway and cell cycle progression in a ligand-dependent manner (Fig. 3). Endogenous TR is insufficient for induction of expression of the cyclin D1 protein that activates the cyclin D1/CDK/Rb pathway. Previous reports have indicated that thyroid hormone enhances pancreatic acinar cell proliferation (35) and β-cell proliferation (36) in vitro. These results were compatible with our in vivo findings that overexpression of TRα1 enhances β-cell proliferation in STZ-treated mice. There were no demonstrable abnormalities or changes of pancreatic exocrine cells with or without AdTRα treatment. TRα expression was not only observed in the islets, but also in other areas of the pancreas by staining with an anti-FLAG antibody (Fig. 8) and its expression was still detected up to 15 days after adenovirus injection (data not shown). In contrast, activation of pancreatic β-cells was not observed in the control adenovirus-infected pancreas (Fig. 8).
Previous findings have also suggested that modulation of the cyclin D-cdk4 complex has a major influence on cell cycle progression, proliferation, and survival of pancreatic β-cells (6). After birth, cyclin D1 or cyclin D2-cdk4 are critical regulators of β-cell proliferation and viability (37, 38). Indeed, adenovirus-mediated transfer of cyclin D1 was reported to induce β-cell proliferation and replication (39). These results indicate that cyclin D1, which is the major regulator of the gap-1/synthesis phase (G1/S) cell cycle checkpoint, has an important role in the cell cycle control of β-cells. Thyroid hormone may induce either growth stimulation or inhibition, depending on the tissue involved and the treatment regimen (40). Thyroid hormone has been reported to modulate the expression of several genes that have a key role in cell cycle regulation via stimulation of the cyclin family (11). In this study, we showed that the expression of cyclin D1 was stimulated by liganded TRα, suggesting that T3 transcriptional activity is one of the mechanisms by which cyclin D1 protein levels are increased. The overexpression of cyclin D1 protein was accompanied by hyperphosphorylated Rb. Phosphorylation of Rb is known to release the E2F transcription factor from Rb-E2F complexes to promote progression of the cell cycle from the G1 to the S phase (Fig. 4).
Improved understanding of the signals regulating the growth and survival of adult β-cells remains one of the main challenges in diabetes research. Unfortunately, the molecular mechanisms regulating the pancreatic β-cell mass are poorly understood. Recent work on adult stem cells has highlighted their potential contribution to organ maintenance and repair (41). In contrast, Dor et al. (3) reported that pre-existing β-cells, rather than pluripotent stem cells, are the major source of new β-cells during adult life and after pancreatectomy in mice. Similarly, a study employing a novel DNA analog-based lineage-tracing technique that detects sequential cell division indicated that pancreatic β-cells are mainly produced by self-duplication (42). Our studies are the first to show that liganded TRα mediates β-cell proliferation via the regulation of cell cycle factors. We have further shown that these mechanisms actually exist and are operative in adult β-cells. The increased β-cell mass was accompanied by a corresponding increase in the number of BrdUrd-positive cells, suggesting that overexpression of TRα resulted in an increase in the capacity of β-cell precursors to proliferate or differentiate into insulin-expressing cells. The present study will explain these prior results by demonstrating that TRα can simultaneously enhance β-cell replication and function. Anti-apoptotic function of TRα-mediated pathway was also suggested.
A better understanding of how the cell cycle progression of the β-cell is regulated could lead to new strategies for the therapy of diabetes. The TRα gene appears to have growth-promoting properties that also contribute to maintenance of the mature β-cell phenotype. These properties are an ideal combination for enhancement of β-cell function and mass in the context of major forms of diabetes. Future goals include the development of vectors with less immunogenicity for prolonged transgene expression and for tightly regulated insulin secretion.
Footnotes
- CDK
- cyclin-dependent kinase
- pRb
- retinoblastoma protein
- m.o.i.
- multiplicities of infection
- STZ
- streptozotocin
- BrdUrd
- 5-bromo-2′-deoxyuridine
- RT
- reverse transcriptase
- FACS
- fluorescence-activated cell sorter
- TR
- thyroid hormone receptor
- T3
- triiodothyronine
- siRNA
- small interfering RNA
- FBS
- fetal bovine serum
- Adsh
- adenovirus short hairpin
- DAPI
- 4′,6-diamidino-2-phenylindole
- TUNEL
- terminal deoxynucleotidyl transferase-mediated dUTP nick end labeling.
REFERENCES
- 1.Rood P. P., Bottino R., Balamurugan A. N., Fan Y., Cooper D. K., Trucco M. (2006) Pharm. Res. 23, 227–242 [DOI] [PubMed] [Google Scholar]
- 2.Heit J. J., Karnik S. K., Kim S. K. (2006) Annu. Rev. Cell Dev. Biol. 22, 311–338 [DOI] [PubMed] [Google Scholar]
- 3.Dor Y., Brown J., Martinez O. I., Melton D. A. (2004) Nature 429, 41–46 [DOI] [PubMed] [Google Scholar]
- 4.Nir T., Melton D. A., Dor Y. (2007) J. Clin. Invest. 117, 2553–2561 [DOI] [PMC free article] [PubMed] [Google Scholar]
- 5.Yu Q., Wu J. (2008) Mol. Cell. Biochem. 315, 17–24 [DOI] [PubMed] [Google Scholar]
- 6.Cozar-Castellano I., Fiaschi-Taesch N., Bigatel T. A., Takane K. K., Garcia-Ocaña A., Vasavada R., Stewart A. F. (2006) Endocr. Rev. 27, 356–370 [DOI] [PubMed] [Google Scholar]
- 7.Cheng S. Y. (2000) Rev. Endocr. Metab. Disord. 1, 9–18 [DOI] [PubMed] [Google Scholar]
- 8.Hiroi Y., Kim H. H., Ying H., Furuya F., Huang Z., Simoncini T., Noma K., Ueki K., Nguyen N. H., Scanlan T. S., Moskowitz M. A., Cheng S. Y., Liao J. K. (2006) Proc. Natl. Acad. Sci. U.S.A. 103, 14104–14109 [DOI] [PMC free article] [PubMed] [Google Scholar]
- 9.Furuya F., Hanover J. A., Cheng S. Y. (2006) Proc. Natl. Acad. Sci. U.S.A. 103, 1780–1785 [DOI] [PMC free article] [PubMed] [Google Scholar]
- 10.Furumoto H., Ying H., Chandramouli G. V., Zhao L., Walker R. L., Meltzer P. S., Willingham M. C., Cheng S. Y. (2005) Mol. Cell. Biol. 25, 124–135 [DOI] [PMC free article] [PubMed] [Google Scholar]
- 11.Barrera-Hernandez G., Park K. S., Dace A., Zhan Q., Cheng S. Y. (1999) Endocrinology 140, 5267–5274 [DOI] [PubMed] [Google Scholar]
- 12.Sugden M. C., Holness M. J. (2008) Biochem. Soc. Trans. 36, 891–900 [DOI] [PubMed] [Google Scholar]
- 13.Verga Falzacappa C., Petrucci E., Patriarca V., Michienzi S., Stigliano A., Brunetti E., Toscano V., Misiti S. (2007) J. Mol. Endocrinol. 38, 221–233 [DOI] [PubMed] [Google Scholar]
- 14.Ying H., Araki O., Furuya F., Kato Y., Cheng S. Y. (2007) Mol. Cell. Biol. 27, 2359–2371 [DOI] [PMC free article] [PubMed] [Google Scholar]
- 15.Hassani Z., François J. C., Alfama G., Dubois G. M., Paris M., Giovannangeli C., Demeneix B. A. (2007) Nucleic Acids Res. 35, e65. [DOI] [PMC free article] [PubMed] [Google Scholar]
- 16.Graham F. L., van der Eb A. J. (1973) Virology 52, 456–467 [DOI] [PubMed] [Google Scholar]
- 17.Shimura H., Suzuki H., Miyazaki A., Furuya F., Ohta K., Haraguchi K., Endo T., Onaya T. (2001) Cancer Res. 61, 3640–3646 [PubMed] [Google Scholar]
- 18.Samuels H. H., Stanley F., Casanova J. (1979) Endocrinology 105, 80–85 [DOI] [PubMed] [Google Scholar]
- 19.Choudhury A. D., Xu H., Baer R. (2004) J. Biol. Chem. 279, 33909–33918 [DOI] [PubMed] [Google Scholar]
- 20.Furuya F., Shimura H., Suzuki H., Taki K., Ohta K., Haraguchi K., Onaya T., Endo T., Kobayashi T. (2004) Endocrinology 145, 2865–2875 [DOI] [PubMed] [Google Scholar]
- 21.Shifrin A. L., Auricchio A., Yu Q. C., Wilson J., Raper S. E. (2001) Gene Ther. 8, 1480–1489 [DOI] [PubMed] [Google Scholar]
- 22.Li Y., Hansotia T., Yusta B., Ris F., Halban P. A., Drucker D. J. (2003) J. Biol. Chem. 278, 471–478 [DOI] [PubMed] [Google Scholar]
- 23.Verga Falzacappa C., Panacchia L., Bucci B., Stigliano A., Cavallo M. G., Brunetti E., Toscano V., Misiti S. (2006) J. Cell. Physiol. 206, 309–321 [DOI] [PubMed] [Google Scholar]
- 24.Lazar M. A. (1993) Endocr. Rev. 14, 184–193 [DOI] [PubMed] [Google Scholar]
- 25.Chin W. W. (1994) Thyroid 4, 389–393 [DOI] [PubMed] [Google Scholar]
- 26.Hashimoto K., Curty F. H., Borges P. P., Lee C. E., Abel E. D., Elmquist J. K., Cohen R. N., Wondisford F. E. (2001) Proc. Natl. Acad. Sci. U.S.A. 98, 3998–4003 [DOI] [PMC free article] [PubMed] [Google Scholar]
- 27.O'Shea P. J., Bassett J. H., Sriskantharajah S., Ying H., Cheng S. Y., Williams G. R. (2005) Mol. Endocrinol. 19, 3045–3059 [DOI] [PubMed] [Google Scholar]
- 28.Fazio E. N., Pin C. L. (2007) Biochem. Biophys. Res. Commun. 353, 823–828 [DOI] [PubMed] [Google Scholar]
- 29.Kodama S., Kühtreiber W., Fujimura S., Dale E. A., Faustman D. L. (2003) Science 302, 1223–1227 [DOI] [PubMed] [Google Scholar]
- 30.Lenzen S., Bailey C. J. (1984) Endocr. Rev. 5, 411–434 [DOI] [PubMed] [Google Scholar]
- 31.Lenzen S., Joost H. G., Hasselblatt A. (1976) Endocrinology 99, 125–129 [DOI] [PubMed] [Google Scholar]
- 32.Lenzen S., Klöppel G. (1978) Endocrinology 103, 1546–1555 [DOI] [PubMed] [Google Scholar]
- 33.O'Meara N. M., Blackman J. D., Sturis J., Polonsky K. S. (1993) J. Clin. Endocrinol. Metab. 76, 79–84 [DOI] [PubMed] [Google Scholar]
- 34.Verga Falzacappa C., Patriarca V., Bucci B., Mangialardo C., Michienzi S., Moriggi G., Stigliano A., Brunetti E., Toscano V., Misiti S. (2009) J. Cell. Biochem. (2009) 106, 835–848 [DOI] [PubMed] [Google Scholar]
- 35.Ledda-Columbano G. M., Perra A., Pibiri M., Molotzu F., Columbano A. (2005) J. Endocrinol. 185, 393–399 [DOI] [PubMed] [Google Scholar]
- 36.Ximenes H. M., Lortz S., Jörns A., Lenzen S. (2007) Life Sci. 80, 2045–2050 [DOI] [PubMed] [Google Scholar]
- 37.Malumbres M., Sotillo R., Santamaría D., Galán J., Cerezo A., Ortega S., Dubus P., Barbacid M. (2004) Cell 118, 493–504 [DOI] [PubMed] [Google Scholar]
- 38.Kushner J. A., Ciemerych M. A., Sicinska E., Wartschow L. M., Teta M., Long S. Y., Sicinski P., White M. F. (2005) Mol. Cell. Biol. 25, 3752–3762 [DOI] [PMC free article] [PubMed] [Google Scholar]
- 39.Cozar-Castellano I., Takane K. K., Bottino R., Balamurugan A. N., Stewart A. F. (2004) Diabetes 53, 149–159 [DOI] [PubMed] [Google Scholar]
- 40.Yen P. M. (2001) Physiol. Rev. 81, 1097–1142 [DOI] [PubMed] [Google Scholar]
- 41.Hess D., Li L., Martin M., Sakano S., Hill D., Strutt B., Thyssen S., Gray D. A., Bhatia M. (2003) Nat. Biotechnol. 21, 763–770 [DOI] [PubMed] [Google Scholar]
- 42.Teta M., Rankin M. M., Long S. Y., Stein G. M., Kushner J. A. (2007) Dev. Cell 12, 817–826 [DOI] [PubMed] [Google Scholar]


