Abstract
FaO rat hepatoma cells proliferate in the absence of serum through a mechanism that requires activation of the epidermal growth factor receptor (EGFR) pathway. The aim of this work was to analyze the molecular mechanisms that control EGFR activation in these and other liver tumor cells. Reactive oxygen species production is observed a short time after serum withdrawal in FaO cells, coincident with up-regulation of the NADPH oxidase NOX1. NOX1-targeted knockdown, the use of antioxidants, or pharmacological inhibition of NADPH oxidase attenuates autocrine growth, coincident with lower mRNA levels of EGFR and its ligand transforming growth factor-α (TGF-α) and a decrease in phosphorylation of EGFR. EGFR-targeted knockdown induces similar effects on cell growth and downstream signals to those observed in NOX1-depleted cells. Early NOX1 activation induces both a feedback-positive loop via an Src-ERK pathway that up-regulates its own levels, and a parallel signaling pathway through p38 MAPK and AKT resulting in EGFR and TGF-α up-regulation. Human hepatocellular carcinoma cell lines, but not non-tumoral hepatocytes, show autocrine growth upon serum withdrawal, which is also coincident with NOX1 up-regulation that mediates EGFR and TGF-α expression. The use of antioxidants, or pharmacological inhibition of NADPH oxidase, effectively attenuates autocrine growth in hepatocellular carcinoma cell lines. In summary, results presented in this study indicate that NOX1 might control autocrine cell growth of liver tumor cells through regulation of the EGFR pathway.
Keywords: Hepatocyte, Liver, Reactive Oxygen Species (ROS), Transforming Growth Factor alpha (TGFalpha), Tumor, EGFR, NADPH Oxidase, NOX1, Autocrine Growth
Introduction
Hepatocellular carcinoma (HCC)2 is one of the most common cancers worldwide (1). Several molecular alterations have been associated with the pathogenesis of this liver cancer (2), but it is generally accepted that in all cases a deregulation in the balance between proliferation and cell death is observed (3), which is mainly caused by overactivation of survival pathways, frequently related to acquisition of autocrine growth factor signaling (4).
The epidermal growth factor receptor (EGFR) is a member of the ErbB family of tyrosine kinase receptors, which is commonly hyperactivated in different epithelial tumors (5). There are six known ligands that bind and activate the receptor, including the EGF itself, the transforming growth factor (TGF)-α, and the heparin-binding EGF-like growth factor (6). Different mechanisms have been implicated in the deregulated activity of this pathway in cancer, such as receptor or ligand overexpression and loss of negative regulatory mechanisms, among others (6). In fact, one common molecular event described in the pathogenesis of hepatocellular carcinoma is the overexpression of the EGFR itself, or its ligands EGF and TGF-α (4). Many liver tumor cells, such as FaO rat hepatoma cells, express high levels of EGFR ligands as compared with normal adult hepatocytes (7). Indeed, these tumoral cells show basal growth in the absence of serum, mediated by cell release of extracellular EGFR ligands (8, 9).
The acceptance of the involvement of reactive oxygen species (ROS) on physiological processes in cells has grown because the NOX family of NADPH oxidases has been discovered for homology to gp91phox, the phagocytic oxidase. Nowadays, the NOX family includes seven different members as follows: NOX1–5, DUOX1, and DUOX2 (10). These enzymes are widely expressed in numerous tissues and play different roles, including cell signaling, gene expression regulation, cell death, differentiation, and growth (11). This variety of functions implies many different pathological situations involving NADPH oxidases in different organs, including the liver, where they have been related to fibrosis, cirrhosis, and cancer (12). The enzymatic activity of these NADPH oxidases is mainly controlled by regulatory subunits that form an active macromolecular complex (11). However, an exception is NOX4, whose activity has been described to be determined only by its mRNA/protein levels (13), and could not be pharmacologically inhibited by conventional NADPH oxidase complex inhibitors, such as apocynin.
We have recently described that different members of the NOX family might play opposite roles in the control of liver cell death. Thus, NOX4 would be involved in mediating apoptosis induced by a physiological stimulus, such as the transforming growth factor-β (TGF-β) (14, 15), or antineoplastic drugs, such as doxorubicin (9). However, other members of this family might be involved in protecting cells from pro-apoptotic stimuli. Indeed, anti-apoptotic signals induced by TGF-β in hepatocytes, which, interestingly, require transactivation of the EGFR pathway, are dependent on an apocynin-inhibited member of the NOX family (16). The isoenzyme involved might be NOX1, because targeting knockdown of its expression enhanced TGF-β-induced apoptotic response in FaO rat hepatoma cells (17). However, much less is known about the role of these NOX enzymes in liver cell proliferation neither in normal nor in tumor cells.
According to this, the aim of this work was to investigate whether some members of the NADPH oxidase family might play essential roles in regulating the autocrine growth and survival of liver tumor cells and whether this mechanism might be related to overactivation of the EGFR pathway. Results will show relevance in the design of new therapeutic molecular targets in liver cancer.
EXPERIMENTAL PROCEDURES
Cell Culture Conditions
FaO rat hepatoma cells, Hep3B and HepG2 human hepatocarcinoma cells, SK-HEP-1 human liver adenocarcinoma, PLC/PRF/5 human liver hepatoma, and WRL68 human embryonic liver cells were obtained from the European Collection of Cell Cultures, and non-tumoral THLE-3 and Chang liver cells (CHL) from the American Type Culture Collection. For cell culture, the following media were used: F-12 Coon's modified medium for FaO; minimal essential medium for Hep3B and HepG2; 1 mm pyruvate-supplemented minimal essential medium for SK-HEP-1; Dulbecco's modified Eagle's medium for PLC/PRF/5, WRL68, and CHL cells, and BEGM supplemented with BEGM Bullet kit for THLE-3. Cell lines were grown in medium supplemented with 10% fetal bovine serum and maintained in a humidified atmosphere of 37 °C, 5% CO2. For experiments, cells at 40% confluence were serum-deprived to test autocrine growth. When indicated, the following products were added 30 min before serum deprivation and maintained along the experiment: EGFR inhibitor AG1478 (20 μm), antioxidants butylated hydroxyanisole (200 μm) or glutathione-ethyl ester (GEE, 2 mm), PI3K inhibitor LY294002 (20 μm), Rac inhibitor NCS23766 (100 μm), MEK inhibitor PD98059 (50 μm), p38 MAPK inhibitor PD169316 (800 nm), Src kinase family inhibitor PP2 (10 μm), mammalian target of rapamycin pathway inhibitor (10 μm), c-Jun N-kinase inhibitor SP600125 (40 μm), NF-κB inhibitor peptide SN50 (50 μg/ml), or NADPH oxidase inhibitor apocynin (300 μm). All these reagents were from Calbiochem, except GEE and apocynin were from Sigma.
Analysis of Cell Number
Cell number was analyzed after crystal violet staining (0.2% in 2% ethanol), as described previously (18).
Proliferation Measurement by [3H]Thymidine Incorporation
Cells were treated during 48 h as indicated in the presence of 1 μCi/ml, 1 μm thymidine. At the end of the incubation period, radioactivity was measured in a scintillation counter 1209 Rackbeta (Wallac, Turku, Finland) diluting 100 μl of acid-precipitated material in 5 ml of scintillation liquid.
Measurement of Intracellular Redox State
The oxidation-sensitive fluorescent probes 2′,7′-dichlorodihydrofluorescein diacetate, dihydroethidium, and MitoSOXTM Red (all from Invitrogen) were used to analyze the total intracellular content of ROS, intracellular superoxide production, and mitochondrial superoxide production, respectively, as described previously (17). Fluorescence was measured in a Microplate Fluorescence Reader Fluostar Optima and expressed as percentage of control after correction with protein content.
Analysis of Gene Expression
RNeasy mini kit (Qiagen, Valencia, CA) was used for total RNA isolation. Reverse transcription (RT) was carried out using the High Capacity reverse transcriptase kit (Applied Biosystems, Foster City, CA), with 500 ng of total RNA from each sample for complementary DNA synthesis. Semiquantitative PCRs were performed using specific primers for rat and human samples: rat cyclin D1 (for, 5′-ATGTTCGTCCGGTCTAAGATG-3′, and rev, 5′-TGCGGATGATCTGCTTGTTC-3′); rat EGFR (for, 5′-AAACTCTTCGGGACGCCCAATC-3′, and rev, 5′-CTGGCGATGGATGGGATCTTTG-3′); heparin binding similar to EGF factor (for, 5′-CGGTGGTGCTGAAGCTCTTTC-3′, and rev, 5′-TGGTAACCAGGGAGGCAGTG-3′ for rat samples; for, 5′-GTCACTTTATCCTCCAAGCCACAAGC-3′, and rev, 5′-AGACAGACAGATGACAGCACCACAGC-3′ for human samples); TGF-α (for, 5′-TGGTGCAGGAAGAGAAGC-3′, and rev, 5′-TGACAGCAGTGGATCAGC-3′ for rat samples; for, 5′-GTTCGCTCTGGGTATTGTGTTGGC-3′, and rev, 5′-TTTCGGACCTGGCAGCAGTGTATC-3′ for human samples); and albumin (for, 5′-CTGCCGATCTGCCCTCAATAGC-3′, and rev, 5′-GTGCCCACTCTTCCCAGGTTTCT-3′ for rat samples; for, 5′-TGCTTGAATCTGCTGATGACAGGG-3′, and rev, 5′-TGTCTTGGCAAGTCTCAGCAGCAG-3′ for human samples). PCR products were obtained after 30–35 cycles of amplification at annealing temperatures of 57–62 °C and analyzed by 1.5% agarose gel electrophoresis. Expression of albumin was analyzed as a loading control, as indicated. The −RT channel contained RNA that had not been treated with the RT mixture and is shown as a specificity control.
For real time quantitative PCR, expression levels were determined in duplicate in an ABIPrism7700 system following the manufacturer's protocol. Pre-designed TaqMan® primers for NOX1 (rat Rn00586652_m1; human Hs00246598_m1), human NOX3 (Hs00210462_m1), EGFR (rat Rn00580398_m1; human Hs01076092_m1), Src (Rn00583063_m1), TGF-α (rat Rn00446234_m1; human Hs00608187_m1), and housekeeping glyceraldehyde-3-phosphate dehydrogenase (rat Rn99999916_s1; human Hs99999905_m1) and TaqMan® Universal Master Mix were used. All real time reagents were from Applied Biosystems (Foster City, CA).
Knockdown Assays
For transient siRNA transfection, cells at 70% confluence were transfected using TransIT-siQuest (Mirus, Madison, WI) at 1:300 dilution in complete medium, according to the manufacturer's recommendation, with a final siRNA concentration ranging from 25 to 50 nm during 8 h. After 16 h of incubation in complete medium, cells were trypsinized and seeded for experiments. Oligos were obtained from Sigma Genosys. The oligonucleotide sequences were as follows: (unsilencing) 5′-GUAAGACACGACUUAUCGC-3′; (rat NOX1) 5′-UCAUAUCAUUGCACAUCUA-3′; (rat EGFR) 5′-CCAAAGAAGCCAAGCCGAA-3′; (rat Src) 5′-UGGCCUAUGUGGAGCGGAU-3′; (human NOX1) 5′-ACAAGCUGGUGGCCUAUAU-3′; (human NOX3) 5′-GUACAAAUGCAGUGAGGCA-3′. The unsilencing siRNA used was selected from previous works (17). We have chosen three specific oligonucleotides with maximal efficacy in silico for each gene, and two of them have been tested in the laboratory with similar knockdown efficiency (results not shown).
Western Blot Analysis
Total protein extracts and Western blot procedure were carried out as described previously (17). The antibodies used were as follows: mouse anti-β-actin (clone AC-15); rabbit anti-phospho-Akt (Ser-473); rabbit anti-Akt; rabbit anti-phospho-EGFR (Tyr-1068); rabbit anti-EGFR; rabbit anti-phospho-Src family (Tyr-416); rabbit anti-c-Src; rabbit anti-phospho-p44/42 MAPK (Thr-202/Tyr-204); rabbit anti-p44/42 MAPK; and rabbit anti-phospho-p38 MAPK (Thr-180/Tyr-182). All antibodies were from Cell Signaling Technology (Beverly, MA), except anti-β-actin was from Sigma, and Src was from Santa Cruz Biotechnology. Antibodies were used at 1:1000, except β-actin (1:3000). Protein concentration was measured with BCATM protein assay kit (Pierce).
RESULTS
Autocrine Growth of FaO Rat Hepatoma Cells Is Dependent on ROS Production Addressed by the NADPH Oxidase NOX1
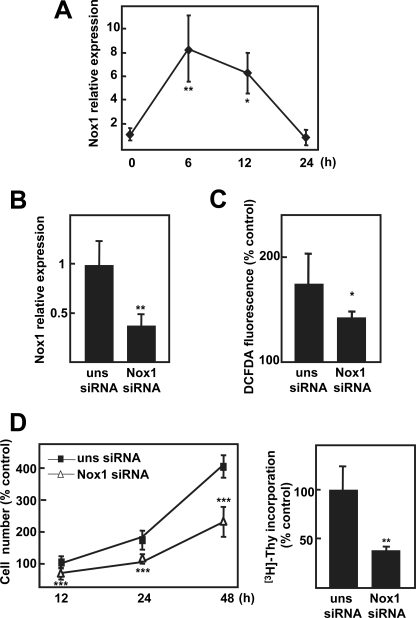
FaO rat hepatoma cells showed basal growth in the absence of serum when analyzed as cell number change (Fig. 1A) or [3H]thymidine incorporation (Fig. 1B). Serum removal produced a transient increase in total ROS measured by DCFDA oxidation, which is not detected when the superoxide detector probe dihydroethydium is used (Fig. 1C), suggesting the activation of a H2O2-producing system. When cells were incubated in the presence of general antioxidants, the NADPH oxidase inhibitor apocynin, or a Rac1 inhibitor, autocrine proliferation was attenuated (Fig. 1D), indicating that ROS produced by an NADPH oxidase system, Rac1-dependent, are required for autocrine proliferation of FaO rat hepatoma cells. We next analyzed changes in the expression of different members of the NOX family after serum withdrawal. We could observe an increase in NOX1 mRNA levels (Fig. 2A) correlating in timing with ROS production (Fig. 1C). This NADPH oxidase has been described to mainly produce ROS in a Rac1-dependent fashion (10). Expression of other members of the NOX family previously proposed to be expressed in hepatocytes, such as NOX2 or NOX4 (14), were barely detected in FaO cells, either under basal conditions (supplemental Fig. 1) or after serum withdrawal (results not shown). To determine whether NOX1 might play a role on the autocrine growth of these cells, we decided to knock down its expression through an siRNA-targeted approach. As shown in Fig. 2B, NOX1 up-regulation induced by serum depletion was attenuated by the specific NOX1 siRNA, which correlated with a parallel decrease in ROS production (Fig. 2C). Moreover, NOX1 knockdown did not affect the expression pattern of other members of the NOX family in these cells (supplemental Fig. 1). Importantly, basal growth in the absence of serum was also attenuated by NOX1 knockdown (Fig. 2D). In summary, autocrine growth requires NOX1-dependent ROS production in FaO rat hepatoma cells.
FIGURE 1.
FaO rat hepatoma cells show autocrine growth through early ROS production. Cells were serum-depleted for the indicated times, and cell number (A), DNA synthesis (48 h) (B), and ROS production (C) were analyzed. D, FaO cells were pretreated with the antioxidants butylated hydroxyanisole (BHA) (200 μm) or GEE (2 mm), the NADPH oxidase inhibitor apocynin (Apo) (300 μm), or Rac1 inhibitor NSC23766 (NSC, 100 μm), which were maintained along the experiment, and cell number at 48 h was determined. Data were calculated relative to zero time, except B, where data are relative to fetal bovine serum (FBS)-treated cells. Data represent the mean ± S.E. of three independent experiments. Student's t test calculated versus undepleted cells in A–C or pretreated versus non-pretreated cells in D. *, p < 0.05; **, p < 0.01; ***, p < 0.001. DHE, dihydroethydium; C, control.
FIGURE 2.
NADPH oxidase NOX1 is involved in autocrine cell growth in FaO rat hepatoma cells. A, cells were serum-depleted for the indicated times, and NOX1 expression was analyzed by real time PCR. B–D, FaO cells transfected with either an unsilencing siRNA (uns siRNA) or a specific siRNA for NOX1 (NOX1 siRNA) were serum-depleted, and it was measured as follows: NOX1 expression by real time PCR (B) and ROS production (C) at 12 h; cell number (D, left panel) and DNA synthesis (D, right panel) at 48 h. All data were calculated relative to serum-depleted cells transfected with unsilencing siRNA, except in C, where they are calculated related to serum-treated cells. Data represent the mean ± S.E. of four independent experiments. Student's t test calculated as unsilencing siRNA versus specific siRNA: *, p < 0.05; **, p < 0.01; ***, p < 0.001.
NOX1-targeted Knockdown or Its Pharmacological Inhibition Attenuates the Expression of Genes Involved in the EGFR Pathway
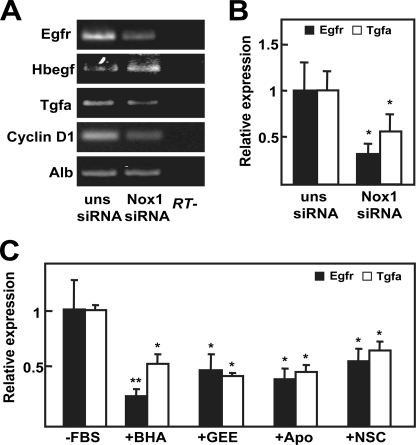
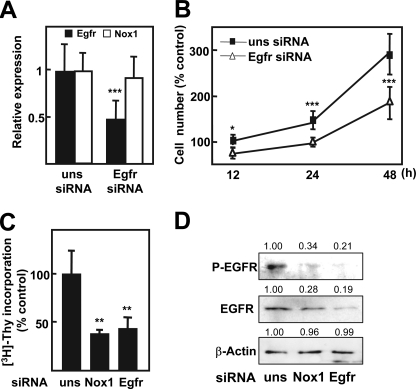
We had previously described that basal growth of FaO cells depends on EGFR activation, through autocrine production of its ligands TGF-α and heparin-binding EGF-like growth factor (9). Consequently, we wondered whether NOX1 knockdown might be modulating the expression level of EGFR itself or EGFR ligands. As shown in Fig. 3A, both EGFR and TGF-α mRNA levels decreased when NOX1 was knocked down, and these events correlated with inhibition of the expression of the EGFR pathway target cyclin D1. We corroborated the decrease of EGFR and TGF-α transcript levels by real time PCR (Fig. 3B). Additionally, we decided to confirm these results by a pharmacological approach using antioxidants or NADPH oxidase inhibitors. As shown in Fig. 3C, all the used compounds were able to diminish expression levels of both EGFR and TGF-α. Next, we decided to analyze the effects on cell proliferation of EGFR knockdown and to compare them with those obtained in NOX1-depleted cells. Results indicated that EGFR knockdown did not modify NOX1 expression level (Fig. 4A) and inhibited autocrine growth at a similar extent to that observed for NOX1 knockdown (Fig. 4, B and C). Moreover, phosphorylation of EGFR was similarly diminished by both siRNAs (Fig. 4D). All these results suggest that NOX1 knockdown, or its pharmacological inhibition, might reduce FaO cells autocrine growth through inhibiting EGFR and TGF-α expression.
FIGURE 3.
NOX1-targeted knockdown or pharmacological inhibition decreases EGFR expression. A and B, FaO cells were transfected with either an unsilencing siRNA (uns siRNA) or a specific siRNA for NOX1 (NOX1 siRNA) and serum-deprived for 12 h. A, EGFR and its ligand expression was determined by RT-PCR. Albumin (Alb) was used as loading control. A representative experiment is shown (n = 3). B, EGFR and TGF-α expression were measured by real time PCR. Data were calculated relative to cells transfected with unsilencing siRNA. C, cells were treated as in Fig. 1D, and EGFR and TGF-α expression were measured by real time PCR at 12 h of treatment. Data represent the mean ± S.E. of three independent experiments. Student's t test calculated as unsilencing siRNA versus specific siRNA in B or relative to serum-depleted cells in C. *, p < 0.05; **, p < 0.01. FBS, fetal bovine serum; BHA, butylated hydroxyanisole; Apo, apocynin; NSC, NSC23766.
FIGURE 4.
NOX1-targeted knockdown mimics EGFR knockdown effects. FaO cells were transfected with either an unsilencing siRNA (uns siRNA), a specific siRNA for NOX1 (NOX1 siRNA), or a specific siRNA for EGFR (EGFR siRNA). A, EGFR and NOX1 expression by real time PCR at 12 h. B, cell number at different times. C, DNA synthesis at 48 h. D, Western blot at 12 h (a representative experiment), indicating the mean of the densitometry analysis of three Western blots for each protein respective to β-actin, used as loading control. All data were calculated relative to cells transfected with unsilencing siRNA. Data represent the mean ± S.E. of three independent experiments. Student's t test was calculated as unsilencing siRNA versus specific siRNA. *, p < 0.05; **, p < 0.01; ***, p < 0.001.
NOX1-derived Early ROS Production Activates Different Signaling Pathways to Promote Its Own Up-regulation and to Increase EGFR and TGF-α Expression upon Serum Withdrawal
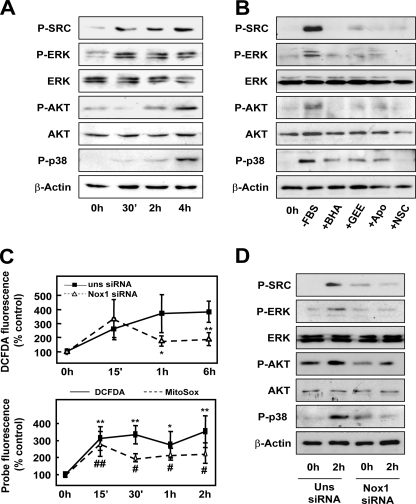
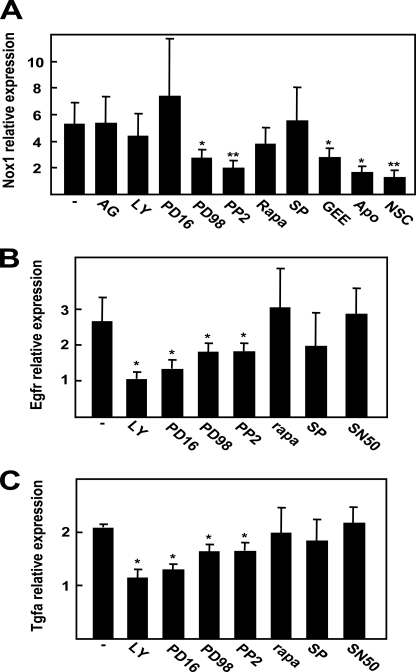
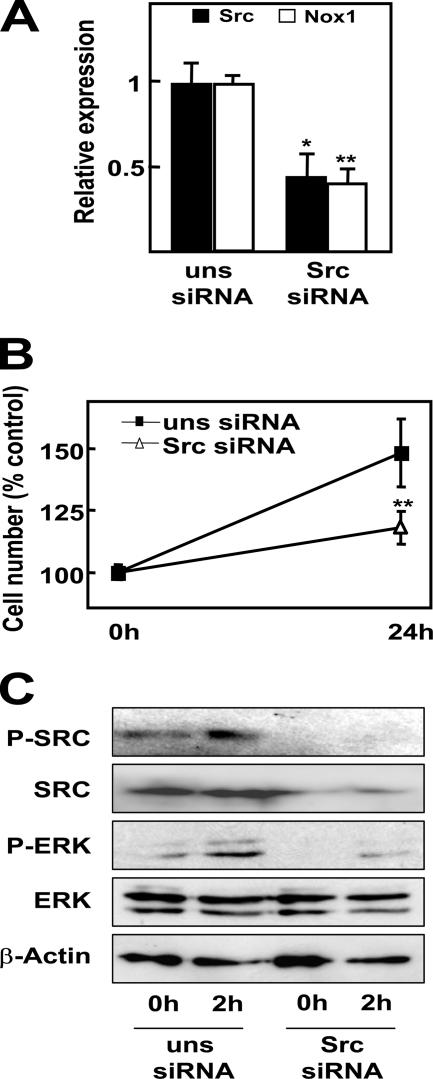
Next, we wanted to elucidate which intracellular signals are implicated in the events induced upon serum deprivation. By means of Western blot, we found an increased phosphorylation of ERK and c-Src as early as 30 min after serum deprivation, followed by phosphorylation of AKT and p38 MAPK at 2 h (Fig. 5A). Preincubation with antioxidants almost completely abrogated such phosphorylations (Fig. 5B), which indicates that ROS mediate these events. A detailed kinetic analysis at early times revealed that ROS intracellular content increased as soon as 15 min after serum withdrawal (Fig. 5C, upper panel). Surprisingly, this first wave of ROS was not attenuated after NOX1 knockdown, which completely inhibited ROS production at later times. In fact, this first peak of ROS might be produced by the mitochondria, as revealed when we used MitoSox as a probe (Fig. 5C, lower panel). Both NOX1 targeting knockdown (Fig. 5D) or inhibition of NADPH oxidase activity (with apocynin or the Rac1 inhibitor; Fig. 5B) attenuated early phosphorylation of Src, ERKs, p38, and AKT. Activation of Src and ERKs at earlier times (30 min) were also abrogated when NOX1 was knocked down (results not shown). Using different inhibitors of the above cited signaling pathways, we addressed that Src and ERK activities were necessary to induce NOX1 up-regulation at 6 h (Fig. 6A). Interestingly, ROS production by an NADPH oxidase system was also required, because NOX1 up-regulation was impaired in the presence of antioxidants and apocynin (Fig. 6A). Moreover, p38, AKT, Src, and ERK activities appear to play a role in the intracellular signaling that concludes in EGFR and TGF-α up-regulation (Fig. 6, B and C). Other intracellular signals (such as mammalian target of rapamycin, c-Jun N-kinase, or NF-κB) did not play any role. Interestingly, Src-targeted knockdown resulted in reduced NOX1 up-regulation (Fig. 7A), diminished autocrine growth (Fig. 7B), and attenuated ERK phosphorylation (Fig. 7C). All these data might suggest that after serum withdrawal, NOX1 early activation induces a positive feedback loop to increase its own expression level, a process mediated by Src, which in turn activates ERK. Furthermore, NOX1 also mediates later activation of p38 and AKT, which are required for the increased expression of EGFR and TGF-α.
FIGURE 5.
NOX1-dependent ROS activate different signaling pathways in response to serum withdrawal. A, Western blot at the indicated times after serum depletion. B, cells were pretreated as in Fig. 1D and then serum-depleted for 2 h. FBS, fetal bovine serum; BHA, butylated hydroxyanisole; Apo, apocynin; NSC, NSC23766. C, upper panel, total ROS production of cells transfected with either an unsilencing siRNA (uns siRNA) or a specific siRNA for NOX1 (NOX1 siRNA) and serum-depleted for the indicated times. Data represent the mean ± S.E. of four independent experiments. Student's t test as unsilencing siRNA versus specific siRNA. *, p < 0.05. C, lower, kinetic determination of mitochondrial (MitoSOX, dotted line) and total (DCFDA) ROS production at the indicated times after serum withdrawal. Mean ± S.E. of three independent experiments, where Student's t test was calculated versus undepleted cells for each probe. *, #, p < 0.05; **, ##, p < 0.01 D, Western blot of cells transfected with either an unsilencing siRNA (uns siRNA) or a specific siRNA for NOX1 (NOX1 siRNA) and serum-depleted for the indicated times. A, B, and D, representative Western blot of at least three different experiments is shown. β-Actin was used as loading control.
FIGURE 6.
Signaling pathways controlling NOX1, EGFR, and TGF-α up-regulation. Real time PCR determination of NOX1 (A), EGFR (B), and TGF-α (C) after 6 h (A) or 12 h (B and C) of serum withdrawal. Cells were pretreated 30 min previous to serum deprivation with the EGFR inhibitor AG1478 (AG) (20 μm), PI3K inhibitor LY294002 (LY) (20 μm), MEK inhibitor PD98059 (PD98) (50 μm), p38 MAPK inhibitor PD169316 (PD16) (800 nm), Src kinase family inhibitor PP2 (PP2) (10 μm), mammalian target of rapamycin pathway inhibitor rapamycin (Rapa) (10 μm), c-Jun N-kinase inhibitor SP600125 (SP) (40 μm), GEE (2 mm), apocynin (Apo) (300 μm), Rac1 inhibitor NSC23766 (NSC) (100 μm), or NF-κB inhibitor peptide SN50 (50 μg/ml). Data calculated relative to non-pretreated cells represent the mean ± S.E. of four independent experiments. Student's t test calculated versus non-pretreated cells: *, p < 0.05; **, p < 0.01.
FIGURE 7.
Src-targeted knockdown inhibits NOX1-dependent autocrine growth. FaO cells were transfected with either an unsilencing siRNA (uns siRNA) or a specific siRNA for Src (Src siRNA) prior to serum depletion. A, Src and NOX1 expression at 6 h by real time PCR. B, cell number at 24 h. A and B, data represent the mean ± S.E. of four independent experiments. Student's t test calculated as unsilencing siRNA versus specific siRNA: *, p < 0.05; **, p < 0.01. C, Western blot at 2 h. β-Actin was used as loading control. A representative experiment is shown (n = 3).
NOX1 Regulates EGFR and TGF-α Expression in HCC Cells
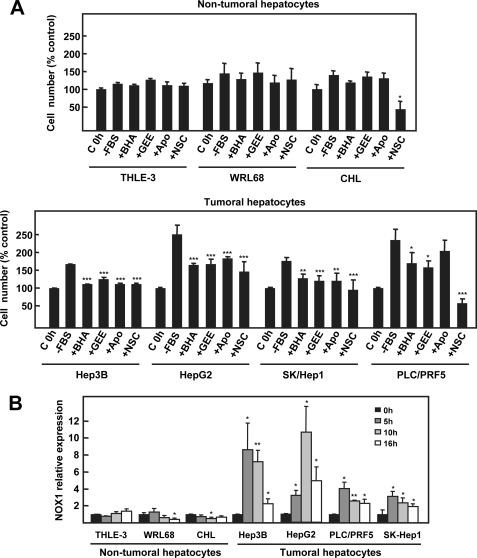
In view of the results presented above, we wanted to investigate whether NOX1 might play also a role on the autocrine growth of human HCC cells. All the studied HCC cell lines showed autocrine cell growth and up-regulated NOX1 during the first 5–10 h of serum withdrawal (Fig. 8, A, lower panel, and B). Moreover, autocrine growth was inhibited in the presence of antioxidants, apocynin or the Rac1 inhibitor (Fig. 8A, lower panel). Importantly, non-tumoral hepatocyte cell lines did not up-regulate NOX1 nor grow in an autocrine fashion (Fig. 8A, upper panel, and B). In addition, the use of antioxidants or NADPH oxidase inhibitors had no effect on growth or toxicity, except in the case of Rac1 inhibitor in CHL cells (Fig. 8A, upper panel).
FIGURE 8.
NOX1 is involved in the autocrine growth of human hepatocellular carcinoma cell lines. A, cell growth of THLE-3, WRL68, and CHL (upper panel) or Hep3B, HepG2, SK-Hep1, and PLC/PRF5 (lower panel) after 48 h of serum deprivation in the presence or absence of butylated hydroxyanisole (BHA) (200 μm), GEE (2 mm), apocynin (Apo) (300 μm) or Rac1 inhibitor NSC23766 (NSC) (100 μm), which were maintained along the experiment. C, control; FBS, fetal bovine serum. Data were calculated relative to untreated cells for each cell type and represent the mean ± S.E. of three independent experiments with triplicated wells. Student's t test calculated versus untreated cells: *, p < 0.05; **, p < 0.01; ***, p < 0.001. B, THLE-3, WRL68, CHL, Hep3B, HepG2, SK-Hep1, and PLC/PRF5 cells were serum-deprived, and NOX1 expression was measured by real time PCR at the indicated times. Data represent the mean ± S.E. of three independent experiments. Student's t test calculated versus zero time for each cell type: *, p < 0.05; **, p < 0.01.
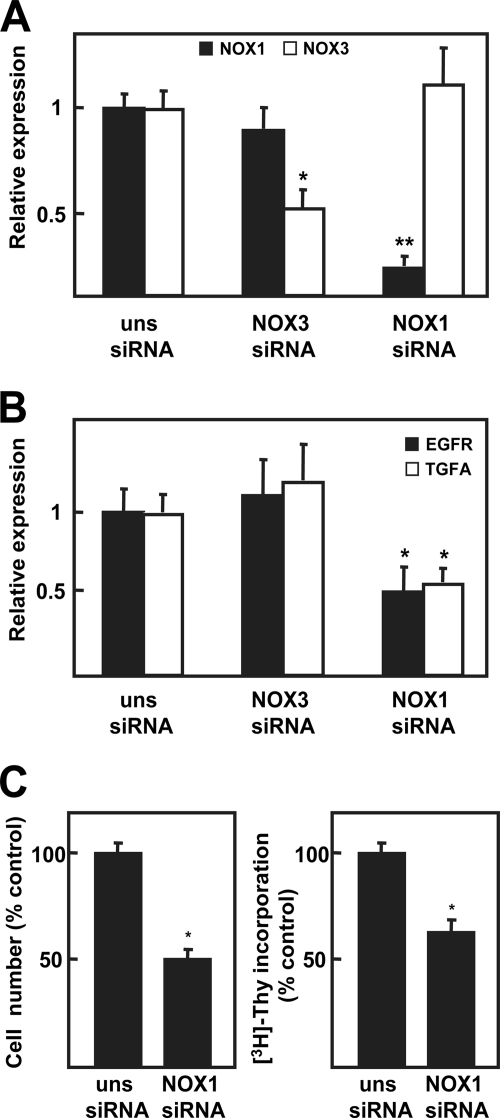
In agreement with the results obtained in FaO cells, NOX1-targeted knockdown decreased EGFR and TGF-α (Fig. 9B) transcript levels in a selected cell line (HepG2 cells), correlating with autocrine growth inhibition (Fig. 9C). Moreover, complementary siRNA experiments were performed targeting knockdown NOX3, also expressed by this cell line (supplemental Fig. 2), which showed no effect in decreasing EGFR and TGF-α (Fig. 9, B and C). Importantly, neither NOX1 knockdown nor NOX3 knockdown modified the NADPH oxidase expression pattern of HepG2 cells (supplemental Fig. 2). According to these results, NOX1 might be also controlling the autocrine growth of human HCC cells, regulating EGFR and TGF-α expression, as observed in the rat hepatoma cells.
FIGURE 9.
NOX1 knockdown, and not NOX3 knockdown, decreases EGFR and TGF-α expression in HepG2 cells. HepG2 cells were transfected with either an unspecific siRNA (uns siRNA), a specific siRNA for human NOX1 (NOX1 siRNA), or a specific siRNA for human NOX3 (NOX3 siRNA) and different parameters were analyzed: NOX1 and NOX3 (A), EGFR and TGF-α expression (B), by real time PCR at 12 h; cell number (left panel) and DNA synthesis (right panel) at 48 h (C). All data were calculated relative to untreated cells transfected with unsilencing siRNA, and represent the mean ± S.E. of four independent experiments. Student's t test calculated as unsilencing siRNA versus specific siRNA. *, p < 0.05; **, p < 0.01.
In summary, NOX1-targeted knockdown, or its pharmacological inhibition, inhibits autocrine growth of human liver cancer cells, in a similar way to that observed in FaO rat hepatoma cells. All the presented results might indicate that drugs that block the NADPH oxidase pathway might be contemplated as promising therapeutic approaches to combat liver cancer.
DISCUSSION
Reactive oxygen species have important physiological roles and mediate key cellular functions, such as proliferation and cell death. It is known that controlled production of low concentrations of ROS increase cellular growth, usually acting as second messengers upon stimulation by cytokines, growth factors, and hormones (19). In this context, discovery of the NOX family of NADPH oxidases has helped to reconcile the idea of ROS as free radicals with the complex regulation of cellular signaling. NOX1 was the first gp91phox homologue described (20). It is constitutively expressed in different cell types, although predominantly in colon epithelium (21) and vascular smooth cells (22). Its superoxide forming activity is regulated through the formation of a macromolecular complex with cytosolic subunits and Rac1 (23), which has been demonstrated to be essential for NOX1 activity (24). Moreover, it has been shown that its expression increases in response to serum, growth signals, or cytokines (25, 26). NOX1-dependent ROS have been linked to cell proliferation in response to extracellular mitogenic signals (27, 28) and also to the maintenance of cell cycle progression under low serum conditions in lung epithelial cells (29).
Our previous results had indicated that FaO rat hepatoma cells show resistance to apoptosis in the absence of serum, and under these conditions, they are able to proliferate in an autocrine fashion (Fig. 1, A and B) (9). In this work, we show that FaO cells produce ROS during the first 24 h after serum withdrawal, which are essential for autocrine growth (Fig. 1, C and D). The use of antioxidants, apocynin, or the Rac1 inhibitor NSC23766 suggests that ROS are produced by a Rac1-dependent NADPH oxidase system, which we propose to be NOX1. However, it is necessary to keep in mind that currently no completely specific NADPH oxidase inhibitor is commercially available (30).
Two different facts support this hypothesis as follows: 1) NOX1 is up-regulated at the mRNA level with a maximum reached at 6 h, and 2) its targeted knockdown decreases ROS production and autocrine growth (Fig. 2). Moreover, neither serum deprivation nor NOX1 siRNA modifies the pattern expression of other NADPH oxidases in FaO cells (supplemental Fig. 1). These facts reinforce the role of NOX1 as a pro-survival/proliferative signal in hepatoma cells, in agreement with some other cellular models where NOX1 also plays roles related to proliferation, differentiation, and survival (31, 32). Even if we failed in detecting superoxide anion formation (Fig. 1C), it is believed that signaling from NOX1 takes place through H2O2, rapidly formed after superoxide anion release due to its high instability (10).
Autocrine growth through EGFR ligands has been described to occur in highly proliferative hepatocytes (tumoral or regenerating) versus normal cells (7, 33). In this sense, FaO rat hepatoma cells express higher levels of EGFR ligands as compared with normal adult rat hepatocytes (7), and they are responsible for autocrine growth of these cells (9). We had also previously found that fetal rat hepatocytes produce EGFR ligands in response to TGF-β, which is mediated by an apocynin-inhibited NADPH oxidase system, likely NOX1 and/or NOX2 (16). For all these reasons, we first thought about a possible impairment of the EGFR pathway as the main cause for autocrine growth inhibition when NOX1 was knocked down. In fact, we found a diminished EGFR and TGF-α expression at the mRNA level, which correlated with lower cyclin D1 expression (Fig. 3, A and B). These effects on EGFR and TGF-α expression were also confirmed using antioxidants and NADPH oxidase inhibitors (Fig. 3C), previously shown to be effective inhibiting autocrine growth (Fig. 1D). More importantly, effects of NOX1 siRNA and EGFR siRNA were equivalent, regarding growth inhibition and EGFR phosphorylation (Fig. 4). In addition, EGFR siRNA did not affect NOX1 expression or ROS production in response to serum deprivation (Fig. 4A) (data not shown), suggesting that NOX1/ROS might be upstream from the changes in transcription of EGFR and TGF-α genes (Fig. 10). In agreement with our data, EGFR expression has been previously described to be controlled via NADPH oxidase-derived ROS in colon cancer cells upon angiotensin II stimulation (34).
FIGURE 10.
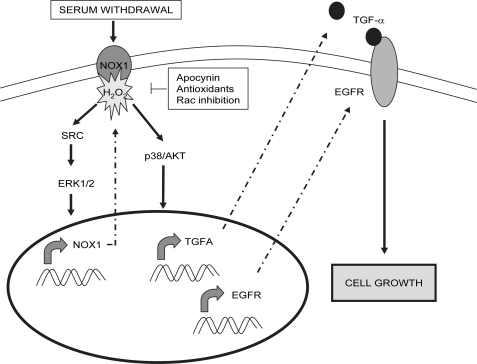
Proposed model for the effect of NOX1 on autocrine cell growth of liver tumor cells. Upon serum withdrawal, early ROS production by NOX1 activates an Src/ERK pathway promoting a positive feedback loop on NOX1 up-regulation. In parallel, NOX1-produced ROS stimulate p38 and AKT activation which, in turn, induce TGF-α and EGFR expression and consequently the activation of the EGFR pathway to induce cell growth. This pathway might be common to tumoral liver cells, being inactive in normal cells.
Regarding the early signaling pathways activated upon serum deprivation, we have shown that, during the first 2 h, there is a sequential phosphorylation of Src and ERK followed by p38 and AKT (Fig. 5A), proteins known to be redox-sensitive (35). These signaling events correlate with high ROS production in the initial period of serum deprivation (Fig. 5C) and are NOX1-dependent because they are inhibited by antioxidants, apocynin, Rac1 inhibitor, or NOX1-targeted knockdown (Fig. 5, B and D). Data shown in Fig. 6A indicate that NOX1 up-regulation is inhibited by antioxidants, apocynin or the Rac inhibitor, but also by Src or ERK inhibition. Together, this suggests that the NOX1 protein already expressed in the cell might become activated in the first 30–60 min, creating a positive feedback loop that promotes its own up-regulation at the mRNA level through Src and ERK activity. Moreover, Src-targeted knockdown decreases NOX1 up-regulation and also ERK activation (Fig. 7), leading us to situate Src before ERK in the feedback loop pathway (Fig. 10). Interestingly, almost all the models describing mechanisms underlying NOX1 up-regulation propose ERK activation as a common intermediate event (27, 36). However, to our knowledge, it is the first time that an autoregulatory loop at the expression level has been shown for NOX1.
It has been previously described that mitochondrial ROS activate a NOX1-dependent cell death pathway mediated by PI3K upon serum withdrawal (37). In this report, the authors describe two waves of ROS as follows: the first wave is driven by the mitochondria to activate PI3K and up-regulate Lyn, a member of the Src family of kinases, and the second wave is NOX1-dependent. However, in our case, although we could observe two phases of ROS production, one of them mitochondrial, with a maximum at 15 min, and lower but constant levels during the first 2 h (Fig. 5C, upper panel), all the signaling events detected appear to be dependent on NOX1, because they are abrogated by NOX1-targeted knockdown. Whether or not early mitochondrial ROS play a role in the events here described remains unclear. We might hypothesize that they could participate regulating Rac1 recruitment or function to activate NOX1, but they might be simple side effects of nutrient lack.
As stated above, in addition to the autoregulatory signaling pathway activated by NOX1, we have also found p38 MAPK and AKT phosphorylation at 2 h of serum deprivation (Fig. 5A), which are also NOX1-dependent because they are inhibited by NOX1 knockdown (Fig. 5D). This second branch of signaling seems to be responsible for EGFR and TGF-α up-regulation (Fig. 10), because PI3K/AKT and p38 inhibitors impede such increase at the mRNA level (Fig. 6, B and C). In fact, a positive correlation between phosphorylated AKT and high expression levels of EGFR and TGF-α has already been described in non-small cell lung cancer (38). In addition, some reports have linked proliferation to EGFR up-regulation through AKT, MAPK, and NF-κB-dependent pathways in vascular smooth muscle cells (39, 40). TGF-α expression has been also reported to be up-regulated by NF-κB in airway epithelial cells (41) or human hepatoma cells (42). However, we failed in detecting the NF-κB p65 subunit translocated to the nucleus as a hallmark of its activity (data not shown), and inhibition of the NF-κB pathway with the peptide SN50 does not affect EGFR and TGF-α expression levels (Fig. 6, B and C), excluding a role for this transcription factor in our model. The slighter effect of Src and ERK inhibitors on EGFR and TGF-α expression could be a direct action on transcription or, more likely, indirect through inhibition of NOX1 up-regulation, which would decrease the total ROS content to activate p38 and AKT.
Currently, it is well known that tumoral cells, including liver cancer, show elevated ROS content when compared with normal cells. In fact, endogenous production of ROS has been reported to be important to control growth of liver tumor cells (43, 44). Moreover, it has been proposed that ROS produced by NADPH oxidases are implicated in hepatocarcinogenesis processes occurring in different animal models, such as the TGF-α/c-Myc transgenic mice (45), or exposure to carcinogens such as diethylnitrosamine (46). In fact, NOX1 overexpression has been related to different types of epithelial cancer, such as colon adenoma and adenocarcinomas (47) or prostate cancer (48). Interestingly, NOX1 up-regulation in response to serum depletion seems to be a common event in several human hepatocarcinoma cell lines in contrast to non-tumoral hepatocytes, in which no NOX1 modulation or even down-regulation is observed (Fig. 8B). Moreover, regulation of EGFR/TGF-α expression by NOX1 is also observed in one selected cell line, namely HepG2 cells (Fig. 9, A and B). This cell line also show NOX3 expression, previously reported to mediate insulin-induced signaling events (49). However, only NOX1 seems to be implicated in HepG2 response to serum withdrawal, because NOX3 knockdown did not affect to EGFR/TGF-α expression (Fig. 9B).
Results obtained with apocynin and also with antioxidants and the Rac1 inhibitor (Fig. 9) show as well the high efficacy of NOX1-derived ROS inhibition to impede autocrine cell growth in human HCC cell lines, regardless of the mutational status of the p53 or RAS/RAF pathway. On the one hand, we have chosen for our experiments HepG2 and SK-Hep1 cells presenting overactivation of RAS and B-RAF, respectively, and we found almost complete impairment of growth upon incubation antioxidants or NADPH oxidase inhibitors. On the other hand, Hep3B and PLC/PRF5 cells, p53-defective, also present high inhibition of autocrine growth. Importantly, the use of these compounds show no toxicity when applied to non-tumoral hepatocytes (Fig. 8A, upper panel). In summary, results presented in this study indicate that NOX1-targeted knockdown, or NADPH oxidase pharmacological inhibition, effectively impairs autocrine cell growth of liver tumor cells decreasing EGFR and TGF-α expression through a mechanism involving p38 MAPK and AKT activation. Indeed, NOX1 pharmacological inhibition might be a promising therapeutic approach for hepatocellular carcinoma.
Supplementary Material
Acknowledgments
We thank Beatriz Parejo and Glòria Jorba for their technical assistance.
This work was supported in part by Ministerio de Ciencia e Innovación, Spain, Grants BFU2006-01036, BFU2009-07219, and ISCIII-RTICC RD06/0020 and AGAUR-Generalitat de Catalunya Grants 2005SGR-00549 and 2009SGR-312.

The on-line version of this article (available at http://www.jbc.org) contains supplemental Figs. 1 and 2.
- HCC
- hepatocellular carcinoma
- DCFDA
- 2′,7′-dichlorodihydrofluorescein diacetate
- EGF
- epidermal growth factor
- EGFR
- EGF receptor
- ROS
- reactive oxygen species
- TGF
- transforming growth factor
- GEE
- glutathione ethyl ester
- siRNA
- small interfering RNA
- MAPK
- mitogen-activated protein kinase
- RT
- reverse transcription
- CHL
- Chang liver cell
- PI3K
- phosphatidylinositol 3-kinase
- MEK
- mitogen-activated protein kinase/extracellular signal-regulated kinase kinase
- for
- forward
- rev
- reverse.
REFERENCES
- 1.Sherman M. (2005) Semin. Liver Dis. 25, 143–154 [DOI] [PubMed] [Google Scholar]
- 2.Llovet J. M., Bruix J. (2008) J. Hepatol. 48, S20–S37 [DOI] [PubMed] [Google Scholar]
- 3.Fabregat I. (2009) World J. Gastroenterol. 15, 513–520 [DOI] [PMC free article] [PubMed] [Google Scholar]
- 4.Llovet J. M., Bruix J. (2008) Hepatology 48, 1312–1327 [DOI] [PMC free article] [PubMed] [Google Scholar]
- 5.Baselga J., Arteaga C. L. (2005) J. Clin. Oncol. 23, 2445–2459 [DOI] [PubMed] [Google Scholar]
- 6.Scaltriti M., Baselga J. (2006) Clin. Cancer Res. 12, 5268–5272 [DOI] [PubMed] [Google Scholar]
- 7.Caja L., Ortiz C., Bertran E., Murillo M. M., Miró-Obradors M. J., Palacios E., Fabregat I. (2007) Cell. Signal. 19, 683–694 [DOI] [PubMed] [Google Scholar]
- 8.Hisaka T., Yano H., Haramaki M., Utsunomiya I., Kojiro M. (1999) Int. J. Oncol. 14, 453–460 [DOI] [PubMed] [Google Scholar]
- 9.Ortiz C., Caja L., Sancho P., Bertran E., Fabregat I. (2008) Biochem. Pharmacol. 15, 1935–1945 [DOI] [PubMed] [Google Scholar]
- 10.Brown D. I., Griendling K. K. (2009) Free Radic. Biol. Med. 47, 1239–1253 [DOI] [PMC free article] [PubMed] [Google Scholar]
- 11.Nauseef W. M. (2008) J. Biol. Chem. 283, 16961–16965 [DOI] [PMC free article] [PubMed] [Google Scholar]
- 12.De Minicis S., Brenner D. A. (2007) Arch. Biochem. Biophys. 462, 266–272 [DOI] [PMC free article] [PubMed] [Google Scholar]
- 13.Martyn K. D., Frederick L. M., von Loehneysen K., Dinauer M. C., Knaus U. G. (2006) Cell. Signal. 18, 69–82 [DOI] [PubMed] [Google Scholar]
- 14.Carmona-Cuenca I., Roncero C., Sancho P., Caja L., Fausto N., Fernández M., Fabregat I. (2008) J. Hepatol. 49, 965–976 [DOI] [PubMed] [Google Scholar]
- 15.Caja L., Sancho P., Bertran E., Iglesias-Serret D., Gil J., Fabregat I. (2009) Cancer Res. 69, 7595–7602 [DOI] [PubMed] [Google Scholar]
- 16.Murillo M. M., Carmona-Cuenca I., Del Castillo G., Ortiz C., Roncero C., Sánchez A., Fernández M., Fabregat I. (2007) Biochem. J. 405, 251–259 [DOI] [PMC free article] [PubMed] [Google Scholar]
- 17.Sancho P., Bertran E., Caja L., Carmona-Cuenca I., Murillo M. M., Fabregat I. (2009) Biochim. Biophys. Acta 1793, 253–263 [DOI] [PubMed] [Google Scholar]
- 18.Sánchez A., Alvarez A. M., Benito M., Fabregat I. (1996) J. Biol. Chem. 271, 7416–7422 [DOI] [PubMed] [Google Scholar]
- 19.Thannickal V. J., Fanburg B. L. (2000) Am. J. Physiol. Lung Cell Mol. Physiol. 279, L1005–L1028 [DOI] [PubMed] [Google Scholar]
- 20.Suh Y. A., Arnold R. S., Lassegue B., Shi J., Xu X., Sorescu D., Chung A. B., Griendling K. K., Lambeth J. D. (1999) Nature 401, 79–82 [DOI] [PubMed] [Google Scholar]
- 21.Bánfi B., Clark R. A., Steger K., Krause K. H. (2003) J. Biol. Chem. 278, 3510–3513 [DOI] [PubMed] [Google Scholar]
- 22.Lassègue B., Sorescu D., Szöcs K., Yin Q., Akers M., Zhang Y., Grant S. L., Lambeth J. D., Griendling K. K. (2001) Circ. Res. 88, 888–894 [DOI] [PubMed] [Google Scholar]
- 23.Cheng G., Diebold B. A., Hughes Y., Lambeth J. D. (2006) J. Biol. Chem. 281, 17718–17726 [DOI] [PubMed] [Google Scholar]
- 24.Miyano K., Ueno N., Takeya R., Sumimoto H. (2006) J. Biol. Chem. 281, 21857–21868 [DOI] [PubMed] [Google Scholar]
- 25.Teshima S., Kutsumi H., Kawahara T., Kishi K., Rokutan K. (2000) Am. J. Physiol. Gastrointest. Liver Physiol. 279, G1169–G1176 [DOI] [PubMed] [Google Scholar]
- 26.Kim Y. S., Morgan M. J., Choksi S., Liu Z. G. (2007) Mol. Cell 26, 675–687 [DOI] [PubMed] [Google Scholar]
- 27.Fan C., Katsuyama M., Nishinaka T., Yabe-Nishimura C. (2005) FEBS Lett. 579, 1301–1305 [DOI] [PubMed] [Google Scholar]
- 28.de Carvalho D. D., Sadok A., Bourgarel-Rey V., Gattacceca F., Penel C., Lehmann M., Kovacic H. (2008) Int. J. Cancer 122, 1757–1764 [DOI] [PubMed] [Google Scholar]
- 29.Ranjan P., Anathy V., Burch P. M., Weirather K., Lambeth J. D., Heintz N. H. (2006) Antioxid. Redox. Signal. 8, 1447–1459 [DOI] [PubMed] [Google Scholar]
- 30.Jaquet V., Scapozza L., Clark R. A., Krause K. H., Lambeth J. D. (2009) Antioxid. Redox. Signal. 11, 2535–2552 [DOI] [PubMed] [Google Scholar]
- 31.Katsuyama M., Fan C., Arakawa N., Nishinaka T., Miyagishi M., Taira K., Yabe-Nishimura C. (2005) Biochem. J. 386, 255–261 [DOI] [PMC free article] [PubMed] [Google Scholar]
- 32.Brewer A. C., Sparks E. C., Shah A. M. (2006) Free Radic. Biol. Med. 40, 260–274 [DOI] [PubMed] [Google Scholar]
- 33.Cosgrove B. D., Cheng C., Pritchard J. R., Stolz D. B., Lauffenburger D. A., Griffith L. G. (2008) Hepatology 48, 276–288 [DOI] [PMC free article] [PubMed] [Google Scholar]
- 34.Nakai K., Yoneda K., Igarashi J., Moriue T., Kosaka H., Kubota Y. (2008) J. Dermatol. Sci. 51, 181–189 [DOI] [PubMed] [Google Scholar]
- 35.Aslan M., Ozben T. (2003) Antioxid. Redox. Signal. 5, 781–788 [DOI] [PubMed] [Google Scholar]
- 36.Adachi Y., Shibai Y., Mitsushita J., Shang W. H., Hirose K., Kamata T. (2008) Oncogene 27, 4921–4932 [DOI] [PubMed] [Google Scholar]
- 37.Lee S. B., Bae I. H., Bae Y. S., Um H. D. (2006) J. Biol. Chem. 281, 36228–36235 [DOI] [PubMed] [Google Scholar]
- 38.Mukohara T., Kudoh S., Matsuura K., Yamauchi S., Kimura T., Yoshimura N., Kanazawa H., Hirata K., Inoue K., Wanibuchi H., Fukushima S., Yoshikawa J. (2004) Anticancer Res. 24, 11–17 [PubMed] [Google Scholar]
- 39.Hsieh H. L., Sun C. C., Wu C. B., Wu C. Y., Tung W. H., Wang H. H., Yang C. M. (2008) J. Cell Biochem. 103, 1732–1746 [DOI] [PubMed] [Google Scholar]
- 40.Hsieh H. L., Tung W. H., Wu C. Y., Wang H. H., Lin C. C., Wang T. S., Yang C. M. (2009) Arterioscler. Thromb. Vasc. Biol. 29, 1594–1601 [DOI] [PubMed] [Google Scholar]
- 41.Yan F., Li W., Jono H., Li Q., Zhang S., Li J. D., Shen H. (2008) Biochem. Biophys. Res. Commun. 366, 513–519 [DOI] [PubMed] [Google Scholar]
- 42.Sato Y., Kato J., Takimoto R., Takada K., Kawano Y., Miyanishi K., Kobune M., Sato Y., Takayama T., Matunaga T., Niitsu Y. (2006) Gut 55, 1801–1808 [DOI] [PMC free article] [PubMed] [Google Scholar]
- 43.Dong-Yun S., Yu-Ru D., Shan-Lin L., Ya-Dong Z., Lian W. (2003) FEBS Lett. 542, 60–64 [DOI] [PubMed] [Google Scholar]
- 44.Laurent A., Nicco C., Chéreau C., Goulvestre C., Alexandre J., Alves A., Lévy E., Goldwasser F., Panis Y., Soubrane O., Weill B., Batteux F. (2005) Cancer Res. 65, 948–956 [PubMed] [Google Scholar]
- 45.Calvisi D. F., Ladu S., Hironaka K., Factor V. M., Thorgeirsson S. S. (2004) J. Hepatol. 41, 815–822 [DOI] [PubMed] [Google Scholar]
- 46.Teufelhofer O., Parzefall W., Kainzbauer E., Ferk F., Freiler C., Knasmüller S., Elbling L., Thurman R., Schulte-Hermann R. (2005) Carcinogenesis 26, 319–329 [DOI] [PubMed] [Google Scholar]
- 47.Fukuyama M., Rokutan K., Sano T., Miyake H., Shimada M., Tashiro S. (2005) Cancer Lett. 221, 97–104 [DOI] [PubMed] [Google Scholar]
- 48.Lim S. D., Sun C., Lambeth J. D., Marshall F., Amin M., Chung L., Petros J. A., Arnold R. S. (2005) Prostate 62, 200–207 [DOI] [PubMed] [Google Scholar]
- 49.Carnesecchi S., Carpentier J. L., Foti M., Szanto I. (2006) Exp. Cell Res. 312, 3413–3424 [DOI] [PubMed] [Google Scholar]
Associated Data
This section collects any data citations, data availability statements, or supplementary materials included in this article.


