Abstract
Rac1, which is associated with cytoskeletal pathways, can activate phospholipase Cβ2 (PLCβ2) to increase intracellular Ca2+ levels. This increased Ca2+ can in turn activate the very robust PLCδ1 to synergize Ca2+ signals. We have previously found that PLCβ2 will bind to and inhibit PLCδ1 in solution by an unknown mechanism and that PLCβ2·PLCδ1 complexes can be disrupted by Gβγ subunits. However, because the major populations of PLCβ2 and PLCδ1 are cytosolic, their regulation by Gβγ subunits is not clear. Here, we have found that the pleckstrin homology (PH) domains of PLCβ2 and PLCβ3 are the regions that result in PLCδ1 binding and inhibition. In cells, PLCβ2·PLCδ1 form complexes as seen by Förster resonance energy transfer and co-immunoprecipitation, and microinjection of PHβ2 dissociates the complex. Using PHβ2 as a tool to assess the contribution of PLCβ inhibition of PLCδ1 to Ca2+ release, we found that, although PHβ2 only results in a 25% inhibition of PLCδ1 in solution, in cells the presence of PHβ2 appears to eliminates Ca2+ release suggesting a large threshold effect. We found that the small plasma membrane population of PLCβ2·PLCδ1 is disrupted by activation of heterotrimeric G proteins, and that the major cytosolic population of the complexes are disrupted by Rac1 activation. Thus, the activity of PLCδ1 is controlled by the amount of bound PLCβ2 that changes with displacement of the enzyme by heterotrimeric or small G proteins. Through PLCβ2, PLCδ1 activation is linked to surface receptors as well as signals that mediate cytoskeletal pathways.
Keywords: Calcium, Fluorescence Resonance Energy Transfer (FRET), G Proteins, Phosphatidylinositol Signaling, Protein-Protein Interactions
Introduction
Mammalian phospholipase Cs (PLCs)2 are critical signaling enzymes whose activity results in an increase in intracellular Ca2+ through the hydrolysis of PI(4,5)P2. There are now nine known types of mammalian PLCs that vary in their tissue distribution and their cellular regulation (for review see Refs. 1, 2). Most PLCs have established protein regulators, and many appear to have multiple mechanisms of regulation that, in principle, may connect different signaling pathways. It is possible that, under some circumstances, different PLC isozymes coordinate to elicit a specific cellular response. As described below, we have recently found that PLCβ and PLCδ couple to synergize Ca2+ responses by surface receptors.
The PLCβ family is activated by heterotrimeric G proteins, which respond to extracellular agonists such as hormones and neurotransmitters through transmembrane G protein-coupled receptors (see Ref. 3). All four known PLCβ (β1–4) are strongly activated by Gαq, and PLCβ2–3 are also activated by Gβγ subunits. Additionally, PLCβ2 is activated by members of the Rho family of small G proteins; most strongly by Rac1 (for review see Ref. 4). Rac1 is activated by the phosphoinositide 3-kinase pathway to initiate events leading to cytoskeletal rearrangements (5, 6).
Although PLCβ has well characterized protein regulators, protein regulators of PLCδ are less established. Unlike other PLC families, PLCδ enzymes are inactive at basal calcium concentrations but become active upon the rise in intracellular Ca2+ brought about by the activity of other PLCs. Two of the three reported PLCδ regulators, RhoA and transglutaminase, lower the amount of Ca2+ required for activation (7, 8). Recently, our laboratory discovered a third PLCδ regulator, PLCβ2 and -β3 (9). These enzymes were found to bind to PLCδ1 and inhibit its activity. Association between PLCβ2–3 and PLCδ1 can be disrupted by the addition of Gβγ subunits in solution, and preliminary studies in cultured cells suggest that the same association may occur in cells. These results suggested a model in which, upon release of Gβγ subunits after stimulation, PLCβ becomes activated by Gβγ subunits, and concomitantly activates PLCδ through a combination of increased level of Ca2+ and loss of inhibition by PLCβ2 and -β3.
To better understand the linkage between PLCδ and cell surface receptors, we have found that the pleckstrin homology (PH) domain of PLCβ2 and -β3 is responsible for binding and inhibition of PLCδ1 and have used this as a reagent to study the importance of PLCβ inhibition of PLCδ1 in cells. We first found that a significant population of PLCβ2 and PLCδ1 associate in cells. Stimulation by carbachol reduces the association of the plasma membrane-localized population, whereas microinjection of activated Rac1 reduces the association in the cytosolic population. Microinjection of the PH domain of PLCβ2 (PHβ2) resulted in a decrease in FRET between PLCβ2 and PLCδ1 suggesting that the interaction between these two proteins in cells is achieved through the PH domain. Moreover, microinjection of PHβ2 resulted in a greatly reduced Ca2+ release after stimulation with carbachol suggesting that the extent of a Ca2+ response is directly related to the level of unbound PLCδ1. These studies link PLCδ1 regulation to surface receptors and cytoskeletal movement through PLCβ2.
MATERIALS AND METHODS
In Vitro Studies
His6-PLCβ2 was expressed in Sf9 cells using a baculovirus system with minor modifications (see Ref. 10 for details about the expression and purification). His6 proteins PLCδ1, PHβ2, PHβ3, ΔPH-PLC1, and Rac1 were expressed in Escherichia coli and purified on a Ni2+ column using previously reported methods (see Refs. 9, 11–14). Expression and purity was assessed by Western blot analysis using commercial antibodies purchased from Santa Cruz Biochemicals, and by SDS-PAGE electrophoresis. PHβ2 C18S was prepared by the Molecular Cloning Facility at Stony Brook University.
PLC activity was assessed by measuring the hydrolysis of [3H]PI(4,5)P2 dispersed on sonicated phosphatidylserine:phosphatidylethanolamine:PI(4,5)P2 (2:1:0.5, v/v) membranes as described previously (15). Note that the assays are carried out at a total lipid concentration of 2 mm giving a large excess of PI(4,5)P2 substrate as compared with the nanomolar amount of protein. For the inhibition studies, we used the protein concentrations above the dissociation constant.
Protein association was measured by labeling one of the proteins by the addition of a 4:1 probe:protein molar ratio of the thiol-reactive probe 7-diethylamino-3-(4′-maleimidylphenyl)-4-methylcoumarin (CPM) in the absence of reducing agents (for details see Ref. 16). After labeling, a small amount of protein ranging in concentration from 1 to 20 nm was placed in a microcuvette and reconstituted on large unilamellar vesicles composed of PI(4,5)P2, palmitoyl oleoyl phosphatidylethanolamine and palmitoyl oleoyl phosphatidyl-serine prepared by extrusion through a 100-Å membrane according to the manufacturer's instructions (Avanti Biochemicals, Alabaster, AL). Protein association was assessed by plotting the increase in integrated intensity of CPM as the second protein was incrementally added and fitting the curve to a biomolecular association (see Ref. 17). Measurements were taken on an ISS PC1 spectrofluorometer using λ(ex) = 360 nm and scanning the fluorescence emission from λ(em) = 390–590 nm.
Cell Culture and Overexpression of PLCs
HEK293 cells were maintained in Dulbecco's modified Eagle's medium supplemented with 10% fetal bovine serum, 50 units/ml penicillin, and 50 μg/ml streptomycin sulfate at 37 °C in 5% CO2. For fluorescence studies, HEK293 cells were transfected with eYFP-PLCβ2 and eCFP-PLCδ1 vectors or eGFP-PLCδ1 vector (5–10 μg/106 cells in 60-mm dish) by calcium phosphate coprecipitation (9). The protein expression of endogenous PLCδ1 was knocked down using small interference RNA PLCδ1 (Dharmacon Inc.) according to the manufacturer's instructions along with the negative control purchased from the manufacturer. Western blot analysis showed this procedure produces ∼80% knock down.
Co-immunoprecipitation
HEK293 cells were lysed in buffer containing 1% Triton X-100, 0.1% SDS, 20 mm phenylmethylsulfonyl fluoride, 5 μg/ml leupeptin, 5 μg/ml apoprotein, 6 mm dithiothreitol, and 10 mm Tris, pH 7.4. 200 μg of soluble protein was incubated with 2 μl of PLCδ1 antibody overnight at 4 °C. After addition of 20 mg of protein A-Sepharose beads, the mixture was gently rotated for 4 h at 4 °C. Beads were washed three times with lysis buffer, and bound proteins were eluted with sample buffer for 5 min at 95 °C. Precipitated proteins were loaded onto 8% polyacrylamide gel. For purified protein co-immunoprecipitation instead of cell lysate the same amount PLCβ3 and PLCδ1 was added. After SDS-PAGE and transfer to polyvinylidene difluoride membranes, protein were detected by immunoblotting with anti-PLCβ3 (Santa Cruz Biotechnology, Santa Cruz, CA) antibody.
Imaging of Fluorescence in Living Cells
24 h after transfection, cells from 60-mm dishes were plated onto glass bottom culture dishes (MatTek). Images of fluorescent cells were collected 48–72 h after transfection on an Olympus Fluoview1000 confocal microscope equipped with a 40 × 1.4 numerical aperture oil immersion objective. Analysis of the FRET images was performed using standard routine incorporated into software provided for the Olympus microscope. The FRET analysis used in this report differs slightly from our previous analysis (e.g. Refs. 18, 19) where the efficiency, E, is calculated using Equation 1,
where ϵ is the fluorescence through the CFP channel, and nFRET is equal to the image obtained through the FRET channel minus the CFP and YFP bleedthrough (a and b, respectively), and in Equation 2,
rΨ is the ratio of the detector response of the CFP and YFP channels, and rQ is the ratio of the quantum yields of the CFP and YFP.
Microinjection Samples and Conditions
Transfected cells were grown in MatTek dishes for 48 h to achieve 50–60% confluence. Prior to microinjecting, the medium was changed to phenol-free Leibovitz L-15 medium. PHβ2 (50 nm) was microinjected with solution containing 0.2% deoxycholic acid, 20 mm Hepes, 150 mm NaCl, pH 7.2, and trace amounts of the red dye Cy5 (Invitrogen). The control solution did not contain PHβ2. Prior to microinjections, PHβ2 S18C was labeled with Alexa546, which served as a acceptor for GFP-PLCδ1.
Rac1 was activated using the procedure described in a previous study (13). Briefly, the sample was dialyzed against 20 mm Hepes, 150 mm NaCl, 1 mm dithiothreitol, pH 7.2, for 3 × 15 min at 4 °C, and then incubated with reaction buffer containing 50 mm HEPES (pH 8.0), 1 mm dithiothreitol, 2 mm EDTA, 0.1% Lubrol, and 1 μm GTPγS at 30 °C for 15 min. The reaction buffer was used as the control solution for microinjections.
Microinjections were performed on an Axiovert 200M from Zeiss using InjectMan NI2 with a FemtoJet pump from Eppendorf. Samples were microinjected into cytoplasm. We typically set the injection pressure Pi = 30 hPa and kept the compensation pressure (Pc) at 15 hPa. The injection time (t) was 0.4 s. Typically, we injected ∼10–25 cells within a 10- to 20-min period. We examined the microinjected cells under the phase microscope (Axiovert 200M from Zeiss with a 40× phase 2 objective) to select viable cells. Cells were then transferred to the Olympus Fluoview1000 for viewing, which was carried out within 2 h after microinjection.
Measurement of Cellular [Ca2+]i
For single cell Ca2+ measurements, cells were labeled with 1 μm Calcium Orange or Calcium Green (Invitrogen) for 45 min at room temperature, washed 3 times with Leibovitz L-15 medium, kept at room temperature in the dark without dye for 30 min, and then washed again three times with Leibovitz L-15 medium. The additional washes are required to remove dye that is nonspecifically bound to the plasma membrane. Cells were imaged on a Zeiss LSM510 laser scanning confocal microscope. Calcium Green was excited at 488 nm with an argon ion laser, Calcium Orange was excited with a 543 nm HeNe laser line, and the emission spectrum was recorded using a long pass 560 nm filter. Images were analyzed using Zeiss software. Images were collected every 20 s over a 5-min period. Data were analyzed by comparing the change in intensity of a selected cell or group of cells over the time period. This selection insures that dark pixels are not considered. Usually, five or six cells or cell groups were selected in each experiment.
RESULTS
The PH Domain of PLCβ2/3 Is Responsible for PLCδ Inhibition
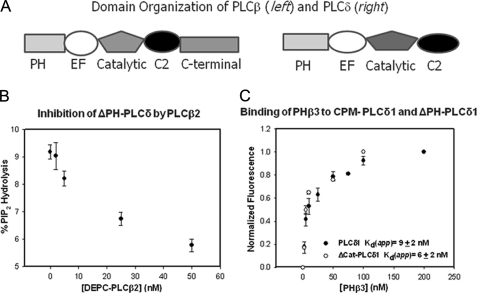
Before studying the regulation of PLCδ1 by PLCβ2 in cells, we set out to identify the region of PLCβ2 that is responsible for PLCδ1 inhibition with the goal of developing a reagent to inhibit association of the enzymes. Mammalian PLCs have a modular structure that are generally composed of an N-terminal PH domain followed by two EF hands, a catalytic domain, and a C2 domain (Fig. 1A). PLCβ enzymes have a distinct C-terminal region that is required for activation by Gαq subunits (see Refs. 2, 20). Several years ago, Nagano and coworkers demonstrated that the PH domain of an inactive variant of PLCδ4 could inhibit PLCδ4 activity (21). Therefore, we wondered whether the PH domain of PLCβ2 could be involved in PLCδ1 inhibition. Additionally, we have found that Gβγ, which makes a primary binding contact with the PH domain of PLCβ2 (11), disrupts PLCβ2·PLCδ1 association, also suggesting that association may occur through this region.
FIGURE 1.
A, domain organization of PLCβ and PLCδ enzymes. B, a graph illustrating the inhibition of PLCδ1 with PLCβ2. This experiment shows the decrease in the activity of 10 nm ΔPH-PLCδ1 with the addition of full-length PLCβ2 where the substrate, PI(4,5)P2, was dispersed in 20 mm sonicated vesicles composed of phosphatidylcholine:phosphatidylethanolamine:phosphatidylserine with 5% PIP(4,5)2. C, a graph illustrating the binding of PHβ3 to full-length CPM·PLCδ1 and CPM-ΔPH-PLCδ1, where association was assessed by the normalized change in fluorescence intensity, which averaged 18% for CPM·PLCδ1 and 11% for CPM-ΔPH-PLCδ1. For both sets of data, n = 3 and standard deviation is shown. A compilation of these data can be found in Table 1.
We measured the ability of the PH domains of PLCβ2 and -β3 to inhibit PLCδ1 and its isolated catalytic domain (Table 1). To compare the PH domains to the full-length enzymes, we inactivated PLCβ2 and PLCβ3 by covalently modifying the catalytic His residue with diethyl pyrocarbonate as in previous studies (9). Activity measurements were carried out at high PI(4,5)P2 levels to avoid competition between the two PLCs for substrate. Similar to our earlier work (9), we found that the full-length PLCβ enzymes are able to inhibit PLCδ by 40% (e.g. Fig. 1B). A similar inhibition was observed when we substituted the catalytic domain of PLCδ for the full-length enzyme. These data suggest that PLCδ inhibition is caused by contacts between PLCβ2 and the catalytic domain of PLCδ1 but not other PLCδ1 domains.
TABLE 1.
Binding and inhibition of PLCδ1 proteins by PLCβ proteins
Binding studies were carried out by adding unlabeled protein (listed leftmost), to CPM-labeled protein partner. CPM-labeled protein was prebound to 200 μm phosphatidylserine:phosphatidylcholine (2:1, v/v). Activity measurements were conducted as described under “Materials and Methods.” Mean values and standard deviations are given. Activity measurements were carried out using 2 nm PLCδ1 and 5 nM ΔPH-PLCδ1 and adding excess inactive (i.e. DEPC-treated) PLCβ2/β3 or PHβ2/β3 so that all of the proteins should be associated. The initial kcat of PLCδ1 under our experimental conditions was 140 ± 12 s−1 and 47 ± 10 s−1 for ΔPH-PLCδ1.
| Proteins | Apparent Kd | Inhibition |
|---|---|---|
| nm | % | |
| PLCβ2/PLCδ1 | 11.3 ± 2.1, n = 8 | 42 ± 4, n = 3 |
| PLCβ2/ΔPH-PLCδ1 | 16.8 ± 2.2, n = 3 | 29 ± 1, n = 6 |
| PHβ2/PLCδ1 | 1.7 ± 0.8, n = 3 | 25 ± 4, n = 9 |
| PHβ2/ΔPH-PLCδ1 | 11.1 ± 4.0, n = 3 | 0 |
| PLCβ3/PLCδ1 | 1.5 ± 0.3, n = 5 | 46 ± 5, n = 6 |
| PLCβ3/ΔPH-PLCδ1 | 6.0 ± 1.8, n = 3 | 28 ± 3, n = 3 |
| PHβ3/PLCδ1 | 9.4 ± 2.1, n = 3 | 34 ± 4, n = 3 |
| PHβ3/ΔPH-PLCδ1 | 6.4 ± 1.6, n = 5 | 0 |
| PHβ2/PHδ1 | No binding | |
| PHβ3/PHδ1 | No binding |
We then measured the inhibition of PLCδ1 by the PH domains of PLCβ2 and -β3. Although the amount of PLCδ1 inhibition by the PH domains was reduced as compared with the full-length enzyme (i.e. 25–30% see Table 1), it was still significant. We note that, unlike the full-length enzyme, the PH domains were unable to inhibit the isolated catalytic domain of PLCδ1. These results fit well with the idea that the PH domain of PLCδ1 plays an active role in regulating catalysis (see “Discussion”).
To determine whether differences in PLCδ1 inhibition by full-length PLCβ2/β3 and its PH domains are due to differences in their binding strength, we measured the affinity of the enzymes and their constructs using fluorescence spectroscopy. Specifically, we labeled one of the protein constructs with an environmentally sensitive fluorophore, CPM, and measured the changes in its fluorescence as the unlabeled binding partner was incrementally added (see Ref. 17). An example of a titration is shown in Fig. 1C, and the results are tabulated in Table 1. We found that the PH domains of PHβs and PHδ did not appear to interact while the other constructs all showed a strong and similar affinity whose apparent dissociation constants (Kd) ranged from 1.5 to 15 nm. The similarities in affinities suggest that binding occurs between the PH domains of PLCβ2/3 and the catalytic domain of PLCδ1. We note that, in general, PLCβ3 and its PH domain bound to PLCδ1 and ΔPH-PLCδ1 with a slightly stronger affinity than PLCβ2.
Rac1 Disrupts PLCβ2/β3 and PLCδ1 Association
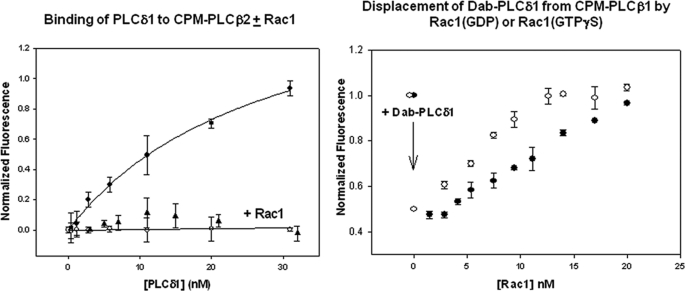
The structure of a large portion of PLCβ2, including the PH and catalytic domains, bound to activated Rac1 has been solved (22). This structure shows that Rac1 associates with the PH domain of PLCβ2. Thus, if PLCβ2 associates with PLCδ1 through its PH domain, then addition of Rac1 would be expected to disrupt that association. We measured the binding between PLCβ2 and PLCδ1, and between PHβ2 and PLCδ1 in the absence and presence of Rac1(GDP) and Rac1(GTPγS). We found that, even in the deactivated form, Rac1 inhibited association between the enzymes (Fig. 2left).
FIGURE 2.
Left, binding of PLCδ1 to CPM·PLCβ2 in the absence (●) and presence (▴) of 5 nm Rac1 (GTPγS) or 10 nm Rac1 (GDP) (○), n = 4, where the total change in CPM fluorescence ranged from 40 to 80% in each of the studies. Right, disruption of PLCβ2·PLCδ1 complexes by Rac1. Here, Dab-PLCδ1 was added to CPM·PLCβ2 so that 50% of the FRET complex was formed as indicated by the arrow and shown by the loss in CPM donor fluorescence to the non-fluorescent Dab acceptor. Afterward, either activated (○) or deactivated (●) Rac1 was added until the full, dissociated CPM·PLCβ2 fluorescence intensity was recovered.
In a separate study, we added Dabcyl-Cl-labeled PLCδ1 to a solution of CPM·PLCβ2. Dabcyl is a non-fluorescent FRET acceptor, and a loss in CPM fluorescence has been observed due to transfer of CPM emission to this non-fluorescent probe (see Ref. 17). We added Dab-PLCδ1 to CPM·PLCβ2 at a concentration so that 50% of the proteins were associated. We then measured the ability of deactivated and activated Rac1 to disrupt the PLCβ2·PLCδ1 complex. We found that activated Rac1 was better able to dissociate the two PLCs (Fig. 2, right). These results support the idea that the PH domain of PLCβ2 is responsible for interaction with PLCδ1.
Association between PLCβ2 and PLCδ1 in Cells
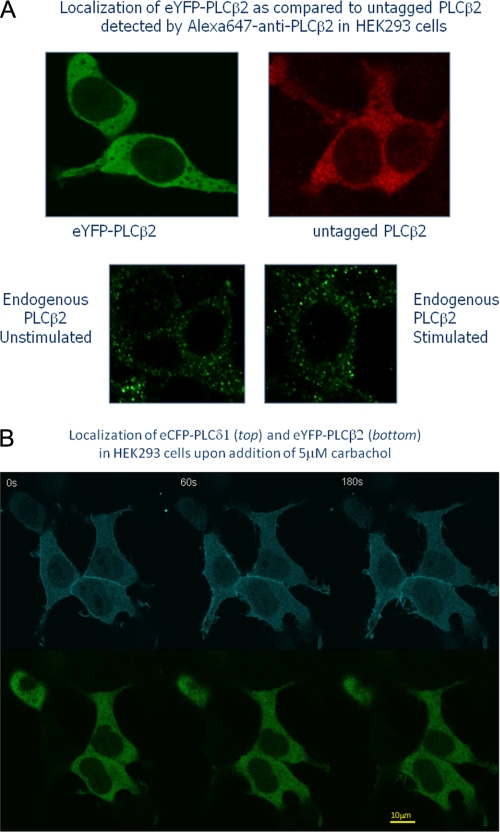
We studied the association between PLCβ2 and PLCδ1 in HEK293 cells by co-transfecting the cells with fluorescence-tagged chimers. It has been previously shown that GFP tags on the C terminus of PLCδ1 do not affect its cellular localization (22). In Fig. 3A we compare the localization of untagged and eYFP-tagged PLCβ2 expressed in HEK293 cells where the untagged protein was detected by immunofluorescence. We also present images of endogenous PLCβ2, which is expressed at low levels in these cells. These results suggest that the eYFP tag does not affect cellular localization of PLCβ2. Western blot analysis of untagged and eYFP-PLCβ2 from the soluble and membrane fractions of HEK293 cells gave identical results (data not shown).
FIGURE 3.
Top four panels, the eYFP tag on PLCβ2 does not affect its cellular localization. The upper left panel shows HEK293 cells expressing eYFP-PLCβ2 and the upper right panel shows cells expressing untagged PLCβ2 as detected by immunostaining with Alexa647-anti-PLCβ2. The middle panels show the low amount of endogenous PLCβ2 in HEK293 cells under basal and stimulated conditions (5 μm carbachol) in fixed cells as detected using Alex647-anti-PLCβ2. Bottom, changes in the localization of eCFP-PLCδ1 (top panels) and eYFP-PLCβ2 (bottom panels) expressed in HEK293 cells with 5 μm carbachol stimulation. Although some movement of eCFP-PLCδ1 toward the plasma membrane occurs in a time-dependent manner, eYFP-PLCβ2 remains cytosolic. All images were viewed through a 60× objective (see “Materials and Methods”).
Expression of eCFP-PLCδ1 in HEK293 cells showed the enzyme to be widely dispersed with a distinct plasma membrane localization as well as populations in the cytosol and nucleus (Fig. 3, top). This distribution has been previously observed (23, 24). Similar to previous reports (23), stimulation of the cells with carbachol caused translocation of a population of the enzyme to edges of the cell. In contrast, eYFP-PLCβ2 was almost entirely cytosolic without a distinct plasma membrane component and no nuclear localization (Fig. 3, bottom). Unlike PLCδ1, stimulation of the cells with carbachol did not significantly change localization of overexpressed or endogenous PLCβ2 (Fig. 3, top and middle panels).
We have previously found that PLCβ2 and PLCδ1 associate in cells using biomolecular fluorescence complementation (see Ref. 9). In this method, two portions of eYFP are attached to potential protein partners, and association of these partners reconstitutes the eYFP generating a fluorescent signal. However, this method only detects associated proteins, and non-associated proteins are optically silent. Therefore, we used FRET, which detects the fluorescence of the individual proteins as well as the amount of energy transfer from the associated species (25). This method allows us to identify regions of the cell where both the unassociated and associated enzymes are localized.
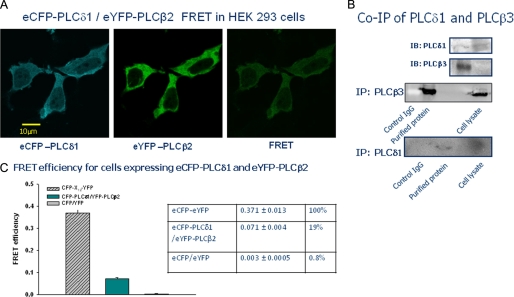
We transfected HEK293 cells with eYFP-PLCβ2 and CFP-PLCδ1, viewed the localization of the fluorescent proteins, and measured the degree of FRET in the localized areas (Fig. 4A), where all of the FRET data presented are corrected for bleedthrough and the small amount of photobleaching (<5%) that is sometimes observed (see “Materials and Methods”). Keeping in mind that the eYFP label is on the N terminus of PLCβ2 and the eCFP label is on the C terminus of PLCδ1, and that association is through the PHβ2, then a crude estimate of the distance between the two probes is <∼100 Å when the enzymes are associated. The Ro, or the distance in which 50% of light is lost to FRET, is ∼50 Å for this pair of fluorophores (26). Thus, the presence of FRET observed should be directly related to the physical association between the two enzymes. Using a positive control where eCFP and eYFP are attached through a dodecapeptide flexible linker, and a negative control consisting of free eCFP and free eYFP, we found that ∼20% of the enzymes in the cytosol were associated as estimated by FRET (Fig. 4C). We supported this result by co-immunoprecipitation studies of endogenous PLCδ1 and PLCβ3, which is expressed at a higher level than PLCβ2 in these cells allowing for more accurate detection (Fig. 4B). These studies support the idea that PLCβ and PLCδ associate in cells.
FIGURE 4.
Association of PLCδ1 and PLCβ2 in HEK293 cells. A, HEK293 cells co-transfected with eCFP-PLCδ1 and eYFP-PLCβ2 and imaged through the CFP filter, the YFP filter, and the FRET filter, which filters CFP exciting wavelengths and YFP-emitting wavelengths. The FRET image shown is corrected for bleedthrough from the CFP and YFP channels. B, co-immunoprecipitation of PLCβ3 as pulled down with PLCδ1. C, bar graph and corresponding table showing the FRET values from an eCFP-X-eYFP-positive control (n = 19), the eCFP-PLCδ1/eYFP-PLCβ2 sample (n = 22), and free eCFP- and free eYFP-negative control (n = 5).
Changes in PLCβ2-PLCδ1 Association with Stimulation
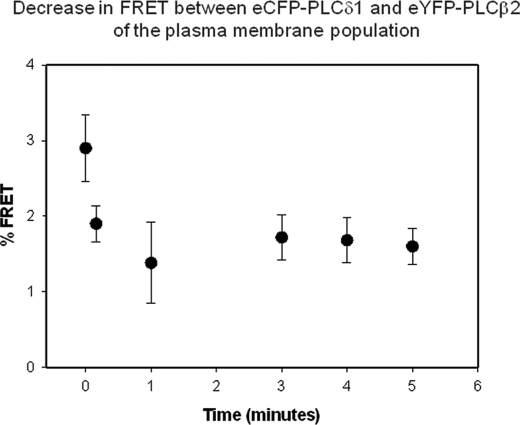
We determined whether stimulation would affect the association of the two enzymes. We first monitored the amount of FRET between eYFP-PLCβ2 and CFP-PLCδ1 when we activated muscarinic acid receptors by the addition of carbachol. Although carbachol stimulation did not significantly change the amount of FRET in the cytosol, we found that it reduced the amount of FRET from the small plasma membrane fraction in a time-dependent manner supporting the observation that released Gβγ subunits can dissociate the complexes (Fig. 5). We interpret the residual FRET as due to the inability to generate enough Gβγ subunits to completely disrupt the complexes.
FIGURE 5.
Decrease in FRET between eCFP-PLCδ1 and eYFP-PLCβ2 in the plasma membrane region of HEK293 cells with the addition of 5 μm carbachol. These data were generated by selecting the region of interest around the plasma membrane and averaging the FRET over five cells (±S.D. is shown).
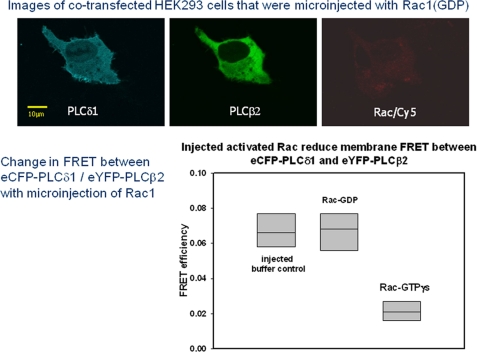
We then tested whether another activator of PLCβ2, the small GTPase, Rac1, disrupts the association between the two PLCs. To this end, we monitored the amount of FRET between eYFP-PLCβ2 and CFP-PLCδ1 when activated Rac1 was microinjected into the cells. We identified microinjected cells by including trace amounts of the red dye Cy5, which will not interfere with the absorption or fluorescence of the eCFP or eYFP probes, into the microinjection solution (Fig. 6, top). We found that microinjection of activated Rac1 abolishes FRET between the two PLCs (Fig. 6, bottom). Identical studies that substitute buffer or deactivated Rac1 did not affect the FRET (Fig. 6, bottom).
FIGURE 6.
Change in FRET between eCFP-PLCδ1 and eYFP-PLCβ2 in HEK293 cells with microinjection of Rac1. Top, images a cell showing expression of eCFP-PLCδ1 (left), eYFP-PLCβ2 (middle) that has been microinjected with Rac1(GDP) as seen by the fluorescence of the Cy5 tracer dye (right). Note that, although two cells in the image were microinjected, only one shows fluorescent PLC expression. Bottom, compilation of data showing a lack of change in eCFP-PLCδ1/eYFP-PLCβ2 FRET with microinjection of buffer or Rac1(GDP) but a loss in FRET with microinjection of Rac1(GTPγS). In the plot shown, the boxes contain 25 and 75% of the data, whereas the vertical line shows 5 and 95% of the data. The points are the absolute high and absolute low points. The line in the box is the median of the data, where n = 7–12.
Association of PHβ2 to PLCδ1 Diminishes the Ca2+ Response to Stimulation
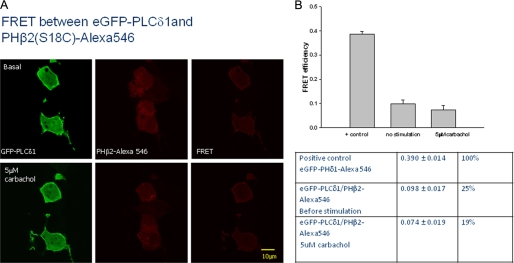
Because we found that PHβ2 is the main region of interaction between PLCβ2 and PLCδ1, we used this domain as a reagent to determine whether the associated enzymes in the cytosol contribute to Ca2+ release with carbachol stimulation. To carry out these studies, we introduced a Cys residue into PHβ2 (C18A) on an external site, which allowed us to specifically label the domain with Alexa546. We then monitored FRET from GFP-PLCδ1 donors to microinjected Alexa546-PHβ acceptors (Fig. 7). As with the full-length proteins, FRET was localized in the cytosol (Fig. 7A). The FRET value obtained for this combination is within error of the value seen for the full-length proteins supporting the idea that a significant fraction of PLCβ2 and PLCδ1 are associated (Fig. 7B).
FIGURE 7.
Demonstration of FRET between eGFP-PLCδ1 expressed in HEK293 cells and microinjected PHβ2(S18C)-Alexa546. A, images showing cells expressing eGFP-PLCδ1 (left panels) that were microinjected with PHβ2(S18C)-Alexa546 (middle panels). The right panels are the FRET images corrected for GFP and Alexa546 bleedthrough. The bottom panels show the cells 60 s after addition of 5 μm carbachol suggesting a lack of movement of the PHβ2 domain with stimulation and a lack of significant changes in FRET. B, compilation of values in the bar graph and table form where n = 5 and ±S.D. is shown.
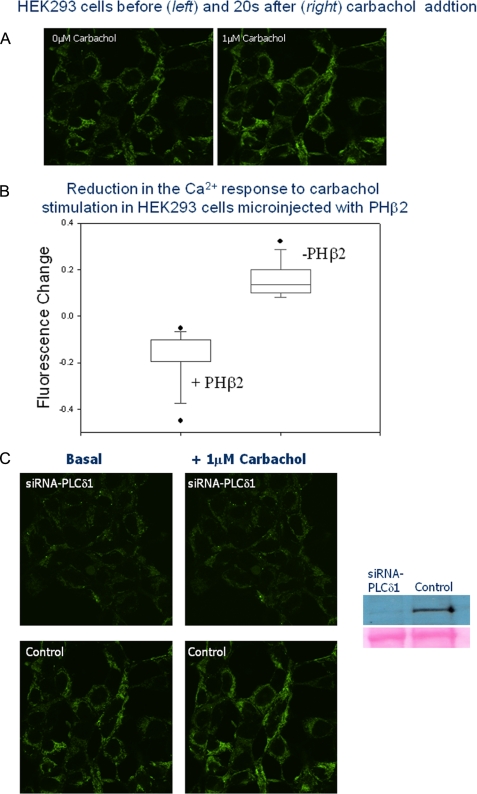
Because PHβ2 binds to PLCδ1 and inhibits its activity, we tested whether this association could quench Ca2+ signals generated with carbachol stimulation. We microinjected unlabeled PHβ2 into untransfected HEK293 cells treated with a Ca2+ indicator and measured the amount of Ca2+ released upon carbachol stimulation at 20 s. Our control studies showed a lack of Ca2+ response with epidermal growth factor stimulation (see Ref. 27). We note that PHβ2 does not specifically bind to PI(4,5)P2 or Ins(1,4,5)P3 and should not interfere with substrate or product binding of PLCδ1 (11). We found a statistically significant reduction in the amount of released Ca2+ in the microinjected cells as compared with non-injected cells, and to cells that were microinjected only with microinjection buffer (Fig. 8, A and B). This result correlates well with our observation that PLCδ1 small interference RNA treatment, which results in ∼80% reducing in the level of protein, abolishes a significant calcium response as detected by calcium green (Fig. 8C). These results suggest that the amount of Ca2+ released is directly related to the amount of free PLCδ1.
FIGURE 8.
A, example of the change in Calcium Green intensity of a HEK293 cells 20 s after stimulation. B, the response of untransfected HEK293 cells that were either not microinjected (n = 12) or microinjected only with tracer dye (Cy5) in buffer (n = 5) (these data were indistinguishable), as compared with cells that were microinjected with unlabeled PHβ2 and Cy5 tracer (n = 13). C, small interference RNA-PLCδ1 treatment of HEK293 cells results in an approximate 80% reduction of endogenous PLCδ1 as seen by Western blotting, and elimination of a significant response of Calcium Green intensity to 1 μm carbachol where cells were imaged 10 s after stimulation.
The lack of Ca2+ response with microinjected PHβ2 could be a result of it binding to its Gβγ subunits, which would prevent PLCβ2 activation and leave the basal level of Ca2+ below the threshold needed for PLCδ1 activity. Although this possibility is unlikely given the cytosolic localization of PHβ2 as opposed the plasma membrane-localized Gβγ, we microinjected Alexa546-PHβ2 into cells expressing eGFP-Gβγ subunits. We could not detect FRET between these two proteins, but this did not exclude the possibility that microinjected PHβ2 binds to Gβγ subunits.
DISCUSSION
The regulation of calcium signals in cells involves a complex series of events that are mediated by PLC activity. PLCδ1 is activated by the rise in intracellular Ca2+ generated by other PLCs in response to signaling events, such as G protein activation and receptor tyrosine kinase activation, and can be thought of as a Ca2+ signal amplifier. The PLCδ effectors, RhoA and transglutaminase, reduce the levels of Ca2+ needed to activate PLCδ (7, 8). We have previously uncovered a novel regulator of PLCδ1, namely PLCβ2 (9). PLCβ2 inhibits PLCδ1, and this inhibition is reversed when Gβγ displaces PLCβ2 from PLCδ1. This mechanism of regulation directly connects PLCδ1 activity to surface receptors. In this study, we connect PLCδ1 activity with Rac1 activation of PLCβ2.
Our experiments show that the PH domains of PLCβ2 and -β3 are responsible for binding and inhibition of PLCδ1. This novel function of the PHβ domains adds to the two established roles that PHβ plays: anchoring the host enzyme to the surface of membranes and docking the host enzyme to Gβγ and to RhoGTPase proteins (11, 28). Here, we found that the PH domain of PLCδ1 does not participate in the association with PLCβ2, suggesting that its functional role is solely to bind PI(4,5)P2 and Ins(1,4,5)P3 (12) thereby promoting membrane association and dissociation, respectively, of the host enzyme (see below). Although we followed the association of full-length PLCs and their PH domains bound to a model membrane, we have previously shown that these proteins will associate in the absence of membranes but with a reduced affinity (9, 29).
It is well established that activation of PLCδ1 occurs through specific binding to PI(4,5)P2 on the membrane surface (12). Not only does the PH domain anchor the enzyme to the membrane surface allowing it to access substrate, but this interaction has been suggested to reorient the catalytic site with respect to the membrane surface to allow more effective product release. Activation of PLCβ2 is thought to occur by a similar mechanism in which the binding of Gβγ to the PH domain mediates changes in membrane orientation of the catalytic domain (see Refs. 16, 30).3 Interestingly, the PH domains of PLCβ2 and PLCδ1 can be swapped to produce chimeric enzymes that are activated by either PI(4,5)P2 or Gβγ subunits (31, 32). Because activation occurs through interdomain movement between the PH and catalytic domains, then it is possible that PHβ2 binds to an auxiliary site on the PLCδ1 catalytic domain that contacts its own PH domain and the catalytic domains upon enzyme activation.
Our previous studies indicated that PLCβ2 almost completely inhibited PLCδ1 activity toward PI (9). Here we observed a 40% inhibition under assay conditions that employ a large excess of PI(4,5)P2. This difference in inhibition can be traced to the weak binding of PI by PHδ1, which does not allow enzyme activation through interdomain movement, versus excess PI(4,5)P2 where interdomain PLCδ1 movement is operative. The observation that the PHβ2/3 constructs cannot inhibit ΔPH-PLCδ1, which cannot be activated by its own PH domain, supports the idea that PLCβ2 and -β3 are inhibiting the interdomain movement needed for full PLCδ1 activity.
Our in vitro studies suggest that PLCβ3 interacts with PLCδ1 with a somewhat stronger affinity than PLCβ2. PLCβ2 is expressed at low levels in many cell lines but is highly expressed in cells of hematopoietic origin (33). In contrast, tissue expression of PLCβ3 is more ubiquitous and follows PLCδ1 expression more closely (34, 35). We focused our studies on PLCβ2, because it is not well expressed in HEK293 cells to minimize the detrimental effects of its overexpression. The regulation of PLCδ1 though PLCβ2 and -β3 is expected to have a range of importance that depends on the tissue type.
We found that PLCβ2 and PLCδ1 are mainly cytosolic in HEK293 cells despite evidence that the majority of PI(4,5)P2, their major substrate, is found on the plasma membrane. We note that the cells were in media containing serum until viewing thereby maintaining basal level activity. The localization pattern we observed here for PLCδ1 is similar to that observed by Rebecchi and coworkers (23). These authors found both active PLCδ1 and a catalytically inactive mutant localized to the cytosol with significant concentration in membrane ruffles, and in the nucleus where it plays a critical role in cell cycle progression (24). Our images suggest that PLCβ2 does not localize to the nucleus.
We previously found that the majority of PLCβ1 is localized on the plasma membrane of PC12 and HEK293 cells where it is complexed with Gαq (18). In sharp contrast, very little PLCβ2 localizes to the plasma membrane. Instead, PLCβ2 is found predominantly in the cytosol. Previous studies of GFP-PLCβ2 expressed in COS cells show that it is also cytosolic, but a small portion localizes to the plasma membrane when co-expressed with membrane-bound Rac2(12V) (36). Surprisingly, we found that PLCβ2 remains in the cytosol even when the cells are stimulated with carbachol to activate Gαq and Gβγ. Although the lack of movement of PLCβ2 to the membrane may be due to a number of experimental factors, such as expression level, cell type, etc., it could suggest that PLCβ2 is activated by G protein subunits that internalize in early endosomes after receptor activation. Although we and others found that Gαq and Gβγ remain on the plasma membrane after stimulation (37, 38), Gβγ subunits released by Gαs have been shown to internalize (39).
A second and more plausible explanation for the cytosolic localization of PLCβ2 is that the enzyme is functionally important in this compartment. Our studies suggest that a significant fraction of cytosolic PLCδ1 is associated with PLCβ2. Specifically, we found that the amount of FRET between the two PLCs is ∼20% of the positive control and approximately half the amount seen when similar FRET studies are carried out using eCFP/eYFP-tagged G proteins subunits. Because the labels on the proteins are at opposite termini, we cannot exclude the possibility that most of the proteins are associated, but the fluorophores are too far apart to engage in FRET. We can only be certain that at least 20% of PLCδ1 population is associated to PLCβ2 suggesting that the remaining populations are either free or have other interacting partners. Support for this association comes from co-immunoprecipitation studies.
We also found that PLCβ2·PLCδ1 association is disrupted by activated Rac1 (for review see Ref. 4). Rac1 integrates diverse signals that can involve integrins, stress factors, cytokines, as well as growth, and neurotropic agents, and its activation is associated with lamellipodia formation. It is plausible that the cytosolic PLCs are distributed on intracellular membranes and associated with actin structures via Rac1. Thus, cytosolic Rac1 has the potential to be a more important cellular regulator of PLCβ2 than G protein subunits. It is possible then that the cytosolic PLCs regulate the amount of PI(4,5)P2 available for cytoskeletal proteins such as cofilin and actin.
PLCβ2 is most sensitive to Rac1 but can be activated by other members of this family (see Ref. 4). In contrast, PLCδ1 is inhibited by RhoA (40) suggesting that its regulation by PLCβ2 might be synergistic with release of RhoA. It is interesting to note that the PLCϵ enzymes are regulated by RasGTPases (41), and their potential regulation of PLCδ1 has not been determined.
Previously, we used bimolecular fluorescence complementation to show that PLCβ2 and PLCδ1 can associate in cells (9). Although this method only detects associated species, we note that the localization of the bimolecular fluorescence complementation fluorescence is identical to the localization of FRET, which should be the case. We had observed a reduction in bimolecular fluorescence complementation when we focused on the bottom plasma membrane upon carbachol stimulation. In parallel, we find a decrease in the FRET from the plasma membrane fraction with stimulation. Based on our previous studies, we interpret this decrease as being due to the displacement of plasma-membrane localized PLCβ2 from PLCδ1 by Gβγ subunits released during stimulation.
We used the PH domain of PLCβ2 as a reagent that should allow us to isolate the importance of PLCβ inhibition of PLCδ1 activity in cells. This reagent remained in the cytosol after microinjection where it bound to PLCδ1. (We note that microinjection of this regent also appeared to reduce eCFP-PLCδ1/eYFP-PLCβ2 FRET, but the sampling population for this study is small, because these experiments were technically challenging.) The association between PHβ2 and PLCδ1 does not change with carbachol stimulation as expected from the observation that only the plasma membrane population of the associated PLCs is affected by stimulation. Interestingly, we found that association of PHβ2 and PLCδ1 in the cytosol inhibits the release of Ca2+ (Fig. 8). This inhibition is not due to binding of PHβ2 to substrate, because we have found the PHβ2 does not bind specifically to PI(4,5)P2 (11). Inhibition of Ca2+ release may be due to the inability of Gβγ to activate PLCβ2, because the microinjected PHβ2 bound to the G protein. A lack of PLCβ2 activation in turn may not allow the cellular Ca2+ concentration to rise high enough to activate PLCδ1. We tested this possibility by measuring FRET between PHβ2 and Gβγ subunits, but no FRET could be detected. Thus, we conclude that PHβ2 is quenching PLCδ1 activity to a low enough level that second messengers cannot be generated. Thus, the amount of Ca2+ generated may be proportional to the amount of unbound PLCδ1.
It is notable that PHβ2 significantly reduced the amount of released Ca2+, even though our in vitro assays only show an inhibition of ∼25% for PLCδ1 rather than 40% for the full-length enzyme. This seeming discrepancy may be due to one or a combination of possible reasons. The first is technical. As shown in Fig. 8, there is considerable spread in the single cell calcium measurements, and so the effect of microinjected PHβ2 on calcium release may be in the lower range of the data. Also, the integrity of PHβ2 might have diminished in the labeling and microinjection steps. It is also possible that the degree of inhibition varies with the membrane surface. As noted, PLCδ1 is activated by specific binding of the PH domain to PI(4,5)P2, and our inhibition assays are carried out using excess PI(4,5)P2. As discussed above, PHβ2 appears to inhibit PI(4,5)P2-induced interdomain movement that allows for PLCδ1 activation. Therefore, a large excess of PI(4,5)P2 would effectively compete with PHβ2 inhibition. In contrast, in a cellular setting where the relative concentration of PI(4,5)P2 is very low, then PHβ2 inhibitory interactions could dominate.
The most likely reason for the apparent enhanced inhibition of PLCδ1 by PHβ2 in cells stems from the requirement of PLCδ1 for calcium. After a lag concentration, PLCδ1 follows an exponential activation curve with Ca2+ concentration, and inhibition of a significant population PLCδ1 may not generate enough Ca2+ to result in activation of the entire cellular PLCδ1 population. Thus, the microinjected PHβ2 can effectively keep Ca2+ levels below the threshold needed to activate PLCδ1.
The results here suggest that PLCβ2 may function to keep PLCδ1 inhibited in the basal state. The strong affinity and the degree of FRET suggest association between the two enzymes, which in turn serves to keep a significant population of PLCδ1 inhibited. Because PLCδ1 has very low activity at basal Ca2+, then the combination of a loss of PLCβ2 inhibition and the increased Ca2+ provide large scale PLCδ1 activation.
Acknowledgment
We are grateful to Mario Rebecchi for helpful discussions.
This work was supported, in whole or in part, by National Institutes of Health Grant GM053132.
D. Han, U. Golebiewska, S. Stolzenberg, S. Scaelata, and H. Weinstein, submitted for publication.
- PLC
- phospholipase C
- PI(4,5)P2
- phosphatidylinositol 4,5-bisphosphate
- PH
- pleckstrin homology
- CPM
- 7-diethylamino-3-(4′-maleimidylphenyl)-4-methylcoumarin
- eCFP
- enhanced cyan fluorescent protein
- eYFP
- enhanced yellow fluorescent protein
- eGFP
- enhanced green fluorescent protein
- GTPγS
- guanosine 5′-3-O-(thio)triphosphate
- Ins(1,4,5)P3
- inositol 1,4,5-trisphosphate
- PI
- phosphatidylinositol
- FRET
- Förster resonance energy transfer.
REFERENCES
- 1.Suh P. G., Park J. I., Manzoli L., Cocco L., Peak J. C., Katan M., Fukami K., Kataoka T., Yun S., Ryu S. H. (2008) BMB Rep. 41, 415–434 [DOI] [PubMed] [Google Scholar]
- 2.Rebecchi M. J., Pentyala S. N. (2000) Physiol. Rev. 80, 1291–1335 [DOI] [PubMed] [Google Scholar]
- 3.Exton J. H. (1996) Annu. Rev. Pharmacol. Toxicol. 36, 481–509 [DOI] [PubMed] [Google Scholar]
- 4.Harden T. K., Sondek J. (2006) Annu. Rev. Pharmacol. Toxicol. 26, 355–379 [DOI] [PubMed] [Google Scholar]
- 5.Nobes C. D., Hall A. (1995) Cell 81, 53–62 [DOI] [PubMed] [Google Scholar]
- 6.Allen W. E., Jones G. E., Pollard J. W., Ridley A. J. (1997) J. Cell Sci. 110, 707–720 [DOI] [PubMed] [Google Scholar]
- 7.Homma Y., Emori Y. (1995) EMBO J. 14, 286–291 [DOI] [PMC free article] [PubMed] [Google Scholar]
- 8.Im M. J., Russell M. A., Feng J. F. (1997) Cell. Signal. 9, 477–482 [DOI] [PubMed] [Google Scholar]
- 9.Guo Y., Rebecchi M., Scarlata S. (2005) J. Biol. Chem. 280, 1438–1447 [DOI] [PubMed] [Google Scholar]
- 10.Ghosh M., Wang H., Kelley G. G., Smrcka A. V. (2004) Methods Mol. Biol. 237, 55–64 [DOI] [PubMed] [Google Scholar]
- 11.Wang T., Pentyala S., Rebecchi M. J., Scarlata S. (1999) Biochemistry 38, 1517–1524 [DOI] [PubMed] [Google Scholar]
- 12.Garcia P., Gupta R., Shah S., Morris A. J., Rudge S. A., Scarlata S., Petrova V., McLaughlin S., Rebecchi M. J. (1995) Biochemistry 34, 16228–16234 [DOI] [PubMed] [Google Scholar]
- 13.Knaus U. G., Heyworth P. G., Kinsella B. T., Curnutte J. T., Bokoch G. M. (1992) J. Biol. Chem. 267, 23575–23582 [PubMed] [Google Scholar]
- 14.Benard V., Bohl B. P., Bokoch G. M. (1999) J. Biol. Chem. 274, 13198–13204 [DOI] [PubMed] [Google Scholar]
- 15.Runnels L. W., Jenco J., Morris A., Scarlata S. (1996) Biochemistry 35, 16824–16832 [DOI] [PubMed] [Google Scholar]
- 16.Drin G., Douguet D., Scarlata S. (2006) Biochemistry 45, 5712–5724 [DOI] [PMC free article] [PubMed] [Google Scholar]
- 17.Philip F., Scarlata S. (2006) Sci. STKE 2006, pl5. [DOI] [PubMed] [Google Scholar]
- 18.Dowal L., Provitera P., Scarlata S. (2006) J. Biol. Chem. 281, 23999–24014 [DOI] [PubMed] [Google Scholar]
- 19.Golebiewska U., Scarlata S. (2008) Biophys. J. 95, 2575–2582 [DOI] [PMC free article] [PubMed] [Google Scholar]
- 20.Rhee S. G. (2001) Annu. Rev. Biochem. 70, 281–312 [DOI] [PMC free article] [PubMed] [Google Scholar]
- 21.Nagano K., Fukami K., Minagawa T., Watanabe Y., Ozaki C., Takenawa T. (1999) J. Biol. Chem. 274, 2872–2879 [DOI] [PubMed] [Google Scholar]
- 22.Jezyk M. R., Snyder J. T., Gershberg S., Worthylake D. K., Harden T. K., Sondek J. (2006) Nat. Struct. Mol. Biol. 13, 1135–1140 [DOI] [PubMed] [Google Scholar]
- 23.Tall E. G., Spector I., Pentyala S. N., Bitter I., Rebecchi M. J. (2000) Curr. Biol. 10, 743–746 [DOI] [PubMed] [Google Scholar]
- 24.Stallings J. D., Tall E. G., Pentyala S., Rebecchi M. J. (2005) J. Biol. Chem. 280, 22060–22069 [DOI] [PubMed] [Google Scholar]
- 25.van der Meer W., Coker G., Chen S. S.-Y. (1994) Resonance Energy Transfer, Theory and Data, VCH Publishers, Inc., New York [Google Scholar]
- 26.Patterson G. H., Piston D. W., Barisas B. G. (2000) Anal. Biochem. 284, 438–440 [DOI] [PubMed] [Google Scholar]
- 27.Schmidt M., Frings M., Mono M. L., Guo Y., Weernink P. A., Evellin S., Han L., Jakobs K. H. (2000) J. Biol. Chem. 275, 32603–32610 [DOI] [PubMed] [Google Scholar]
- 28.Snyder J. T., Singer A. U., Wing M. R., Harden T. K., Sondek J. (2003) J. Biol. Chem. 278, 21099–21104 [DOI] [PubMed] [Google Scholar]
- 29.Scarlata S. (2002) Methods Enzymol. 345, 306–327 [DOI] [PubMed] [Google Scholar]
- 30.Drin G., Scarlata S. (2007) Cell. Signal. 19, 1383–1392 [DOI] [PMC free article] [PubMed] [Google Scholar]
- 31.Wang T., Dowal L., El-Maghrabi M. R., Rebecchi M., Scarlata S. (2000) J. Biol. Chem. 275, 7466–7469 [DOI] [PubMed] [Google Scholar]
- 32.Guo Y., Philip F., Scarlata S. (2003) J. Biol. Chem. 278, 29995–30004 [DOI] [PubMed] [Google Scholar]
- 33.Lee S. B., Rao A. K., Lee K. H., Yang X., Bae Y. S., Rhee S. G. (1996) Blood 88, 1684–1691 [PubMed] [Google Scholar]
- 34.Jhon D. Y., Lee H. H., Park D., Lee C. W., Lee K. H., Yoo O. J., Rhee S. G. (1993) J. Biol. Chem. 268, 6654–6661 [PubMed] [Google Scholar]
- 35.Homma Y., Takenawa T., Emori Y., Sorimachi H., Suzuki K. (1989) Biochem. Biophys. Res. Commun. 164, 406–412 [DOI] [PubMed] [Google Scholar]
- 36.Illenberger D., Walliser C., Strobel J., Gutman O., Niv H., Gaidzik V., Kloog Y., Gierschik P., Henis Y. I. (2003) J. Biol. Chem. 278, 8645–8652 [DOI] [PubMed] [Google Scholar]
- 37.Philip F., Sengupta P., Scarlata S. (2007) J. Biol. Chem. 282, 19203–19216 [DOI] [PubMed] [Google Scholar]
- 38.Hughes T. E., Zhang H., Logothetis D. E., Berlot C. H. (2001) J. Biol. Chem. 276, 4227–4235 [DOI] [PubMed] [Google Scholar]
- 39.Hynes T. R., Mervine S. M., Yost E. A., Sabo J. L., Berlot C. H. (2004) J. Biol. Chem. 279, 44101–44112 [DOI] [PubMed] [Google Scholar]
- 40.Hodson E. A., Ashley C. C., Hughes A. D., Lymn J. S. (1998) Biochim. Biophys. Acta 1403, 97–101 [DOI] [PubMed] [Google Scholar]
- 41.Kelley G. G., Reks S. E., Ondrako J. M., Smrcka A. V. (2001) EMBO J. 20, 743–754 [DOI] [PMC free article] [PubMed] [Google Scholar]


