Abstract
An extensive investigation of the transport properties of aqueous acid solutions was undertaken. The acids studied were trifluoromethanesulfonic (CF3SO3H), bis(trifluoromethanesulfonyl)imide ((CF3SO2)2NH), and para-toluenesulfonic (CH3C6H4SO3H), of which the first two are considered superacids. NMR measurements of self-diffusion coefficients (D), spin-lattice relaxation times (T1), and chemical shifts, in addition to ionic conductivity (σ), viscosity (η), and density measurements were performed at 30°C over the concentration range of 2 – 112 water to acid molecules. Results showed broad maxima in σ for all three acids in the concentration range of 12 – 20 water to acid molecules. This coincided with minima in anion D's, and is attributed to a local molecular ordering, reduced solution dielectric permittivity and increased ionic interactions. The location of the maxima in σ correlates with what is observed for hydrated sulfonated perfluoropolymers such as Nafion, which gives a maximum in ionic transport when the ratio of water to acid molecules is about 15 – 20. Of the three acids, bis(trifluoromethanesulfonyl)imide was found to be the least dependent on hydration level. The occurrence of the anti-correlation between the ionic conductivity maximum and anion self-diffusion minimum supports excess proton mobility in this region and may offer additional information on the strength of hydrogen bonding in aqueous media as well as on the role of high acid concentration in the Grotthuss proton transport mechanism.
Keywords: proton conduction mechanism, superacids, trifluoromethanesulfonic acid bis(trifluoromethanesulfonyl)imide acid, para-toluenesulfonic acid, NMR diffusion
Introduction
The study of the transport properties of ion conduction membranes for use in electrochemical devices such as fuel cells has been a significant focus area for research over the last few decades. This is driven by both practical and scientific considerations: the ionic conductivity of the electrolyte and its impact on device efficiency is of tremendous practical importance, while the behavior of ions and solvent in confined spaces such as ‘pores’ or ‘channels’ is of theoretical interest. For proton exchange membrane fuel cells (PEMFCs) proton-form Nafion membranes (® DuPont) have been the benchmark [1-4], with high ionic conductivity, in addition to good physical, chemical, and mechanical stability. However, Nafion's cost, dependence on the level of hydration, permeability to hydrocarbon fuels such as methanol, and its failure to meet the demands of long-term operation at temperatures exceeding 100°C, have fueled an on-going wide-ranging effort to find suitable alternatives. In addition to perfluorosulfonic acid (PFSA) variants on the Nafion structure, new materials include many sulfonated or phosphonated aromatic compounds such as polyetherketones (PEEK, PEEKK) [5], polybenzimidazole [6], and polyphosphazenes [7], as well as imbibed polymer membranes and several alternative acid structures. At present, none of the non-PFSA materials displays the versatility of the PFSAs, though some membranes are excellent in specific specialized areas.
Proton transport in Nafion and other proton exchange membranes has been studied by both experimental and theoretical means [8-11]. Results from these studies support proton transport by two processes, typically referred to as the ‘vehicle’ [12] and ‘Grotthuss’ or ‘hopping’ mechanisms [13-14]. The vehicular mechanism involves the motion of protons attached to solvent molecules. The Grotthuss mechanism is the mechanism by which an “excess” proton or protonic defect diffuses through the hydrogen bonded network of water molecules or other hydrogen bonded liquid through the formation and breaking of hydrogen bonds. In this process the proton is said to hop between hydrogen bonded water molecules. More recently, the conceptual framework for thinking about proton transport in aqueous systems has gone beyond these descriptions of discrete events focused on single protons and their water solvation shells. “Structural” diffusion of protons utilizing a set of small amplitude, concerted motions along a network of hydrogen bonds between water molecules has been suggested [13-14]. The focus has shifted to considering critical transition states and local structures.
The rates at which these mechanisms occur depend on the presence and relative strength of hydrogen bonds. The vehicle mechanism requires that a solvated proton break free of local H-bonds to translate, while Grotthuss or structural diffusion mechanisms are enabled by hydrogen bond breakage and formation in the proton solvation spheres. The form that the solvated proton takes during this process has been and is still under discussion. Bernal and Fowler [15] suggested proton hopping occurs from one H3O+ species to a freely rotating nearest-neighbor water molecule. This model has been deemed unfavorable based upon the fact that water is not a free rotator but is instead involved in tetrahedral hydrogen bonds [16-17]. Other suggestions have the proton as part of either the Zundel (H5O2+) or Eigen (H9O4+) ion. Quantum Molecular Dynamics (MD) simulation [18-19] of an extra proton in water has the proton transport mechanism involving structure in-between both the Zundel- and Eigen- ions. High pressure mass spectrometry [20] has provided evidence of proton solvation by many water molecules and of the most probable structure of the hydrated proton being the Zundel ion solvated by four water molecules. More recent MD simulations [21] investigating one proton in the presence of 100 water molecules at various temperature showed that at 300K the proton is more likely to be coordinated as the Zundel ion, whereas at higher temperatures the Eigen ion becomes more favorable. Simulations of energy barriers for proton transfer via structural diffusion indicate that species such as the Eigen or Zundel ions allow proton transfer from molecule to molecule via a very low barrier [10].
The focus of this paper is on experimental studies of transport of protons and water in solutions of acids that are model structures for the acid termini of membranes used in fuel cells. Based on our data, we look to infer the effect of solvation on ion transport in aqueous media. Whereas in hydrated PEMs there are fixed charged sites in addition to mobile H+ ions (i.e. SO3- in Nafion), in aqueous solutions all charged species are mobile. Despite this, we expect some similarity in the behavior of water and protons in the aqueous solution environment and the hydrophilic regions of the membranes since the acid solvation is likely to be similar. At high acid concentration, corresponding to the low ‘lambda’ values (mole ratio of water to protons), it is believed that anion solvation phenomena plays a major role in determining the behavior of the fuel cell membranes.
In general a superacid is described as any system that is stronger than 100% sulfuric acid [22]. Its relative strength can be given by the Hammett acidity function Ho, which for the following reaction:
| Eq. (1) |
is defined as: [23]
| Eq. (2) |
In an ideal case the protonated base should not interact with the anion A- formed, as the negative charge is completely delocalized on the anion. Superacids are characterized by low melting points, high boiling points, high dielectric constants, and high −Ho (which may be greater than 12) [24].
In this study the acids investigated were: trifluoromethanesulfonic (CF3SO3H), bis(trifluoromethanesulfonyl)imide ((CF3SO2)2NH), and para-toluenesulfonic (CH3C6H4SO3H). The acids will henceforth be known as TFSA, TFSI, and PTSA respectively, and their chemical structures are shown in Figure 1. Of these, the perfluorinated acids are regarded as true superacids. Varying concentrations of aqueous acid solutions were studied at 30°C, with NMR as the main investigative tool used to determine the self-diffusion coefficients (D), spin-lattice relaxation times (T1), and chemical shifts as measures of mobility (D, T1) and chemical environment (chemical shift). In addition to this, ionic conductivity (σ), density and viscosity measurements were also obtained as an aid to interpretation of the dynamic data.
Figure 1.
The chemical structure of the superacids: trifluoromethanesulfonic (TFSA), bis(trifluoromethanesulfonyl)imide (TFSI), and para-toluenesulfonic (PTSA) respectively.
Experimental
1. Sample preparation
The acids TFSA (99%), TFSI (95%), and PTSA (99%) were obtained from Sigma Aldrich. Both the PTSA and TFSI are solids at room temperature while the TFSA is in liquid form. Solutions of PTSA and TFSI were prepared by dissolving the necessary mass of the acids into distilled water to obtain the desired mole ratio (MR) of water to acid molecules. The TFSA solutions were prepared by combining the required mass of the acid to make 10ml solutions in 10ml volumetric flasks. The mole ratio (MR) of water to acid molecules was used as the concentration scale because of the limits in solubility encountered in making concentrations higher than 4M for both TFSI and PTSA and because this provides a natural basis for comparison of mechanistic aspects between the acid solutions and the membranes.
Due to the very hygroscopic nature of the acids, solutions were stored in glass flasks with glass stoppers in a glove box at less than 1ppm moisture content, under a constant flowing nitrogen atmosphere. For NMR measurements the solutions were loaded into 5 mm OD and 20 mm length glass NMR tubes sealed with plastic covers and parafilm. In between measurements the samples were stored in the glove box. For ionic conductivity measurements the solutions were loaded into Teflon conductivity cells, in a glove box under nitrogen atmosphere. The cells were then removed from the glove box, and allowed to equilibrate at 30°C in a constant temperature water bath. For viscosity measurements approximately 8ml of solution was placed into the viscometer flask, sealed and allowed to equilibrate at 30°C in a water bath. For all measurements, intervals of 25-30 minutes were allowed for temperature equilibration. The results shown are the average of at least three measurements on different samples. Errors in each measurement ranged from 1 – 8% depending on the parameter being studied. The lines shown in the plots presented are simply guides to the eye.
2. Viscosity
Solution viscosity (η) was determined by the Falling sphere method [25] using Gilmont (©) viscometers purchased from Cole Palmer. The solution viscosities were calculated from the following formula:
| Eq. (3) |
where κ = the manufacturer's viscometer constant, ρb = the density of the falling ball, ρf = the density of the solution, and t = vertical descent times in minutes. Reference solutions used to check the accuracy of the procedure included methanol, ethylene glycol, and acetic acid. In order to calculate the viscosity, solution densities were required. This was determined by using the simple mass and volume relationship as follows: 5 ml of each aqueous acid solution at varying concentration were measured using 5 ml volumetric flask. The mass of the empty and filled flask was then determined at 30°C. The mass of the solution was determined from the difference between the two and used in the determination of the density of the solution. Reference systems used to check the accuracy of the variable temperature results included water, methanol and 85% phosphoric acid. Deviation of the calculated densities with the accepted values for each reference system was less than 1%, which provided confidence in the procedure.
3. Ionic Conductivity
The ionic conductivity was determined by measuring the electrical resistance using a Sclumberger SI 1260 Impedance/Gain-Phase Analyzer with frequency in the range: 1Hz to 10 MHz, with stainless steel and platinum blocking electrodes for higher acid concentrations. Both real and imaginary components of the impedance were measured. A standardized aqueous solution of 0.1 M potassium chloride (KCl) at 30°C was used as a calibration reference.
4. NMR Measurements
NMR measurements were carried out at the proton (1H) Larmor frequency of both 300 and 500 MHz. For measurements at 300 MHz, the system used was a Chemagnetics CMX spectrometer with a 7.1 Tesla Japan Magnet Technology superconducting magnet. The exact Larmor frequencies of 1H, and 19F in this field are 301.0, and 283.2 MHz respectively. The probe used was a 5mm double resonance Nalorac Z-Spec gradient probe with two observation/excitation coils. Magnetic gradients are applied along the z-axis, with gradient strengths ranging from 0.2 - 1.2 T/m. For measurements at 500 MHz the system used was a Varian Unity spectrometer in conjunction with an 11.7 Tesla narrow bore magnet. The probe was a 5mm reversed detect triple resonance z-axis gradient probe.
Chemical shifts, spin-lattice relaxation times (T1) and self-diffusion coefficients (D) were obtained at 30°C as a function of concentration. Spectral information was obtained by transforming the resulting free induction decay (FID) of a single π/2 pulse. For all 1H measurements done at 300 MHz the reference solution used was distilled water, while that for 19F was a saturated solution of LiCF3SO3. For measurements at 500 MHz an external reference was used as the reference. The reference chosen was 99.9% d6-DMSO (deueterated dimethyl sulfoxide), obtained from Sigma Aldrich.
Self-diffusion coefficients (D) were determined by the NMR-Pulse Gradient Spin Echo (PGSE) technique [26-28]. Uncertainties in self-diffusion measurements are ∼3-8%. T1's were determined by the inversion recovery technique [29]. Typical π/2 pulse width of 15 μs for 1H, and 11 μs for 19F were used.
Results
1. Density
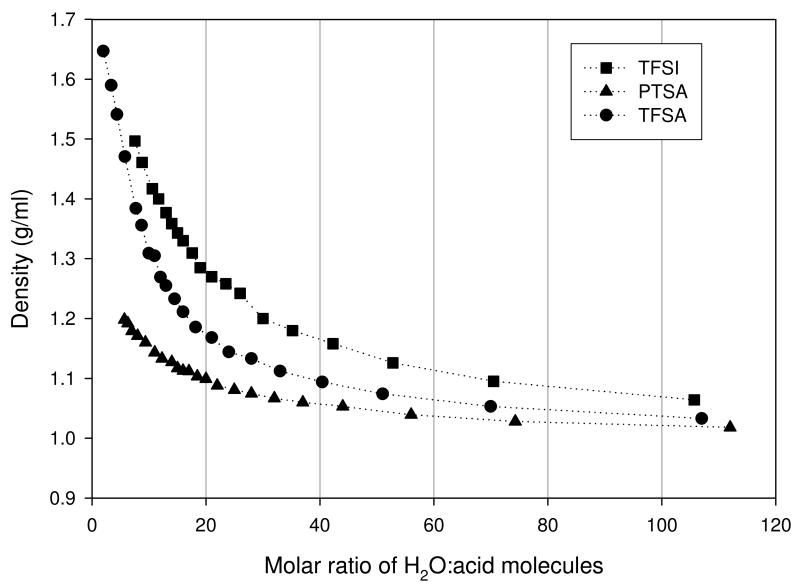
Density measurements were necessary for determination of the solution viscosity. The general trend observed as shown in Figure 2 was a monotonic increase as the acid concentration increased. Results showed the TFSI and PTSA solutions being the most and least dense of the three acids respectively. Vendor-quoted values of density for TFSA and PTSA are 1.69 and 1.24 g/ml respectively, which was the limiting value observed for each acid as the acid concentration increased. No value was available for the pure TFSI at the time of this writing but from the trend observed for TFSA and PTSA, it was determined that the density of the pure TFSI falls within the range of 1.5 - 1.6 g/ml. To our knowledge this is the first mention of this data in the literature.
Figure 2.
Density results for trifluoromethanesulfonic (TFSA), bis(trifluoromethanesulfonyl)imide (TFSI), and para-toluenesulfonic (PTSA).
2. Viscosity
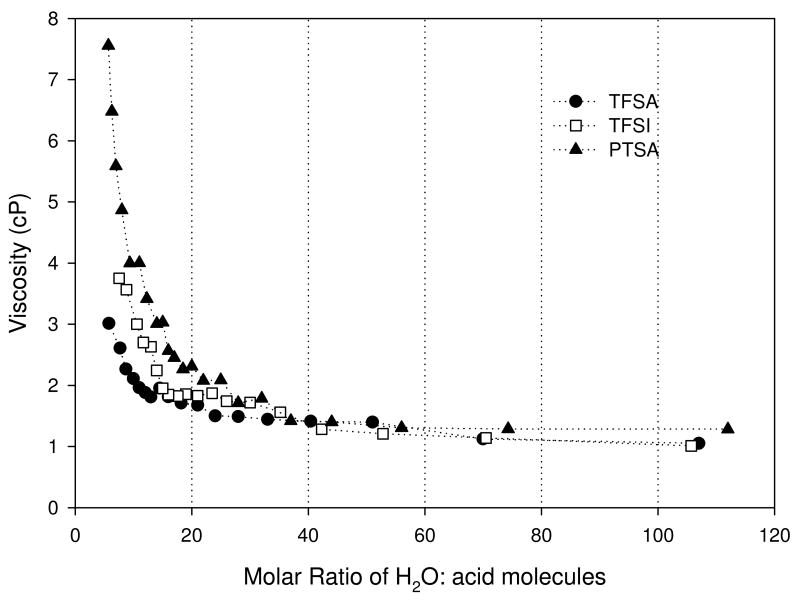
Viscosity (η) results are shown in Figure 3. η increased with increasing acid concentration, with particularly large slope for molar ratio - MR < 20. Smooth, monotonic behavior (i.e. no local maxima) was observed for all of the acid solutions. Of the three acids, TFSA was the least viscous for MR > 5. For MR < 5 however, the viscosity of TFSA approached 20 cP (this value is not included in the plot). Due to solubility limitations it was not possible to compare the behavior of TFSA with TFSI and PTSA in this concentration range. Above MR > 5 comparison of TFSI and PTSA showed TFSI being the less viscous of the two.
Figure 3.
Viscosity results for trifluoromethanesulfonic (TFSA), bis(trifluoromethanesulfonyl)imide (TFSI), and para-toluenesulfonic (PTSA).
3. Ionic Conductivity
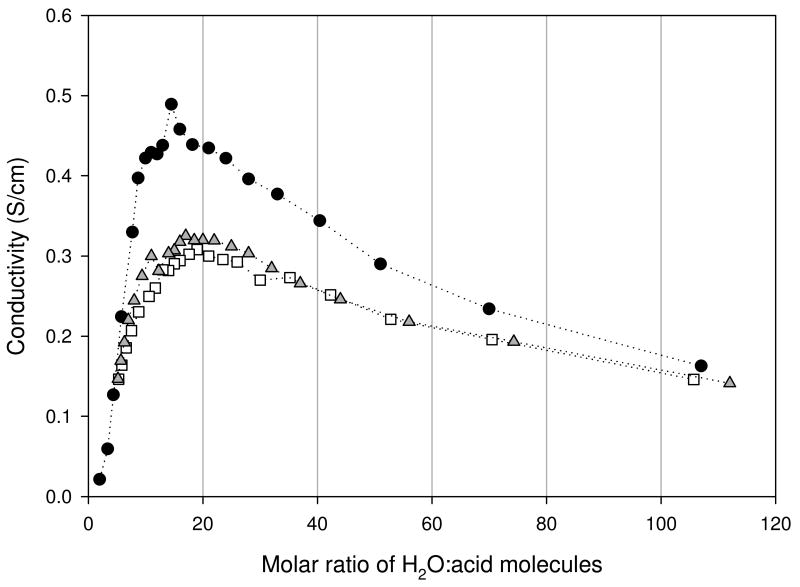
Impedance spectra for the acids at low acid concentrations consisted of an inclined straight line that intersected the real axis at low resistance. As the acid concentration increased however, the intersection point moved to higher resistance, signifying the reduction in ionic conductivity. Results for the ionic conductivities (σ) calculated from the resistance values of the three acids are shown in Figure 4.
Figure 4.
Ionic conductivities of trifluoromethanesulfonic (TFSA - circle), bis(trifluoromethanesulfonyl)imide (TFSI - square), and para-toluenesulfonic (PTSA - triangle) determined at 30°C.
All three acids displayed the same behavior, namely that of a conductivity maximum in the concentration range of 12-20. Of the three acids TFSA exhibited the highest σ over much of the concentration range. Since the cationic species (i.e. protons) in the three acids are the same at lower acid concentrations, where viscosity differences are insignificant, the difference in σ in this region may be attributed to differences in the anion mobility or to differences in the water structure caused by the anion. First, the order of anion size is as follows: TFSA < PTSA < TFSI. This could account for TFSA having the highest mobility, whereas PTSA and TFSI gave comparable results, displaying only minor differences, with that of PTSA being slightly higher about the maximum. Second, from the Nernst-Einstein and Stokes-Einstein equations shown below respectively, at a fixed temperature an increase in σ results from an increase in the number of charge carriers (c) and/or an increase in the self-diffusion coefficient – D, or finally a decrease in the solution viscosity.
| Eq. (4) |
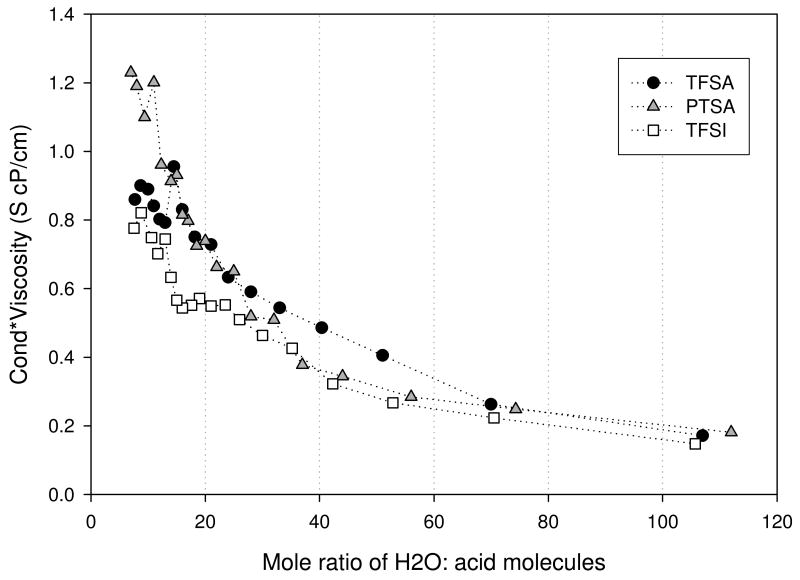
Here q, k, T, and c are the charge, Boltzmann constant, temperature, and concentration of the acid solution respectively. As D was observed to decrease with increasing acid concentration, as discussed in detail later, the increase observed in σ is attributed to an increase in the number of charge carriers. The reduction that follows the maximum is likely due to the increase in the solution viscosity, reflecting an increase in interactions between the species in solution. In this regime, there are increased electrostatic interactions between the ions and correspondingly, reduced ion shielding, which in turn augments ion-association into pairs and aggregates, thereby effectively reducing the ionic conductivity. The product of the conductivity and viscosity data were determined for each acid. As shown in Figure 5, the observed conductivity for viscosity effects by multiplying the two led to a monotonic increase with increasing acid concentration (decreasing MR). Thus we can conclude that the maximum in conductivity represents a trade-off between number of charge carriers and their interactions as reflected in the viscosity.
Figure 5.
Solution Conductivity-viscosity product for trifluoromethanesulfonic (TFSA - circle), bis(trifluoromethanesulfonyl)imide (TFSI - square), and para-toluenesulfonic (PTSA - triangle) determined at 30°C.
4. NMR
I. Spectra
The 1H NMR spectra for both the TFSA and TFSI aqueous solutions consisted of a single peak, while that of the PTSA consisted not only of a main peak, but peaks assigned to the CH3 and ring C6H4 protons. Present in all spectra were the reference d6-DMSO's closely spaced (∼1ppm splitting) proton peaks. For the measurements the reference was set at 2.5 ppm corresponding to the 0.1% protons present in the d6-DMSO solvent. The other d6-DMSO peak was that of the absorbed water and resulted due to the hygroscopic nature of d6-DMSO. The 19F spectra for TFSA and TFSI also contained a single peak over the entire acid concentration range.
A single peak is observed in the 1H spectrum of all acid solutions, indicating fast exchange between the various proton environments. Over the concentration range investigated no splitting was observed for the various proton environments on the NMR timescale. In this case, the expected range of proton chemical shift is a few thousand Hz, corresponding to a timescale of ∼10-5 sec. This is orders of magnitude slower than the expected rate of proton transfer in solution.
There are two pairs of doublets corresponding to the four ring protons of the PTSA molecule. The splitting observed for each pair is the result of J-couplings, values for which ranges between 14-18 Hz, and are concentration independent. This suggests that the ring part of the anion is not involved in the solvation process. This is supported by MD simulation result [30], which shows some charge delocalized on the ring but that the solvation process is associated with the SO2-H group. The magnitude of the coupling constants falls within the range (0-30 Hz) of geminal coupling (2J) for both H-H bonds and that of vicinal (3J, 0-18 Hz) H-H coupling. Due to the symmetry of the PTSA molecule, each proton pair will view the other as an inequivalent neighbor, and will split according to the multiplicity rule resulting in doublets for each pair.
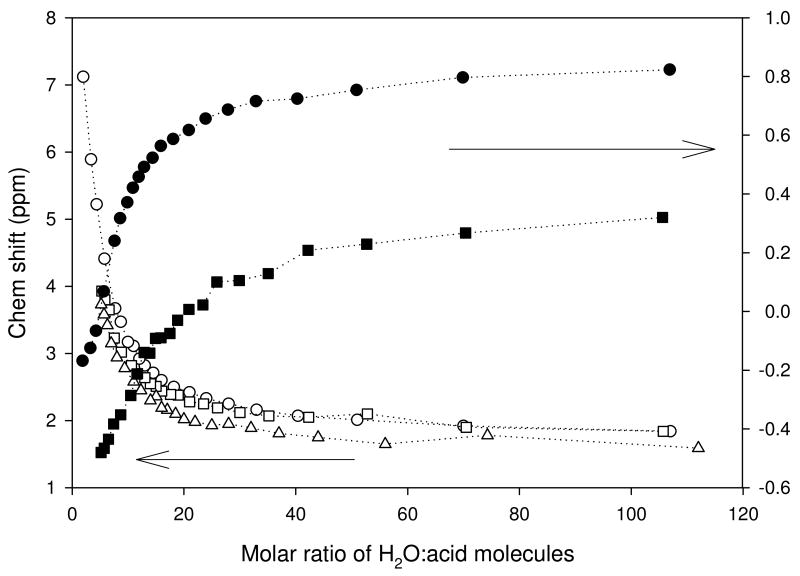
The 1H and 19F chemical shifts measured at 500 and 283 MHz respectively are shown in Figure 6. The 1H values are observed to increase as a function of concentration, rising to about 7 ppm away from the d6- DMSO reference over the range investigated, with the most significant increase occurring for MR < 20 for all three acids. This is an indication of the increase in contribution of the chemical shift of protons to the observed chemical shift (which represents a population-weighted average of the chemical shifts over the full range of concentration to the limit of solubility) which supports the notion that the anion plays little direct role in determining its chemical shift.
Figure 6.
Chemical shifts of species in solution as a function of concentration. 1H (white symbols, 500 MHz) and 19F (black symbols, 283 MHz) NMR chemical shifts for TFSA (circle), TFSI (square) and PTSA (triangle).
A comparison of the 19F data for TFSA and TFSI showed that the TFSI anions are more shielded than the TFSA anions. The difference in shielding remains fairly constant to the limit of solubility of the TFSI. This is likely due to higher charge density on any given fluorine atom on the TFSA. The TFSI has charge delocalized over twice as many fluorines.
II. Spin-lattice relaxation times - T1
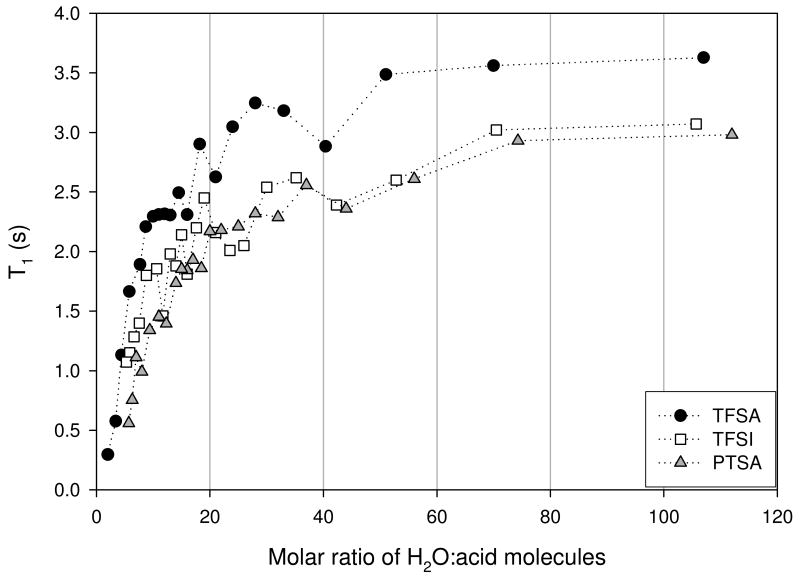
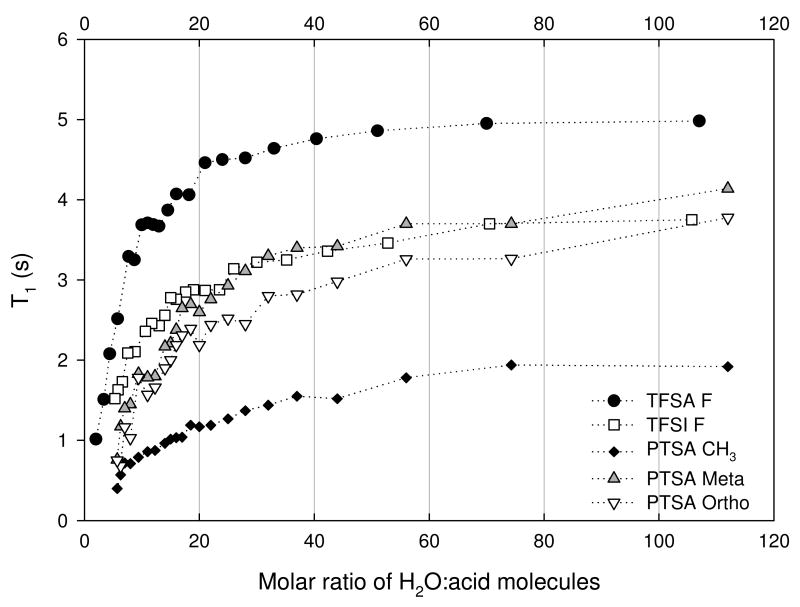
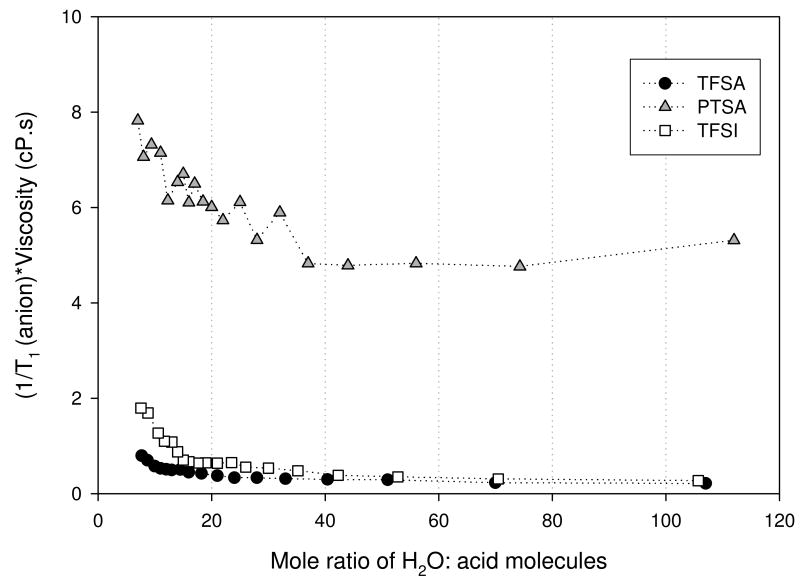
The spin-lattice relaxation times measured at the 1H and the 19F frequency of 300 and 283 MHZ respectively, for the OH and anion species of the three acids are shown in Figures 7 (a) and (b). The general trend observed was a decrease in T1 as the acid concentration increased. The OH T1's showed fluctuations that were concentration dependent, particularly for MR< 40. Overall the pattern observed was the same for the three acids, indicating similarities in the OH environments. PTSA and TFSI solutions had similar T1's over the entire concentration range, while those of TFSA were greater. Based on the values observed one could assume, as expected, that the water molecules present are behaving more bulk-like at the lower acid concentration, with T1 comparable to that of bulk water at 30°C. The anions T1's were relatively insensitive to acid concentration for MR > 40, while displaying only shallow minima and plateaus, for MR < 40. The TFSI anion profile displayed a plateau that extended from about 12 - 25 MR.
Figure 7.
Figure 7(a). OH T1 for trifluoromethanesulfonic (TFSA - circle), bis(trifluoromethanesulfonyl)imide (TFSI - square), and para-toluenesulfonic (PTSA - triangle) determined at 30°C.
Figure 7(b). Anion T1 for trifluoromethanesulfonic (TFSA - circle), bis(trifluoromethanesulfonyl)imide (TFSI - square), and para-toluenesulfonic (PTSA - triangle) determined at 30°C.
The T1 for the CH3 group of the PTSA system also shown in Figure 7(b), displays only a modest decrease with increasing acid concentration, suggesting the methyl group is insensitive to much of the change in the PTSA's anion's local environment compared with that for the ring protons. This behavior may be attributed to the rotational motion of the methyl group, which averages the local fluctuations. This changed however at the higher acid concentrations when the motion of the methyl group becomes hindered from the increasing viscosity, where it gave similar values to both the ring protons and the OH groups, suggesting coupled motion.
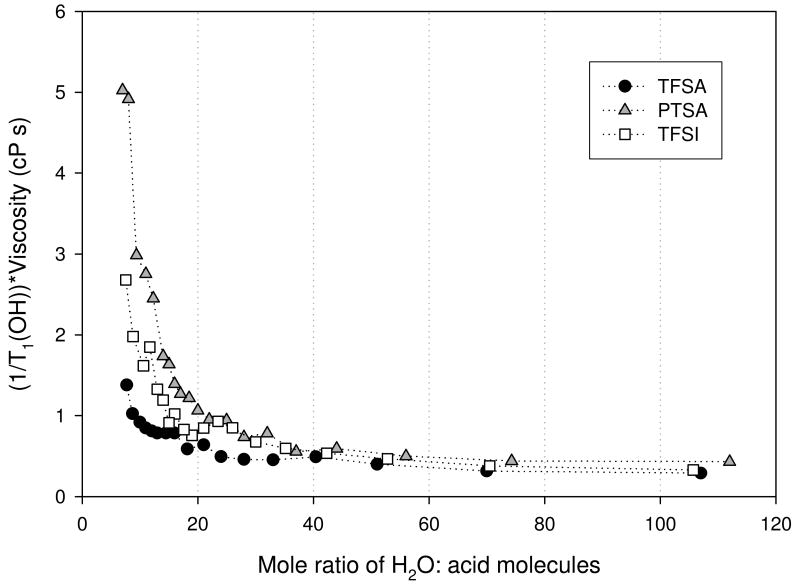
For a given constant relaxation mechanism, these data reflect rotational motions of species on the pico– to nano-meter timescale. All measured relaxation rates reflected a single exponential. Thus, we may infer from the −OH relaxation data that fast exchange on this timescale is occurring. A primary influence on the observed relaxation rates is the solution viscosity, reflecting ion-ion and ion-molecule interactions. In Figures 8 (a) and (b) we show the relaxation rate-viscosity product as a function of composition for the −OH and anions respectively. Over most of the (low acid) concentration range, the viscosity correction removes much of the variation of T1 for both anions and −OH. However below a mole ration of 15 to 20, a strong variation in T1 remains. This is particularly dramatic for the −OH T1's. Two possible explanations for these observations are (1) the relaxation mechanism somehow changes and (2) the simple Stokes sphere rotation model of transport in a continuum breaks down. We also note that the corrected data showed a much larger variation in the product for the PTSA and a much larger variation for the −OH.
Figure 8.
Figure 8(a). OH relaxation rate-viscosity product for trifluoromethanesulfonic (TFSA - circle), bis(trifluoromethanesulfonyl)imide (TFSI - square), and para-toluenesulfonic (PTSA - triangle) determined at 30°C.
Figure 8(b). Anion relaxation rate-viscosity product for trifluoromethanesulfonic (TFSA - circle), bis(trifluoromethanesulfonyl)imide (TFSI - square), and para-toluenesulfonic (PTSA - triangle) determined at 30°C.
III. Self-diffusion Coefficients - D
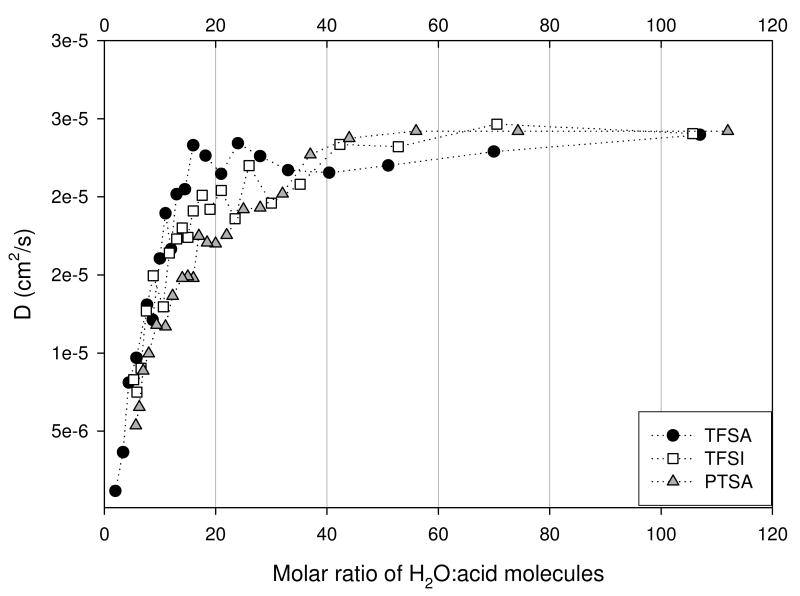
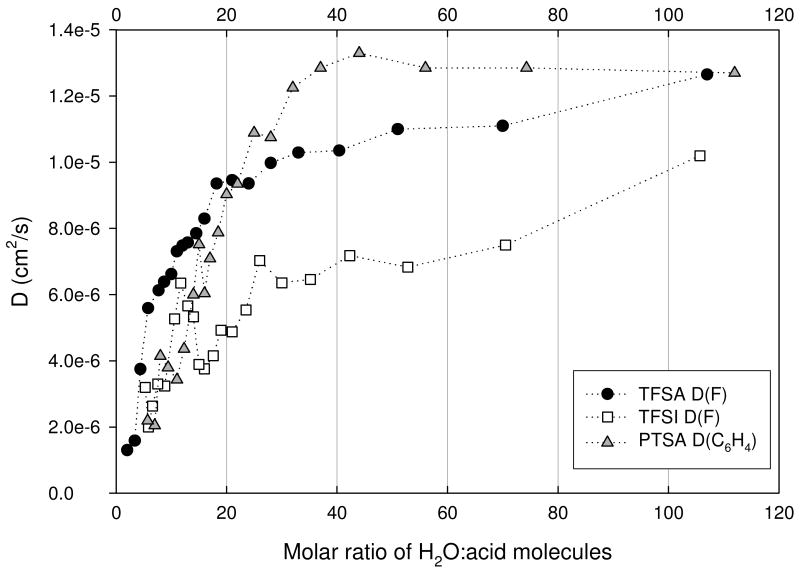
The measured diffusion coefficients for the OH and anion species for the three acids are shown in Figures 9 (a) and (b). The general trend observed for both was a decrease in D as the acid concentration increased. This behavior is expected since the viscosity of the solutions increases with concentration. For each acid the OH D's were greater than that of its respective anion. This difference was observed to decrease as the acid concentration increased, indicating the possibility of ion pairing facilitated by reduced solvent permittivity. Only modest differences were observed in the OH D's for the three acids.
Figure 9.
Figure 9(a). OH D's for trifluoromethanesulfonic (TFSA - circle), bis(trifluoromethanesulfonyl)imide (TFSI - square), and para-toluenesulfonic (PTSA - triangle) determined at 30°C.
Figure 9(b). Anion D for trifluoromethanesulfonic (TFSA - circle), bis(trifluoromethanesulfonyl)imide (TFSI - square), and para-toluenesulfonic (PTSA - triangle) determined at 30°C.
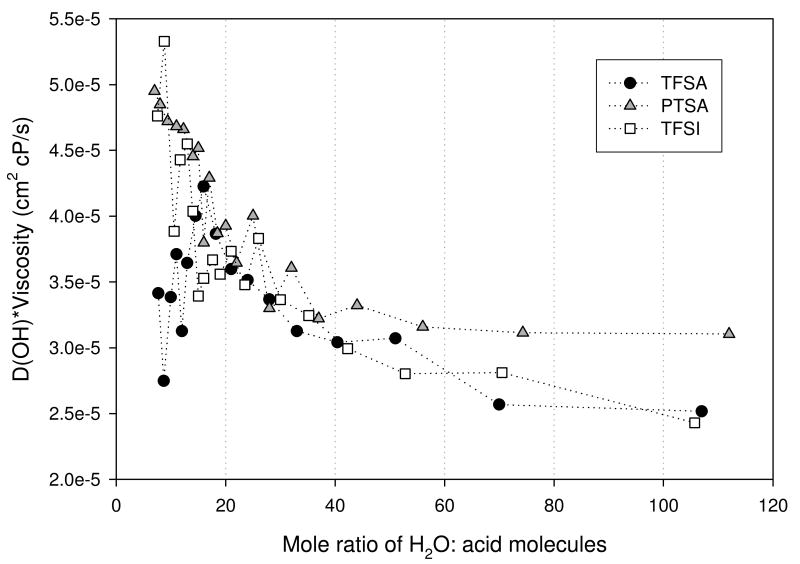
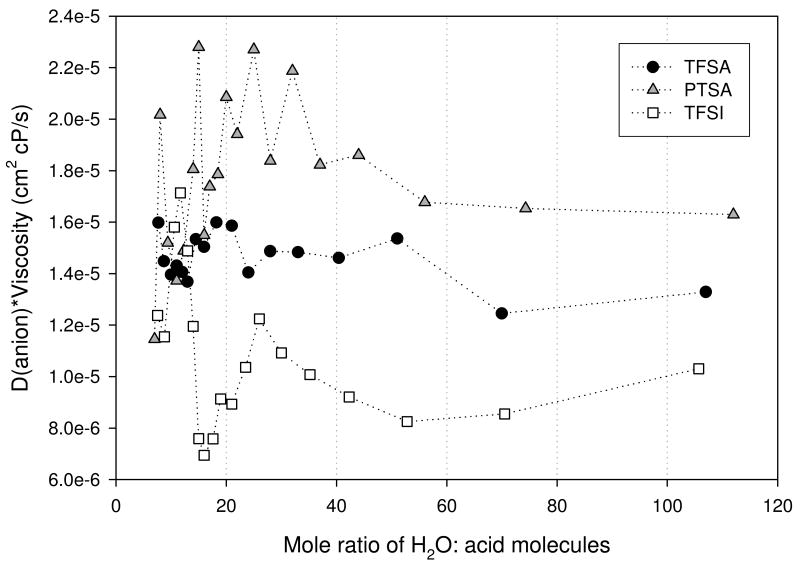
Again, we correct for viscosity differences for −OH and anion diffusion in Figures 10(a) and (b) respectively. The viscosity correction for both the −OH and anion diffusion shows significant variability.
Figure 10.
Figure 10(a). D(OH)-viscosity product for trifluoromethanesulfonic (TFSA - circle), bis(trifluoromethanesulfonyl)imide (TFSI - square), and para-toluenesulfonic (PTSA - triangle) determined at 30°C.
Figure 10(b). D(anion)-viscosity product for trifluoromethanesulfonic (TFSA - circle), bis(trifluoromethanesulfonyl)imide (TFSI - square), and para-toluenesulfonic (PTSA - triangle) determined at 30°C.
5. Discussion and Conclusion
Transport related parameters such as self-diffusion coefficient (D), ionic conductivity (σ), viscosity (η), and spin-lattice relaxation time (T1) were obtained for varying concentrations of the acids: TFSA, TFSI, and PTSA. Maxima were observed in the ionic conductivity - σ, which coincided with minima observed in both the self-diffusion coefficient - D and the spin-lattice relaxation time - T1. The decrease in σ with increasing acid concentration has been attributed to a number of factors such as: increasing viscosity, and increasing ion association through decreasing solution permittivity. Correction of the various transport parameters for viscosity should remove primary effects of ion-ion and ion-solvent interactions. The results of this correction are most directly interpretable for conductivity and diffusion coefficients, since the relaxation rates could have effects due to changes in mechanism. Nonetheless, the relaxation data show similar trends to diffusion data. The viscosity corrected T1's for anions are essentially independent of concentration for MR > 20 for the two superacids and for MR > 40 for PTSA, and we thus infer that the molecular motion governing the relaxation depends primarily on the viscosity reflecting the hydrodynamic nature of these motions. However, OH relaxation and diffusion data show substantial residual increase in the viscosity corrected product, especially at low MR. This implies that there is indeed some excess proton mobility occurring at high acid concentration.
To understand the ion transport mechanism it is necessary to compare the results of D and σ. Whereas D is a measure of translational (Vehicle) mass transport, σ is a measure of ion transport either by the Vehicle or Grotthuss mechanism, or both. Thus a correlation between D and σ is an indication of predominantly Vehicle transport. For all three acids the correlation between D and σ is observed at high acid concentrations - MR < 10, therefore supporting an increase in the contribution of charge transport by the Vehicle mechanism.
It was suggested for the 85 wt. % H3PO4 system that the proton and anion transport occurred by way of the Grotthuss (now referred as structural diffusion) and vehicle mechanisms respectively [32]. While the 85 wt. % (14.6 M) concentration of H3PO4 corresponds to a 1:1 molar ratio system and a much weaker acid than these acids, similar behavior is expected for the protons and anions of the superacids. The much higher than expected transport rate for the protons at high acid concentration suggests that structural diffusion effects are also of great importance in these systems. In particular at MR values between 12 - 20, where the maxima in conductivity coincides approximately with the minimum in anion diffusion and viscosity corrected anion diffusion, implies excess proton mobility in this region.
Proton mobilities - Dσ - were calculated from the ionic conductivity data for each superacid using the Nernst-Einstein equation (Eq. 4). The ratio of Dσ and the water self diffusion coefficient has been used as an indicator of the proton transport mechanism in water and polymers such as Nafion and sulfonated polyetherketones [11, 33]. This ratio – called the Haven ratio, has a value of 4.5 for water, which has been ascribed to proton transport by structural diffusion. An Haven ratio greater than unity indicates structural diffusion is the more effective proton transport mechanism [34]. A value of unity indicates a vehicle mechanism based on the inference that a water molecule and a hydronium are similar in hydrodynamic radius (with the hydronium experiencing slightly more ‘friction’ at very low MR due to its charge) [34]. The Haven ratio values for the superacids ranged from: 0.6 – 3.7 for TFSA (MR range 1-106), 0.9 – 3.2 for PTSA (MR range from 6-112), and 3.8-6.4 for TFSI (MR range from 6-106). The general trend was a decrease in the ratio with increasing acid concentration. Based upon this, the proton transport is accomplished more by the structural diffusion mechanism which gives way to the vehicle mechanism with increasing acid concentration (MR < 10).
We now consider briefly the implications for fuel cell membranes. While it may be difficult to draw any specific conclusions for this comparison, one could infer that PEMs employing the acids investigated and containing low water content (12 < MR < 20) could offer effective proton transport for use in PEMFCs. This is supported by the excess proton mobility observed in this concentration region, which is a significant discovery in this work and substantiated by correcting ionic conductivity by viscosity. Without knowledge of the local viscosity in PEMs we cannot achieve the same correction for the membrane situation and thus it is difficult to know if the same water structures exist. Another interesting aspect of this work is the solubility limits of the various acids. TFSA is much more soluble in water than are the other two acids. This suggests some limitations in the ability of water to solvate the anions and/or access the protons for dissociation (in the case of TFSI). For PTSA, this is not entirely surprising given its lower dissociation constant, reflected in strong decreases in membrane conductivity with decreasing water content. For TFSI, this is in direct contradiction to its reported high gas-phase acidity. The limitation could be ascribed to difficulty in water solvation or water interaction with the anion in the dissociation event. This is supported by MD Simulation results which suggested the difficulty in access of water to the N-H of the TFSI anion to form solvated protons [31]. Despite this, the ionic conductivity in TFSI did display the least dependence on hydration.
Acknowledgments
This research was supported in part by a grant from the U.S. Office of Naval Research. Fellowships support for S.S. was provided by the MBRS-RISE (funded by the National Institutes of Health) and LSAMP (funded by the National Science Foundation) programs.
References
- 1.Gierke TD. J Electrochemic Soc; 152nd Meeting of the Electrochemical Soc., Atlanta, 1977, Abstract No. 438; 1977. p. 319C. [Google Scholar]
- 2.Yeo RS, Eisenberg A. Polymer Preprints. 1975;16:104–110. [Google Scholar]
- 3.Falk M. Can J Chem. 1980;58:1495–1501. [Google Scholar]
- 4.Merisi G, Wang Y, Bandis A, Inglefield PT, Jones AA, Wen WY. Polymer. 2001;42:6153–6160. [Google Scholar]
- 5.Kreuer KD. Solid States Ionics. 1997;97:1. [Google Scholar]
- 6.Wainwright JS, Wang JT, Wong D, Savinell RF, Litt M. J Electrochem Soc. 1995;142:L121. [Google Scholar]
- 7.Wycisk R, Pintauro PN. J Membr Sci. 1996;119:155. [Google Scholar]
- 8.Kreuer KD. Solid States Ionics. 1997;94:55. [Google Scholar]
- 9.Kazansky VB. Topics in Catalysis. 2000;11/12:55. [Google Scholar]
- 10.Kornyshev AA, Kuznetsov AM, Spohr E, Ulstrup J. J Phys Chem B. 2003;107:3351. [Google Scholar]
- 11.Kreuer KD. Chem Mater. 1996;8:610. [Google Scholar]
- 12.Kreuer KD, Weppner W, Rabenau A. Angew Chem Int Ed Engl. 1982;21:208. [Google Scholar]
- 13.van Grotthuss CJD. Ann Chim (Paris) 1806;58:54. [Google Scholar]
- 14.Agmon N. Chemical Physics Letters. 1995;244:456. doi: 10.1016/0009-2614(95)00906-k. [DOI] [PubMed] [Google Scholar]
- 15.Bernal JD, Fowler RH. J Chem Phys. 1933;1:515. [Google Scholar]
- 16.Jorgensen WL. J Chem Phys. 1982;77:4156. [Google Scholar]
- 17.Walrafen GE, Fisher MR, Hokmabidi MS, Yang WH. J Chem Phys. 1986;85:6970. [Google Scholar]
- 18.Tuckerman ME, Laasonen K, Sprike M, Parrinello M. J Chem Phys. 1995;103:150. [Google Scholar]
- 19.Paddison SJ, Pratt LR, Zawodzinski T, Reagor DW. Fluid Phase Equilibria. 1998;150-151:235. [Google Scholar]
- 20.Lau YK, Kebarle P. J Am Chem Soc. 1982;104:1462. [Google Scholar]
- 21.Kornyshev AA, Kuznetsov AM, Spohr E, Ulstrup J. J Phys Chem B. 2003;107:3351. [Google Scholar]
- 22.Gillespie RJ, Peel TE. Adv Phys Org Chem. 1972;9(1) [Google Scholar]
- 23.Hammett LP, Deyrup AJ. J Am Chem Soc. 1932;54:2721. [Google Scholar]
- 24.Olah GA, Surya Prakash GK. Superacids. Chapter 2 John Wiley and Sons; 1985. [Google Scholar]
- 25.Sutterby JL. Trans Soc Rheology. 1973;17:559. [Google Scholar]
- 26.Hahn EL. Phys Rev. 1950;80:580. [Google Scholar]
- 27.Stejskal EO, Tunner JE. J Chem Phys. 1965;42:288. [Google Scholar]
- 28.Stejskal EO. J Chem Phys. 1965;43:3597. [Google Scholar]
- 29.Abragam A. Principles of Nuclear Magnetism. Oxford University Press; 1961. [Google Scholar]
- 30.Paddison SJ. J New Mater Electrochem Sys. 2001;4:197. [Google Scholar]
- 31.Eikerling M, Paddison SJ, Zawodzinski TA., Jr J New Mater Electrochem Sys. 2002;5:15. [Google Scholar]
- 32.Chung SH, Bajue S, Greenbaum SG. J Chem Phys. 2000;112:8515. [Google Scholar]
- 33.Kreuer KD. Solid State Ionics. 2000;136-137:149. [Google Scholar]
- 34.Dippel T, Kreuer KD. Solid State Ionics. 1991;46:3. [Google Scholar]


