

Abstract
Objective
The objective of this study was to validate quantitation of R2* and ΔR2* measurements obtained with a 3-dimensional (3-D) multiple gradient-recalled echo (mGRE) sequence for evaluating intrarenal oxygenation in humans.
Materials and Methods
Validation was accomplished (1) by comparing R2* values with previously established 2-D techniques (n = 5, mean age = 33.6 years) and (2) by measuring change in ΔR2* after furosemide (20 mg intravenously) administration (n = 5, mean age = 22 years). Additional pre- and postfurosemide scans were done at 1.5 T for comparison purposes.
Results
R2* measurements with the 3-D technique showed good agreement with the 2-D techniques. The baseline medullary R2* at 3.0 T was about twice the value found at 1.5 T. Furosemide-induced change in R2* was observed within 5 minutes after administration.
Conclusions
R2* measurements with 3-D mGRE were comparable with those reported using 2-D techniques. The 3-D implementation facilitates observation of temporal changes in the medullary oxygenation without compromising spatial coverage.
Keywords: kidney, BOLD MRI, 3-D mGRE, oxygenation, 3.0 T
The renal medulla operates at low oxygenation levels (renal medullary hypoxia) making it more susceptible to mild reductions in blood flow.1–3 Renal medullary hypoxia is thought to play a role in the pathogenesis and/or progression of acute renal failure,4–6 hypertension,7,8 and diabetic nephropathy.9,10 Blood oxygenation level-dependent (BOLD) magnetic resonance imaging (MRI) has been used to evaluate intrarenal oxygenation levels noninvasively in humans under normal conditions and during physiological and pharmacologic maneuvers at field strengths of 1.5 T10–14 and most recently at 3.0 T.15
To date, all BOLD MRI applied to the human kidney for functional evaluation have used single-shot echo planar (EPI)13 or 2-dimensional (2-D) breathhold multiple gradient-recalled echo (mGRE) techniques.14 Despite the advantage of faster acquisition times, the single-shot EPI technique suffers from limitations such as having high sensitivity to susceptibility differences, which can lead to signal loss, image distortions, and increased blurring resulting from T2* decay during data acquisition.14 The 2-D mGRE technique, although efficacious in terms of R2* mapping, requires multiple acquisitions to achieve adequate spatial coverage, typically a breathhold for each slice acquisition. In this study, we validated the quantitation of R2* and ΔR2* using a 3-D implementation of mGRE to perform intrarenal oxygenation studies. R2* measurements obtained by the 3-D technique were compared with measurements acquired with the 2-D sequence used in previous studies. Changes in R2* (ΔR2*) after administration of furosemide were also compared against previous reports.
Furosemide is a loop diuretic that has been shown to improve medullary oxygenation, presumably because it selectively decreases oxygen consumption by blocking active transport in the thick ascending limbs.1,16 We hypothesized that the relatively fast acquisitions afforded by the 3-D implementation method would allow us to monitor the temporal response after administration of furosemide without sacrificing spatial coverage.
MATERIALS AND METHODS
Studies were performed on a short bore 1.5 T and/or a 3.0 T Twin Speed scanner with Excite technology (General Electric Medical Systems, Milwaukee, WI). Both scanners have a maximum gradient strength of 23 mT/m and a slew rate of 77 mT/m/ms. An 8-element coil array was used for signal reception. All participants gave informed consent according to a protocol approved by the Institutional Review Board.
To implement the 3-D sequence with acquisition time on the order of a single breathhold, we resorted to brute force reduction of the repetition time (TR) compared with our current 2-D mGRE sequence. This was accomplished in the following manner: the number of echoes was reduced from 16 to 8, the bandwidth (BW) was increased from 62.5 kHz to 83.3 kHz, and a shorter radiofrequency (RF) pulse was used in place of a selective water excitation pulse. To further reduce the overall acquisition time, the matrix size was reduced and partial Fourier encoding was used along both the slice (70%) and phase (80%) directions. Table 1 shows the specific acquisition parameters used with each sequence.
TABLE 1.
Specific Acquisition Parameters for the 2-D and 3-D Sequences*
| 3-D (8 Echoes) |
2-D (8 Echoes) |
2-D (16 Echoes) |
|
|---|---|---|---|
| TR (ms) | 25.5 | 35 | 60 |
| TE (ms) | 1.86–22.9 | 7.59–23.4 | 7.59 – 41.4 |
| Flip angle | 10° | 20 ° | 30 ° |
| Bandwidth (kHz) | 83.3 | 62.5 | 62.5 |
| Slice (mm) | 5 | 5 | 5 |
| Matrix | 256 × 160 | 256 × 160 | 256 × 256 |
| Field of view (cm) | 36–42 | 36–42 | 36–42 |
| “Water excite” radiofrequency pulse |
No | Yes | Yes |
| Partial Fourier in phase direction (80%) |
Yes | Yes | Yes |
| Acquired slices per breathhold | 10 | 4 | 1 |
| Slices used for evaluation | 6 | 4 | 4 |
| Breathhold time (seconds) | 23 | 19 | 13 |
Parameters in bold highlight differences between 2-D and 3-D sequences. Italicized parameters detail differences between the 8 and 16 echo 2-D acquisitions. All sequences had 80% phase field of view, and the 3-D sequence additionally used 70% partial Fourier encoding along slice direction.
Comparison of the 3-D versus single-slice 2-D implementations was performed at 3.0 T in 5 male subjects with no known history of renal disease (mean age 33.6 ± 7.0 years). The 3-D mGRE sequence with 8 echoes was used to acquire data during a breathhold of 23 seconds. The sequence acquired data from 10 (coronal) slices. Two slices on either end were not reconstructed to avoid wraparound artifacts. The choice of echo times (TE) was consistent with known values of T2* in the renal medulla (approximately 25 ms).15 For comparison, data were acquired with a 2-D mGRE sequence with 8 echoes to obtain 4 matched slices in a single breathhold of 19 seconds. The positions of the 2-D slices were matched to those of the 3-D acquisitions with no slice gap. Data was also acquired using the current standard prescription at our laboratory, a 2-D mGRE sequence with 16 echoes, to acquire 4 matched slices with one slice per 13 second breathhold. In all sequences, partial Fourier encoding in the phase direction (80%) along with 80% phase field of view were applied.
Five healthy young volunteers (4 female and one male, mean age = 22 ± 1.2 years) with no history of renal disease took part in the furosemide study. The volunteers came to the study after abstaining from food and water for at least 12 hours overnight. Baseline BOLD MR images using the 3-D mGRE sequence were first acquired at 1.5 T. The subjects were then moved to the 3.0 T scanner. After the baseline scans at 3.0 T, 20 mg furosemide was administered intravenously over a 2-minute period. The postfurosemide scans at the 3.0 T scanner were conducted immediately after the administration of furosemide for approximately 10 minutes at the rate of one scan per minute. The volunteers were then returned to the 1.5 T scanner for additional postfurosemide scanning. The relatively fast acquisitions and the availability of both scanners in the same suite facilitated the multiplatform scanning protocol. The 3-D mGRE sequence parameters used for BOLD MRI at 1.5 T were the same as those at 3.0 T (described in Table 1).
The BOLD parameter R2* (=1/T2*), which has been shown to be closely related to the content of deoxyhemoglobin in blood, was used to interpret changes in tissue oxygenation. Decreases in the R2* values imply increases in the tissue pO2 levels. R2* maps were constructed on an Advantage Workstation (General Electric Medical Systems) using FUNCTOOL by fitting a single exponential function to the signal intensity versus TE data. For the analysis, a threshold value was defined so as to avoid fitting to data points approaching noise levels. Approximately 40 regions of interest (ROIs) covering at least 10 pixels each were carefully placed on the anatomic template and R2* values were read off the corresponding R2* maps. The ROIs were positioned in the cortex and medulla on all of the 6 slices that were acquired using the 3-D mGRE sequence. Figure 1B shows an example of the placement of a few ROIs for one of the 6 acquired slices. The data from the ROIs were combined to obtain a single representative mean value for R2* per subject per timepoint. A 2-tailed paired Student t test was used to evaluate any statistical significance of the differences between the pre- and postfurosemide R2* values. Owing to the temporal variations, we empirically chose the last 3 time-points obtained to represent postfurosemide values.
FIGURE 1.

(A) Three-dimensional multiple gradient-recalled echo images from each of the 8 echo times at the same slice position. (B) An anatomic (left) and R2* map (right) from one slice position containing a few representative regions of interest. (C) Anatomic (top row) and corresponding R2* maps (bottom row) at the same slice position for each of the 3 sequences. All images in Figure 1 were acquired at 3.0 T.
RESULTS
Figure 1 shows 3 different sets of images acquired at 3.0 T in the coronal orientation. Figure 1A shows images acquired from one slice at each of the 8 different echo times with the 3-D mGRE sequence. Figure 1B illustrates the placement of ROIs on one representative slice. For comparison purposes, Figure 1C includes anatomic images and their respective R2* maps at the same slice position obtained with each of the 3 sequences used. The coronal view allows for excellent visibility of the cortical and medullary regions in both the anatomic images and R2* maps.
Table 2 quantitatively compares R2* values obtained with the 3-D mGRE (8 echoes), 2-D mGRE (8 echoes), and 2-D mGRE (16 echoes) sequences. The R2* values obtained with 3-D mGRE sequence are in close agreement with those obtained using the 2-D mGRE techniques.
TABLE 2.
Comparison of R2* Values Between 3-D and 2-D mGRE Sequences at 3.0 T*
| Cortex R2* (s−1) | Medulla R2* (s−1) | |
|---|---|---|
| 3-D (8 echoes) | 18.5 ± 2.6 | 37.7 ± 3.8 |
| 2-D (8 echoes) | 20.5 ± 2.9† | 36.6 ± 3.0 |
| 2-D (16 echoes) | 22.0 ± 3.1† | 36.7 ± 2.2 |
Shown are mean ± standard deviation for cortex and medulla over all subjects. A single mean value for each subject was obtained by placing pairs of regions of interest (cortex and medulla) in each slice acquired.
P < 0.05 by paired 2-tailed t test when compared with 3-D mGRE.
Figure 2 demonstrates the temporal response in R2* measurements after administration of furosemide in one representative subject. Within approximately 5 minutes postadministration, the medullary R2* values begin to approach those of the cortex, implying improved oxygenation.
FIGURE 2.
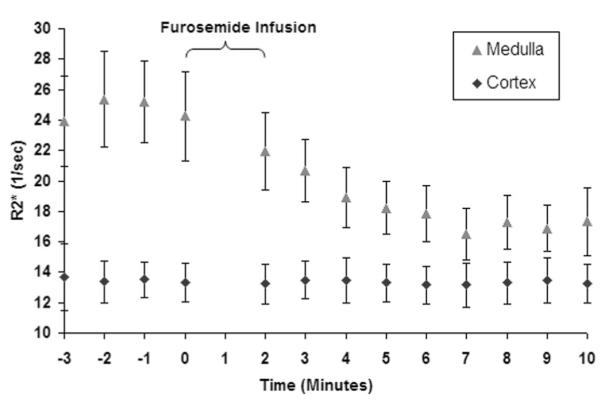
A graphical representation of the R2* values as a function of time obtained in one representative subject. The first 4 points represent the mean baseline R2* values. Zero on the time axis represents the time of furosemide administration. The errors bars represent the standard deviation of the pixel data for all of the regions of interest used to determine a single time point. Note that the cortical R2* remain relatively constant over the entire acquisition period, whereas medullary R2* approaches that of the cortex after administration of furosemide.
Table 3 summarizes the R2* data for all the 5 subjects who partook in the furosemide study. Note the average baseline medullary R2* at 3.0 T is close to twice the value at 1.5 T (26.4 ± 2.0 1/s [mean ± standard deviation] vs 14.8 ± 0.5 1/s). This is consistent with the scaling of the BOLD effect with field strength and our previous reports using 2-D mGRE technique.15 The cortex and medulla both showed statistically significant differences when pre- to postfurosemide changes in R2* values were compared. The magnitude of difference in the cortex was less pronounced compared with that in the medulla. The change in medullary R2* after furosemide was found to be more than twice at 3.0 T compared with 1.5 T.
TABLE 3.
Comparison of R2* Values for Cortex and Medulla (Pre- and Postfurosemide) at 1.5 T and 3.0 T*
| 1.5 T |
3.0 T |
|||||||
|---|---|---|---|---|---|---|---|---|
| Cortex |
Medulla |
Cortex |
Medulla |
|||||
| Subject | Pre | Post | Pre | Post | Pre | Post | Pre | Post |
| 1 | 11.4 | 10.7 | 15.3 | 11.7 | 13.4 | 12.4 | 25.5 | 17.0 |
| 2 | 11.0 | 10.7 | 14.8 | 13.2 | 13.5 | 13.3 | 24.7 | 17.0 |
| 3 | 11.3 | 10.6 | 14.9 | 13.0 | 13.3 | 12.9 | 24.6 | 17.2 |
| 4 | 11.0 | 10.5 | 15.1 | 13.0 | 15.4 | 13.3 | 28.9 | 17.7 |
| 5 | 10.8 | 10.3 | 14.1 | 12.8 | 15.6 | 14.0 | 28.2 | 18.6 |
| Mean | 11.1 | 10.6† | 14.8 | 12.7† | 14.2 | 13.2† | 26.4 | 17.5† |
| Standard deviation | 0.3 | 0.2 | 0.5 | 0.6 | 1.2 | 0.6 | 2.0 | 0.7 |
The average of the last 3 timepoints was used as the postfurosemide data at 3.0 T. All R2* values have units of 1/s. Each R2* number represents a single mean value obtained from regions of interest placed in both the cortex and medulla on all 6 slices for both kidneys at different timepoints.
P < 0.05 using a paired 2-tailed t test when compared with prefurosemide.
DISCUSSION
Our preliminary evaluation of the 3-D mGRE sequence demonstrates that the R2* quantitation is comparable to the 2-D mGRE technique. R2* values measured by the 3 different acquisitions used in this study were in good agreement. Although there was no statistical significance between the 3-D and 2-D acquisitions in the medulla, the values in the cortex showed a significant difference. However, the magnitude of difference in the mean value was relatively modest compared with the standard deviation in the measurements (Table 2). The mean difference ± standard deviation was determined to be 2.06 ± 1.3 (for 3-D vs 2-D with 8 echoes) and 3.54 ± 2.5 (for 3-D vs 2-D with 16 echoes). The 2-D version was performed with 2 sets of parameters, one reflecting the parameters used in most of our previous reports and the other to optimize the maximum TE to be close to T2* of the medulla and comparable to the 3-D acquisition. Table 1 outlines the parameter differences (eg, choice of RF pulse, TE, TR, flip angle, BW, the number of acquired slices per breathhold, and so on) between the 2-D and 3-D 8-echo sequences.
The 3-D mGRE sequence allowed the examination of a temporal BOLD response in the human kidneys after administration of furosemide without compromising the spatial coverage. Although it would have been possible to follow the temporal response using a multislice 2-D mGRE sequence with matched 3-D mGRE sequence parameters, the fundamental advantage of using the 3-D implementation is the improved SNR compared with the 2-D acquisitions. Previous studies typically acquired one set of postfurosemide data over 10 to 15 minutes. Because furosemide is a relatively fast-acting drug, the temporal response (as shown here) after its administration is rapid, within 5 minutes. Also, the response is similar both in terms of magnitude and rate among all subjects.
Although not the primary interest for this study, by taking advantage of the fast acquisition times and the proximity of the 1.5 T and 3.0 T scanners, we were able to collect additional BOLD MRI data at 1.5 T before and after the data acquisition at 3.0 T. Similar to the 3.0 T, all of the volunteers showed a statistically significant change at 1.5 T when comparing the baseline and postfurosemide R2* values for both the cortex and medulla. However, compared with our previous experience,15 the change in R2* in the medulla at 1.5 T was less than half of that seen at 3.0 T (Table 3). This is probably the result of the fact that the time of acquisitions for the postfurosemide data was significantly different at the 2 field strengths as a result of the interleaving of acquisitions between 1.5 T and 3.0 T. At 3.0 T, the postfurosemide scans were performed immediately after administration, whereas at 1.5 T, a time period of at least 15 minutes had elapsed before data acquisition. Cortical R2* did not differ significantly with field strength, probably as a result of the fact that the susceptibility weighting was relatively smaller owing to the better oxygenation. Similar to our previous report, the susceptibility artifacts at 3.0 T were not significantly different from those at 1.5 T.
When comparing the R2* values at 3.0 T in Tables 2 and 3 (baseline), it is interesting to note that there is a noticeable difference. This disparity is most likely attributed to the differences in the group of subjects (eg, age and hydration status). The values determined in Table 2 were more consistent with a previous report on 3.0 T in which the age group was more similar.15
We report for the first time the temporal response in R2* values after administration of furosemide. The 3-D mGRE sequence allows for monitoring temporal responses in intrarenal oxygenation after pharmacologic maneuvers without having to sacrifice spatial coverage. The availability of a 3-D mGRE technique may also facilitate the use of BOLD MRI in a clinical setting. However, the breathhold duration of 23 seconds may not be feasible in patients. Fewer numbers of slices and/or use of parallel imaging techniques17,18 may further reduce the data acquisition times. The technique may also potentially allow for acquisition of thinner slices and hence isotropic resolution.
In conclusion, the 3-D implementation of mGRE sequence provides R2* quantitation that is comparable to our previously used 2-D protocol, however with better spatial coverage. The relatively fast acquisitions available with the 3-D implementation permitted the monitoring of the temporal response after the administration of furosemide. In all subjects studied, furosemide caused a temporal change in R2* in the medulla within approximately 5 minutes, with the medullary R2* values approaching those of the cortex. The baseline medullary R2* values were significantly higher at 3.0 T (by a factor close to 2) when compared with 1.5 T.
Acknowledgments
Supported in part by a grant from the NIH DK-53221.
REFERENCES
- 1.Brezis M, Rosen S. Hypoxia of the renal medulla—its implications for disease. N Engl J Med. 1995;332:647–655. doi: 10.1056/NEJM199503093321006. [DOI] [PubMed] [Google Scholar]
- 2.Zhang W, Edwards A. Oxygen transport across vasa recta in the renal medulla. Am J Physiol Heart Circ Physiol. 2002;283:H1042–H1055. doi: 10.1152/ajpheart.00074.2002. [DOI] [PubMed] [Google Scholar]
- 3.Epstein FH, Agmon Y, Brezis M. Physiology of renal hypoxia. AnnNY Acad Sci. 1994;718:72–81. discussion 81–72. [PubMed] [Google Scholar]
- 4.Heyman SN, Brezis M, Reubinoff CA, et al. Acute renal failure with selective medullary injury in the rat. J Clin Invest. 1988;82:401–412. doi: 10.1172/JCI113612. [DOI] [PMC free article] [PubMed] [Google Scholar]
- 5.Thadhani R, Pascual M, Bonventre JV. Acute renal failure. N Engl J Med. 1996;334:1448–1460. doi: 10.1056/NEJM199605303342207. [DOI] [PubMed] [Google Scholar]
- 6.Lindner A, Sherrard DJ. Acute renal failure. N Engl J Med. 1996;335:1320–1321. author reply 1321–1322. [PubMed] [Google Scholar]
- 7.Cowley AW, Jr, Mattson DL, Lu S, et al. The renal medulla and hypertension. Hypertension. 1995;25:663–673. doi: 10.1161/01.hyp.25.4.663. [DOI] [PubMed] [Google Scholar]
- 8.Cowley AW, Roman RJ, Fenoy FJ, et al. Effect of renal medullary circulation on arterial pressure. J Hypertens Suppl. 1992;10:S187–S193. [PubMed] [Google Scholar]
- 9.Heyman SN, Fuchs S, Brezis M. The role of medullary ischemia in acute renal failure. New Horiz. 1995;3:597–607. [PubMed] [Google Scholar]
- 10.Epstein FH, Veves A, Prasad PV. Effect of diabetes on renal medullary oxygenation during water diuresis. Diabetes Care. 2002;25:575–578. doi: 10.2337/diacare.25.3.575. [DOI] [PubMed] [Google Scholar]
- 11.Epstein FH, Prasad P. Effects of furosemide on medullary oxygenation in younger and older subjects. Kidney Int. 2000;57:2080–2083. doi: 10.1046/j.1523-1755.2000.00057.x. [DOI] [PubMed] [Google Scholar]
- 12.Prasad PV, Epstein FH. Changes in renal medullary pO2 during water diuresis as evaluated by blood oxygenation level-dependent magnetic resonance imaging: effects of aging and cyclooxygenase inhibition. Kidney Int. 1999;55:294–298. doi: 10.1046/j.1523-1755.1999.00237.x. [DOI] [PMC free article] [PubMed] [Google Scholar]
- 13.Prasad PV, Edelman RR, Epstein FH. Noninvasive evaluation of intrarenal oxygenation with BOLD MRI. Circulation. 1996;94:3271–3275. doi: 10.1161/01.cir.94.12.3271. [DOI] [PubMed] [Google Scholar]
- 14.Prasad PV, Chen Q, Goldfarb JW, et al. Breath-hold R2* mapping with a multiple gradient-recalled echo sequence: application to the evaluation of intrarenal oxygenation. J Magn Reson Imaging. 1997;7:1163–1165. doi: 10.1002/jmri.1880070633. [DOI] [PubMed] [Google Scholar]
- 15.Li LP, Vu AT, Li BS, et al. Evaluation of intrarenal oxygenation by BOLD MRI at 3.0 T. J Magn Reson Imaging. 2004;20:901–904. doi: 10.1002/jmri.20176. [DOI] [PMC free article] [PubMed] [Google Scholar]
- 16.Brezis M, Agmon Y, Epstein FH. Determinants of intrarenal oxygenation. I. Effects of diuretics. Am J Physiol. 1994;267:F1059–F1062. doi: 10.1152/ajprenal.1994.267.6.F1059. [DOI] [PubMed] [Google Scholar]
- 17.Pruessmann KP. Parallel imaging at high field strength: synergies and joint potential. Top Magn Reson Imaging. 2004;15:237–244. doi: 10.1097/01.rmr.0000139297.66742.4e. [DOI] [PubMed] [Google Scholar]
- 18.Fink C, Bock M, Puderbach M, et al. Partially parallel three-dimensional magnetic resonance imaging for the assessment of lung perfusion—initial results. Invest Radiol. 2003;38:482–488. doi: 10.1097/01.rli.0000067490.97837.82. [DOI] [PubMed] [Google Scholar]