

Abstract
A new method is proposed to measure transverse blood flow using photoacoustic Doppler broadening of bandwidth. By measuring bovine blood flowing through a plastic tube, the linear dependence of the broadening on the flow speed was validated. The blood flow of the microvasculature in a mouse ear and a chicken embryo (stage 16) was also studied.
By combining optical imaging with ultrasound in a single modality, photoacoustic (PA) tomography (PAT) has been applied in many biomedical studies, particularly in microvascular research [1]. Recently there has been a growing interest in measuring flow using photoacoustics [2-4]. However, these PA technologies for flow measurement are focused on non-imaging sensing, so the potential for imaging purposes is yet to be explored. For a PA imaging system with a relatively short focal range, the transverse component of the blood flow is usually dominant. In this Letter, we propose a method to image the transverse blood flow based on broadening of PA Doppler bandwidth, which is analogous to Doppler ultrasound [5].
The optical-resolution PA microscopy (OR-PAM) system used in this work has been described in detail previously [6]; The lateral resolution is ∼5 μm, and the axial resolution is ∼15 μm. As shown in Fig. 1(a), the projections of the transverse flow velocity on the emanating rays L1 and L2 contribute to the Doppler shift in opposite signs, which results in bandwidth broadening. To estimate the bandwidth, a A-scan signal A(t) is first passed through a digital bandpass filter centered at the central frequency of the ultrasonic transducer. Then the auto-correlation function of sequential A-scans is used to estimate the standard deviation of the PA Doppler spectrum, which gives the broadening, BD, by [Fig. 1(b)] [7]:
Figure 1.
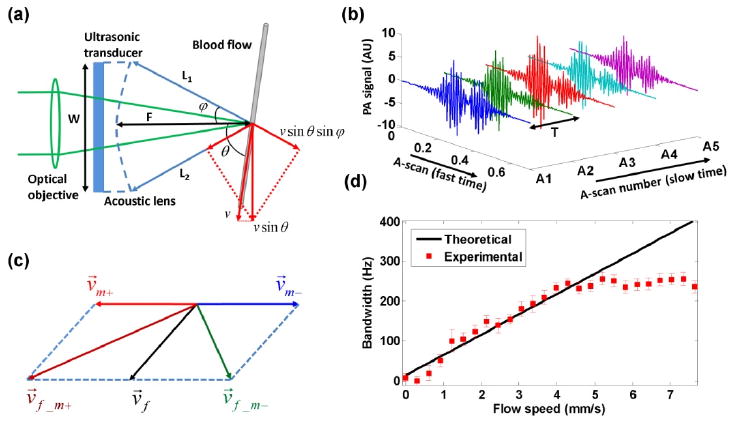
(a) Beam geometry of PA Doppler bandwidth broadening. (b) Sequential A-scans used to estimate the bandwidth broadening. (c) Bidirectional scanning for flow direction sensing. (d) Bandwidth broadening as a function of the flow speed of bovine blood. Solid line: theoretical curve fitted by Eq. (1). Error bar: standard deviation.
| (1) |
where t is the flight time in the A-scan signal, f0 is the central frequency of the ultrasonic transducer, v is the flow speed, c is the speed of sound in water, θ is the Doppler angle, and φeff is the effective aperture angle of the acoustic lens, which is determined by the focusing mechanism of the system. Aj denotes the j th A-scan signal. T is the time interval between sequential A-scans, n is the number of sequential A-scans used for Doppler calculation, and K is a calibration factor.
Here, it is necessary to point out that OR-PAM, where the RBC number within the tight optical focus is limited, differs from the acoustic-resolution PAM (AR-PAM). In AR-PAM where the acoustic focus provides the lateral resolution, the high RBC density may increase the difficulty to detect the signal fluctuation caused by RBC flow. This can be potentially solved using low concentration contrast agents. The imaging depth then can be extended into the diffuse regime.
In OR-PAM, since the sample is translated by a motor with bidirectional scanning, the measured bandwidth broadening is determined by the vector combination of the flow velocity v⃗f with the positive scanning velocity v⃗m+ or negative scanning velocity v⃗m− [Fig. 1(c)]. Therefore, , where vf_m+ and vf_m− are measured velocities under the conditions of v⃗m+ and v⃗m−, respectively. If vf_m+ >vf_m−, v⃗f must have a positive projection on v⃗m+ (i.e., v⃗f · v⃗m+>0) and the flow is called positive, and vice versa. Four-directional scanning, including back and forth scanning along two orthogonal scanning lines can be further used to cover all the directions at the expense of imaging time.
In a phantom study, defibrinated bovine blood (Quad Five, Ryegate, MT) was driven through a plastic tube (260 μm inner diameter; Dow Corning, Midland, MI) by a syringe pump (BSP-99M; Braintree Scientific, Braintree, MA) with flow speeds ranging from 0 to 7.6 mm/s without motor scanning. The Doppler angle was ∼90 deg. The bandwidth broadening was estimated using eight sequential A-scans (repetition rate: 1.2 KHz) and averaged over 3200 measurements., The broadening has a good linear dependence on the flow speed at values less than ∼4.4 mm/s but becomes saturated thereafter [Fig. 1(d)]. This saturation is caused by the tight light focusing in the OR-PAM system. If the flow speed is greater than 4.4 mm/s, only one A-scan can be captured when the same RBCs pass through the focus, which means that any sequential A-scans are uncorrelated. Thus, the calibration factor K in Eq. (1) was fitted using the data before saturation.
In vivo experiment was performed on the ear of a 6-week-old mouse (Hsd:ND4, Swiss Webster; Harlan, Indianapolis, IN). A volumetric dataset was acquired at 560 nm and 570 nm under bidirectional scanning on a 2 mm × 1 mm area with a scanning speed of 0.75 mm/s and a step size of 0.625 μm. The PA signal acquired at 570 nm maps the total hemoglobin concentration [Fig. 2(a)], and the dual-wavelength measurements were used to calculate SO2 [8] [Figs. 2(b) and (e)].
Figure 2.
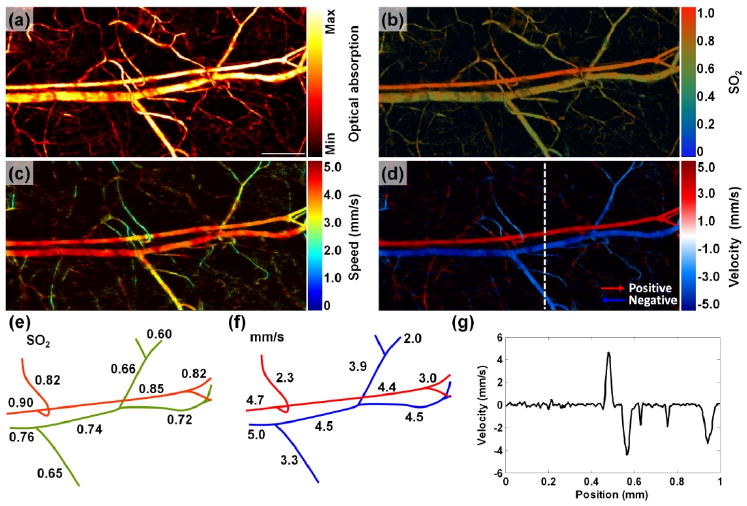
PA imaging of SO2 and blood flow in a mouse ear. (a-b) MAP image of structure (a) and SO2 (b). Scale bar = 250 μm. (c-d) MAP image of blood flow speed (c) and velocity with directions (d). (e-f) Trace of SO2 (e) and blood flow speeds (f) along the main vascular trunk, respectively. (g) Velocity profile indicated by the dashed line in (d).
Bidirectional scanning measurements at 570 nm provided the transverse blood flow images [Figs. 2(c) and (d), Media 1] with eight sequential A-scans in one B-scan (Doppler angle: ∼90 deg). Because the heart of a mouse beats at up to ∼8 Hz and the frame rate for B-scans was ∼1 Hz, the bidirectional scans most likely caught different phases of the systole and diastole. To mitigate the variation of the measured speed and better measure the flow direction, we averaged over 3-by-3 pixels. The positive and negative flows are shown in red and blue, respectively. A trace of the averaged speeds along the main vascular trunk is shown in Fig. 2(f). Velocity profile indicated by the dashed line in Fig. 2(d) is shown in Fig. 2(g). The flow directions can also help to distinguish arterioles from venules. The imaged vessels that flow blood away from the heart are arterioles [red in Fig. 2(d)], while the imaged vessels that flow blood back to the heart are venules [blue in Fig. 2(d)]. This classification is consistent with the categorization based on the SO2 measurement in Fig. 2(b). Saturation may exist here based on the saturation point observed in the phantom study.
Another experiment was performed on a stage-16 chicken embryo. For our study, since the chicken embryo has a relatively slow blood flow speed and heart beating rate [9], the time course of the blood flow can be sufficiently sampled without speed saturation. A chicken embryo was removed from a fertile white leghorn chicken egg (Sunrise Farms, Catskill, NY) after approximate 60 h of incubation and cultured in phosphate buffered saline (PH: ∼7.0). Infrared light was applied during the experiment to maintain its activity (Temperature: ∼30 °C).
A transmission optical microscopy image of the entire embryo was acquired [Fig. 3(a), left]. An area of ∼2 mm × 2 mm around the right lateral vitelline vessels was imaged at a higher magnification [Fig. 3(a), right], and a PA image of the same area was acquired at 570 nm [Fig. 3(b)]. The time course of the flow speed at the center of a vessel, marked by a cross in Fig. 3(b), was measured using eight sequential A-scans without motor scanning (Doppler angle: ∼90 deg). The forward and backward flows are clearly observed [Fig. 3(c)]. The measured flow speeds are consistent with those observed previously in ovo [9]. The opposite flow directions were confirmed using the optical microscopy. The spectral analysis of the time course indicates a heart beating rate of ∼0.5 Hz, which is consistent with the visual observation.
Figure 3.
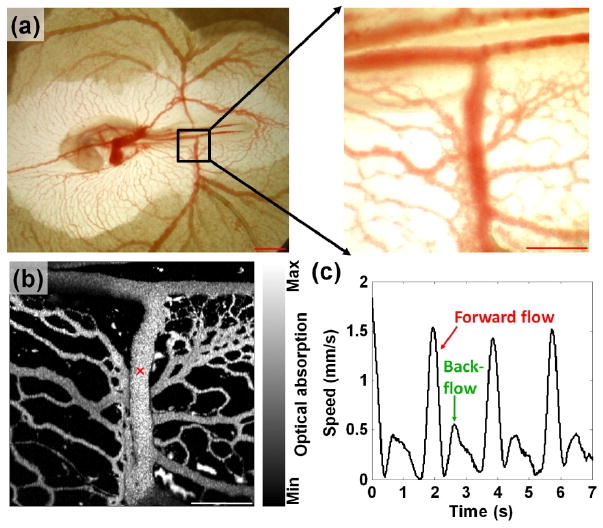
Blood flow measurement in a chicken embryo. (a) Left: a transmission optical microscopy image of a chicken embryo (stage 16). Scale bar = 2 mm. Right: a region of interest (∼2 mm × 2 mm) imaged at a higher magnification (×32). Scale bar = 500 μm. (b) A PA image of the same area. Scale bar = 500 μm. (d) Time course of the blood flow speed at the position indicated by the cross in (b).
In theory, the maximum measurable speed is ∼7.4 mm/s, which is limited by the 2 KHz maximum laser repetition rate and the light focus diameter. It can be improved by increasing the laser repetition rate or enlarging the light focal spot. Both the minimum measurable speed and the speed sensitivity are around 0.1 mm/s, which are determined by the signal-to-noise ratio (SNR), and can be improved by averaging. With motor scanning, small vessels may not have sufficient data points to keep the speed sensitivity. This problem can be solved by M-mode measurement, which, however, will lose the flow direction information.
In summary, we have demonstrated a new method that uses PA Doppler broadening of bandwidth to measure transverse blood flow. By the use of dual-wavelength excitation and bidirectional scanning, 3D structural, oxygenation, and flow information can be obtained simultaneously in the same system. With these information, this technique provides a promising tool to measure the metabolic rate of oxygen.
Acknowledgments
The authors thank Christopher Favazza, Song Hu, and Arie Krumholz for helpful discussion. This research was supported by the National Institutes of Health Grants R01 EB000712, R01 NS46214, R01 EB008085, R01 CA113453901, U54 CA136398, and 5P60 DK02057933. LW has a financial interest in Microphotoacoustics, Inc. and Endra, Inc., which, however, did not support this work.
References
- 1.Wang LV. Multiscale photoacoustic microscopy and computed tomography. Nature Photonics. 2009;3:503–509. doi: 10.1038/nphoton.2009.157. [DOI] [PMC free article] [PubMed] [Google Scholar]
- 2.Li PC, Huang SW, Wei CW, Chiou YC, Chen CD, Wang CRC. Photoacoustic flow measurements by use of laser-induced shape transitions of gold nanorods. Optics Letters. 2005;30:3341–3343. doi: 10.1364/ol.30.003341. [DOI] [PubMed] [Google Scholar]
- 3.Fang H, Maslov K, Wang LV. Photoacoustic Doppler flow measurement in optically scattering media. Applied Physics Letters. 2007;91:264103. [Google Scholar]
- 4.Fang H, Wang LHV. M-mode photoacoustic particle flow imaging. Optics Letters. 2009;34:671–673. doi: 10.1364/ol.34.000671. [DOI] [PMC free article] [PubMed] [Google Scholar]
- 5.Newhouse VL, Censor D, Vontz T, Cisneros JA, Goldberg BB. Ultrasound Doppler Probing of Flows Transverse with Respect to Beam Axis. IEEE Transactions on Biomedical Engineering. 1987;34:779–789. doi: 10.1109/tbme.1987.325920. [DOI] [PubMed] [Google Scholar]
- 6.Maslov K, Zhang HF, Hu S, Wang LV. Optical-resolution photoacoustic microscopy for in vivo imaging of single capillaries. Optics Letters. 2008;33:929–931. doi: 10.1364/ol.33.000929. [DOI] [PubMed] [Google Scholar]
- 7.Chihiro K, Akimitsu H, Kouroku N. Real-time blood-flow imaging system using ultrasonic doppler techniques. Systems and Computers in Japan. 1988;19:13–24. [Google Scholar]
- 8.Hu S, Maslov K, Tsytsarev V, Wang LV. Functional transcranial brain imaging by optical-resolution photoacoustic microscopy. Journal of Biomedical Optics. 2009;14:040503. doi: 10.1117/1.3194136. [DOI] [PMC free article] [PubMed] [Google Scholar]
- 9.Hu N, Clark EB. Hemodynamics of the Stage-12 to Stage-29 Chick-Embryo. Circulation Research. 1989;65:1665–1670. doi: 10.1161/01.res.65.6.1665. [DOI] [PubMed] [Google Scholar]