

Abstract
Purpose
Cannabinoid subtype 1 (CB1) receptors are found in nearly every organ in the body, may be involved in several neuropsychiatric and metabolic disorders, and are therefore an active target for pharmacotherapy and biomarker development. We recently reported brain imaging of CB1 receptors with two PET radioligands: 11C-MePPEP and 18F-FMPEP-d2. Here we describe the biodistribution and dosimetry estimates for these two radioligands.
Methods
Seven healthy subjects (four men and three women) underwent whole-body PET scans for 120 min after injection with 11C-MePPEP. Another seven healthy subjects (two men and five women) underwent whole-body PET scans for 300 min after injection with 18F-FMPEP-d2. Residence times were acquired from regions of interest drawn on tomographic images of visually identifiable organs for both radioligands and from radioactivity excreted in urine for 18F-FMPEP-d2.
Results
The effective doses of 11C-MePPEP and 18F-FMPEP-d2 are 4.6 and 19.7 μSv/MBq, respectively. Both radioligands demonstrated high uptake of radioactivity in liver, lung, and brain shortly after injection and accumulated radioactivity in bone marrow towards the end of the scan. After injection of 11C-MePPEP, radioactivity apparently underwent hepatobiliary excretion only, while radioactivity from 18F-FMPEP-d2 showed both hepatobiliary and urinary excretion.
Conclusion
11C-MePPEP and 18F-FMPEP-d2 yield an effective dose similar to other PET radioligands labeled with either 11C or 18F. The high uptake in brain confirms the utility of these two radioligands to image CB1 receptors in brain, and both may also be useful to image CB1 receptors in the periphery.
Keywords: 11C-MePPEP, 18F-FMPEP-d2, Dosimetry, PET
Introduction
The cannabinoid subtype 1 (CB1) receptor is coupled to G proteins and found at various densities in nearly every organ of the body. In the brain, CB1 receptors receive endogenous cannabinoids, such as anandamide and 2-arachidonoyl glycerol, after paracrine or autocrine release [1, 2]. There, CB1 receptors often act as neuromodulators, reducing the amount of neurotransmitter released into the synapse, such as γ-aminobutyric acid (GABA), glutamate, or dopamine. Changes in CB1 receptor density have been associated with several neuropsychiatric disorders, including alcohol dependence and schizophrenia, based on postmortem and animal model studies [3, 4]. As a result, CB1 receptors have been targeted for pharmacotherapy and investigated as possible biomarkers for several disorders.
While much attention has been paid to cerebral CB1 receptors, peripheral organs have been shown to express CB1 receptors where they mediate a variety of effects [5]. For instance, CB1 receptors are upregulated in animal models of liver fibrosis due to nonalcoholic steatohepatitis, and rimonabant, an inverse agonist, has been suggested as a possible mode of treatment [6]. In the heart, CB1 receptors directly and indirectly mediate vasodilatation and contractility, and endogenous cannabinoids are markedly increased in diseased states [7]. Other sites of CB1 receptors include intestine, skeletal muscle, adipose tissue, and immune cells, where they are involved in neural, metabolic, and immune functions.
We have reported two CB1 receptor-selective radioligands for use in positron emission tomography (PET), 11C-MePPEP and 18F-FMPEP-d2 [8–10]. The two radioligands have been used to image and quantify CB1 receptors in human brain using the “gold standard” method of serial brain images and measurements of unchanged radioligand in arterial plasma. The objective of the current study was to measure the biodistribution and then to estimate radiation dosimetry of 11C-MePPEP and 18F-FMPEP-d2 in human subjects.
Materials and methods
Radioligand preparation
11C-MePPEP ((3R,5R)-5-(3-methoxy-phenyl)-3-((R)-l-phenyl-ethylamino)-1-(4-trifluoromethyl-phenyl)-pyrrolidin-2-one) and 18F-FMPEP-d2 ((3R,5R)-5-[(3-fluoromethoxy-d2) phenyl]-3-[(R)-1-phenyl-ethylamino]-1-(4-trifluoromethyl-phenyl)-pyrrolidin-2-one) were prepared as previously described [8]. The preparations are described in detail in our Investigational New Drug Applications #79,948 and #100,898, submitted to the US Food and Drug Administration and a copy of which is available at http://pdsp.med.unc.edu/snidd/. 11C-MePPEP was obtained in high radiochemical purity (>99%) and had specific radioactivity at time of injection of 83±38 GBq/μmol (n=6 batches). 18F-FMPEP-d2 was obtained in high radiochemical purity (>99%) and had specific radioactivity at time of injection of 118± 18 GBq/μmol (n=7 batches).
Subjects
Seven healthy subjects (four men and three women, age: 26±4 years, body weight: 71±9 kg) participated in studies with 11C-MePPEP Another seven healthy subjects (two men and five women, age: 30±12 years, body weight: 68±16 kg) participated in studies with 18F-FMPEP-d2. All subjects were free of current medical and psychiatric illness based on history, physical examination, electrocardiogram, urinalysis including drug screening, and blood tests (complete blood count, serum chemistries, thyroid function test, and antibody screening for syphilis, human immunodeficiency virus, and hepatitis B). The subjects' vital signs were recorded before radioligand injection and at 15, 30, 90, and 120 min after injection of 11C-MePPEP, and similarly recorded with additional readings at 150 and 180 min after injection of 18F-FMPEP-d2. Subjects returned to repeat urinalysis and blood tests 7–24 h after the PET scan.
PET scans
After intravenous injection of either 11C-MePPEP (340±17 MBq) or 18F-FMPEP-d2 (105±18 MBq), 2-D dynamic PET whole-body images were acquired on a GE Advance tomograph (GE Medical Systems, Waukesha, WI, USA). We followed the procedure of image acquisition described previously by our group [11]. In brief, each subject was imaged in seven contiguous 15-cm bed positions (head to upper thigh) in either 14 frames for 11C-MePPEP or 16 frames for 18F-FMPEP-d2, each of increasing duration (15 s to 4 min) for a total scan time of 120 or 300 min, respectively. All PET images were reconstructed with ordered subset expectation maximization image reconstruction in 28 subsets with 4 iterations and were corrected for attenuation. Subjects injected with 18F-FMPEP-d2 had three rest periods (30 min each) outside the camera, beginning at approximately 120, 180, and 240 min after injection.
Image analysis
After injection of 11C-MePPEP, thyroid, brain, heart, lungs, liver, gallbladder, spleen, kidneys, red marrow, and intestine were visually identifiable as source organs. To estimate the residence time of red marrow and bone, regions of interest were placed on lumbar vertebrae and on radii and ulnae. To estimate the residence time of intestine, a large region of interest was placed in the abdomen that did not include the aforementioned organs. After injection of 18F-FMPEP-d2, brain, heart, lungs, liver, gallbladder, spleen, kidneys, bone, red marrow, intestine, and urinary bladder were visually identifiable as source organs. Lumbar vertebrae and radii and ulnae were again used to estimate the residence time of red marrow and bone. Large regions were placed to encompass all accumulated radioactivity in each organ. Image analysis was done using the PMOD 2.95 software (PMOD Technologies, Zurich, Switzerland).
Regions were placed in two ways based upon the amount of radioactivity and the visibility of the source organ. For all organs except bone (i.e., radius and ulna), regions were drawn on each axial slice in which the organ was identified. These regions were confirmed in the coronal and sagittal orientations. For the bones in the forearm that had low uptake of radioactivity, regions were drawn over radii and ulnae (left and right) on the transmission scan and then applied to the corresponding PET emission image.
Calculating residence times
The average recovery of activity measured in body above the thigh was 90±5% for 11C-MePPEP and 94±4% for 18F-FMPEP-d2 of the injected activity measured in a dose calibrator. Since the images did not include the body below mid-thigh, organ uptake was corrected for this recovery. Some of the source organs were not confined to a single bed position. In these cases, we calculated a new time point weighted by the average of organ radioactivity in the two frames. The area under the curve of each organ was calculated to the end of imaging (120 min for 11C-MePPEP, 300 min for 18F-FMPEP-d2) by the trapezoidal method. The area after the last image to infinity was calculated by assuming that further decline of radioactivity occurred only by physical decay without any biological clearance.
Residence time of bone was estimated based upon that in radius and ulna, which lack red marrow in adults [12]. The bone mass of ulnae and radii are 216 g, which equals 4.3% of all bone mass in the body [13]. Thus, the residence time of all bone in the body was calculated as that of radii and ulnae divided by 4.3%. Furthermore, the residence time of all bone was divided between trabecular and cortical regions according to the mass ratio of these two regions determined in postmortem study; the ratio of trabecular bone to cortical bone is 1:4 [13].
The residence time of all red marrow in the body was estimated from lumbar vertebrae, which contains both red marrow and bone. The bone component of lumbar vertebrae was estimated relative to that of radii and ulnae, and the red marrow component was estimated as total activity in lumbar vertebrae minus its bone component. More specifically, the bone mass of lumbar vertebrae is 172 g, which equals 3.4% of the mass of all bones in the body. The mass of red marrow in lumbar vertebrae equals 12.3% of the mass of all red marrow in the body [12]. Thus, the bone component of the residence time in lumbar vertebrae was calculated as 3.4% of the residence time of all bone in the body, which itself was calculated from radii and ulnae. The residence time of red marrow in the body was calculated as that of all radioactivity in lumbar vertebrae minus that from the bone component and then divided by 12.3%.
The residence times for the intestinal tract were determined using the ICRP 30 intestine model [14], in which the highest percentage of injected activity measured in the intestines during the scanning session was designated as entering the small intestine.
To calculate the residence time of the remainder of the body, the residence time of all source organs was summed and subtracted from the fixed theoretical value of T1/2/ln 2, which equals 0.490 h for 11C and 2.640 h for 18F.
Urine excretion
Urine was collected for 19–25 h in five subjects and for 5 h in two subjects after injection of 18F-FMPEP-d2. Total activity in the urine was added to that measured in the urinary bladder in the PET scan to determine total radioactivity excreted after injection. The cumulative activity in urine was decay corrected and expressed as a fraction of injected activity. This curve was fitted with a monoexponential function to estimate total radioactivity excreted at infinite time.
Estimation of absorbed radiation doses
Radiation absorbed doses were calculated by the mean residence time for each source organ using OLINDA 1.0/EXM software [15] for a 70-kg adult male. We used the dynamic urinary bladder model, with voiding interval of 2.4 h.
Results
Pharmacological effects
Neither 11C-MePPEP nor 18F-FMPEP-d2 caused pharmacological effects during the 2- and 5-h scans, based on subject reports, ECG, blood pressure, pulse, and respiration rate. In addition, no effects were noted in any of the blood and urine tests acquired 7–24 h after radioligand injection. The injected activity of 11C-MePPEP was 340±17 MBq, which corresponded to 5.2±2.7 nmol MePPEP (n=7 injections). Likewise, the injected activity of 18F-FMPEP-d2 was 105±18 MBq, which corresponded to 0.90± 0.19 nmol FMPEP-d2 (n=7 injections).
Biodistribution of 11C-MePPEP
Thyroid, brain, heart, lungs, liver, gallbladder, spleen, kidneys, lumbar vertebrae, and intestine were visually identified on the images and treated as source organs of radioactivity for dosimetry calculations of 11C-MePPEP (Fig. 1). The liver had the highest uptake, with a peak of 25% of injected activity at ∼9 min. Radioactivity peaked at the time of first image acquisition and decreased thereafter in lungs (19%), kidneys (4.9%), spleen (3.3%), heart (3.0%), and thyroid (0.2%) (Fig. 2). Radioactivity slowly accumulated in brain (7.9%), intestine (6.8%), lumbar vertebrae (0.7%), and radii and ulnae (0.2%) and reached a peak after 45 min, while radioactivity accumulated in gallbladder (2.6%) from 16 min until the end of the scan.
Fig. 1.
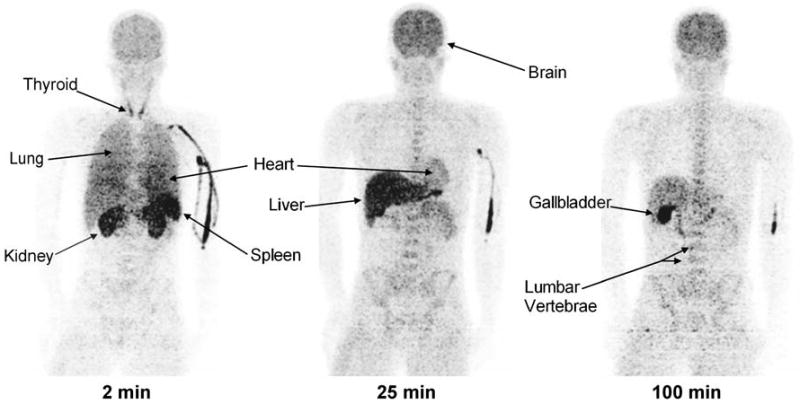
Maximum intensity projection images of a healthy male about 2, 25, and 100 min after injection of 11C-MePPEP
Fig. 2.
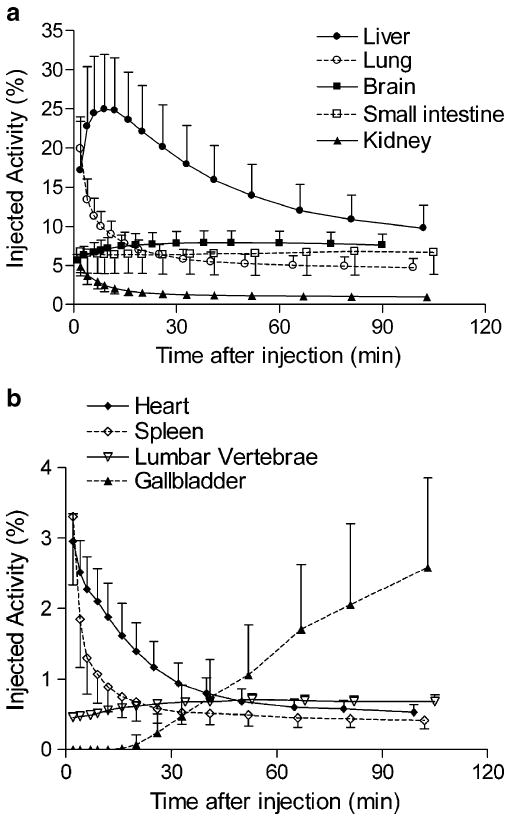
Uptake of radioactivity from 11C-MePPEP in organs that could be visually identified on whole-body images. Activity of organ is expressed as percentage of injected activity. Data are mean ± SD in seven subjects
Radioactivity was excreted solely through bile, since the gallbladder showed high levels of radioactivity and none was observed in the urinary bladder. The gallbladder was clearly visible in all subjects and reached a maximum of 2.6% injected activity by the end of the scan. The small intestine was visualized after radioactivity had accumulated in the gallbladder, suggesting that the bile containing radioactivity was excreted into the intestinal tract. We determined the residence time for the intestinal tract using the ICRP 30 intestine model [14], using as an input the highest percentage of injected activity measured in the intestines during the scan, which occurred when bile containing radioactivity was present in the intestine.
Uptake in red marrow is difficult to calculate because it is located within bones which may also contain radioactivity and would potentially confound measurements of red marrow. We estimated uptake in bone based on the radioactivity in radii and ulnae, which lack marrow in adults, and assumed that the uptake per unit mass in bone of lumbar vertebrae was the same as that of the radii and ulnae. Uptake in red marrow of lumbar vertebrae was calculated as the total activity minus that estimated to be in bone. Based on these assumptions, we estimated that uptake of radioactivity in all red marrow of the adult male slowly accumulated and approached an asymptote of ∼4.7% injected activity at about 120 min.
The organs with the longest residence time (h) were liver (0.091), lung (0.039), brain (0.034), small intestine (0.032), and red marrow (0.019) (Table 1). The organs with the highest radiation doses (μGy/MBq) were: liver (16.2), small intestine (11.6), lungs (11.1), and kidneys (9.9; Table 2). The effective dose was 4.6 μSv/MBq.
Table 1.
Residence times of source organs determined from whole-body imaging of seven healthy subjects injected with 11C-MePPEP and seven healthy subjects injected with 18F-FMPEP-d2
| Organ | 11C-MePPEPa | 18F-FMPEP-d2 |
|---|---|---|
| Residence time (h) | Residence time (h) | |
| Mean ± SD | Mean ± SD | |
| Brain | 0.034±0.006 | 0.145±0.033 |
| Cortical bone | 0.011±0.004 | 0.082±0.025 |
| Gallbladder | 0.002±0.001 | 0.029±0.019 |
| Heart wall | 0.007±0.002 | 0.017±0.003 |
| Kidney | 0.009±0.003 | 0.034±0.007 |
| Liver | 0.091±0.025 | 0.161±0.043 |
| Lower large intestine | 0.000±0.000 | 0.012±0.003 |
| Lung | 0.039±0.007 | 0.095±0.051 |
| Red marrow | 0.019±0.002 | 0.198±0.075 |
| Small intestine | 0.032±0.013 | 0.123±0.027 |
| Spleen | 0.004±0.001 | 0.011±0.005 |
| Trabecular bone | 0.003±0.001 | 0.020±0.006 |
| Upper large intestine | 0.004±0.002 | 0.068±0.015 |
| Urinary bladderb | - | 0.119±0.026 |
| Remainder of body | 0.236±0.033 | 1.524±0.204 |
The residence time of 11 C-MePPEP in thyroid and lower large intestine is <0.001 h
Some organs could not be identified as source organs for both radioligands
Table 2.
Radiation dosimetry estimates for 11C-MePPEP and 18F-FMPEP-d2 each from seven healthy subjects
| Organ | 11C-MePPEP | 18F-FMPEP-d2 |
|---|---|---|
| μGy/MBq | μGy/MBq | |
| Mean ± SD | Mean ± SD | |
| Adrenals | 3.3±0.1 | 13.3±0.4 |
| Brain | 8.0±1.5 | 26.3±5.4 |
| Breasts | 1.8±0.1 | 7.8±0.4 |
| Gallbladder wall | 8.7±3.1 | 60.7±29.2 |
| LLI wall | 2.5±0.1 | 21.1±1.9 |
| Small intestine | 11.6±3.8 | 38.0±5.5 |
| Stomach | 2.5±0.1 | 11.9±0.5 |
| ULI wall | 5.4±1.2 | 41.4±6.2 |
| Heart wall | 7.5±1.2 | 17.0±1.8 |
| Kidneys | 9.9±2.3 | 28.7±3.8 |
| Liver | 16.2±4.2 | 25.5±5.5 |
| Lungs | 11.0±1.7 | 21.9±8.6 |
| Muscle | 2.0±0.1 | 9.9±0.4 |
| Ovaries | 2.8±0.2 | 16.4±0.9 |
| Pancreas | 3.2±0.0 | 13.6±0.4 |
| Red marrow | 4.1±0.2 | 24.5±5.2 |
| Bone surfaces | 4.7±0.4 | 26.7±3.0 |
| Skin | 1.5±0.1 | 7.2±0.5 |
| Spleen | 7.9±2.2 | 18.3±4.8 |
| Testes | 1.6±0.2 | 9.3±0.7 |
| Thymus | 2.1±0.2 | 9.7±0.5 |
| Thyroid | 4.5±1.7 | 9.3±0.7 |
| Urinary bladder walla | 2.0±0.2 | 66.2±11.4 |
| Uterus | 2.6±0.1 | 17.1±0.7 |
| Effective dose (μSv/MBq) | 4.6±0.3 | 19.7±2.1 |
LLI lower large intestine, ULI upper large intestine
Determined from the dynamic urinary bladder model with a voiding interval of 2.4 h
Biodistribution of 18F-FMPEP-d2
Brain, heart, lungs, liver, gallbladder, spleen, kidneys, lumbar vertebrae, intestine, and urinary bladder were visually identified on the images and treated as source organs of radioactivity for dosimetry calculations of 18F-FMPEP-d2 (Fig. 3). The liver had the highest uptake, with a peak of 20% of injected activity at ∼7 min. Similar to 11C-MePPEP, radioactivity peaked in the first image acquisition for lungs (14.5%), kidneys (5.0%), heart (3.1%), and spleen (3.1%) and decreased throughout the length of the scan (Fig. 4). Radioactivity accumulated slowly in brain (7.4%), small intestine (7.3%), gallbladder (2.2%), lumbar vertebrae (1.8%), and radii and ulnae (0.2%), with curves for these tissues peaking at 23 min for brain and after 100 min for the others.
Fig. 3.
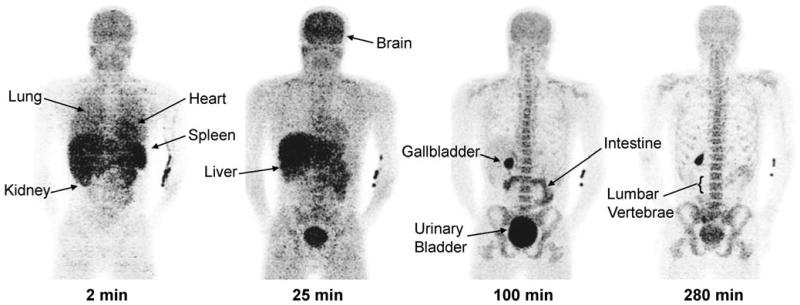
Maximum intensity projection images of a healthy male about 2, 25, 100, and 280 min after injection of 18F-FMPEP-d2
Fig. 4.
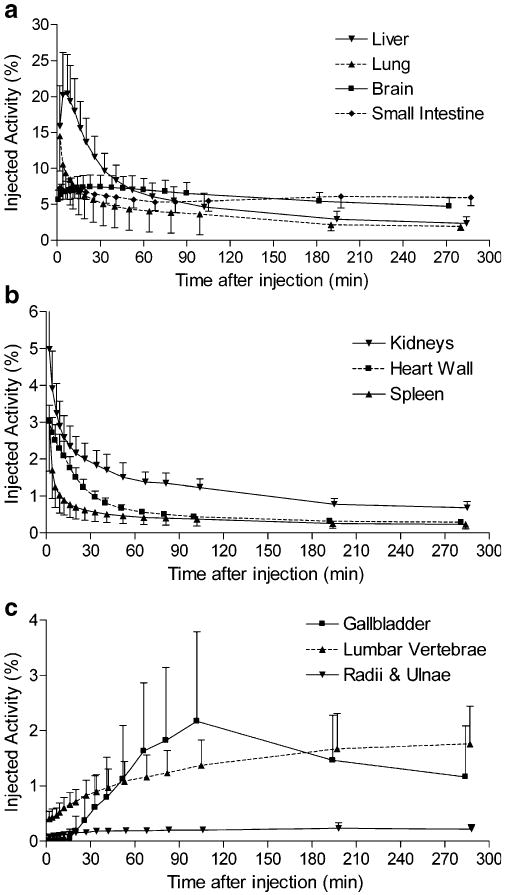
Uptake of radioactivity from 18F-FMPEP-d2 in organs that could be visually identified on whole-body images. Activity of organ is expressed as percentage of injected activity. Data are mean ± SD in seven subjects
Radioactivity was excreted through both urine and bile, since both urinary bladder and gallbladder showed high levels of radioactivity. Radioactivity in the images of the urinary bladder was combined with that directly measured in urine and fitted to a monoexponential curve. Based on this curve, 33±9% (n=7) of injected radioactivity was excreted via the urine at infinite time, and the half-life of excretion was 3.8±2.0 h (n=7, median 2.9; Fig. 5). However, the gallbladder was clearly visible in all subjects and reached a maximum of 2.2% injected activity within ∼102 min. Similar to 11C-MePPEP, the small intestine was visualized after radioactivity had accumulated in the gallbladder, suggesting that the bile containing radioactivity was excreted into the intestinal tract.
Fig. 5.
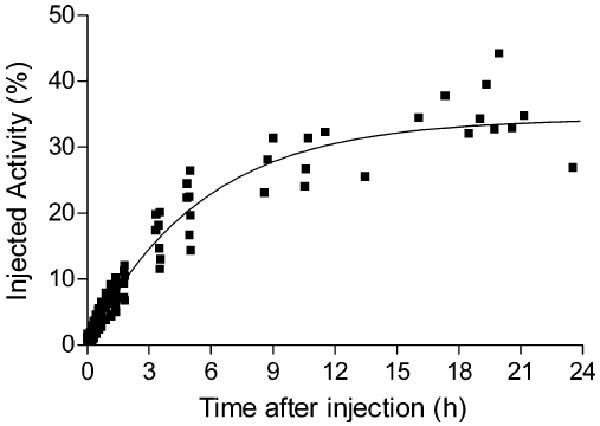
Cumulative radioactivity in urine identified in the urinary bladder with PET and directly measured in excreted urine after injection of 18F-FMPEP-d2. Decay-corrected data from all seven subjects was fitted to a single exponential curve. By this extrapolation, 34% of injected activity was excreted via urine, with a biological half-life of 3.8 h
Uptake in red marrow is difficult to calculate because it is located within bones, and 18F-labeled radioligands are often metabolized via defluorination, leading to bone uptake of 18F-fluoride ion. We estimated uptake in bone and red marrow as described for 11C-MePPEP and estimated that uptake of radioactivity in all red marrow of the adult male slowly accumulated and approached an asymptote of ∼14.6% injected activity by about 300 min.
The organs with the longest residence time (h) were red marrow (0.198), brain (0.145), liver (0.161), small intestine (0.123), and bone (0.102) (Table 1). Based on a 2.4-h interval for urinary voiding, the organs with the highest radiation doses (μGy/MBq) were: urinary bladder wall (66.2), gallbladder wall (60.7), upper large intestinal wall (41.4), and small intestinal wall (38.0) (Table 2). The effective dose was 19.7 μSv/MBq.
Discussion
Based on biodistribution data in human subjects, we estimated the effective dose to be 4.6 μSv/MBq for 11C-MePPEP and 19.7 μSv/MBq for 18F-FMPEP-d2. These effective doses are similar to those of other 11C- and 18F-labeled radioligands [11, 16]. For both radioligands, maximal uptake in brain was high (7–8% injected activity), occurred at ∼30–45 min, and thereafter washed out slowly. We estimate that the majority of the skeletal uptake of both radioligands is in red marrow rather than bone itself.
Uptake of radioactivity in bone and red marrow
In our prior brain imaging study using 18F-FMPEP-d2 in healthy subjects, the skull had moderate uptake of radioactivity and we were uncertain whether that uptake reflected bone or red marrow. The current study suggests that the majority of the radioactivity in skull came from red marrow. First, the whole-body images of 18F-FMPEP-d2 (Fig. 3) showed a distribution typical of that for red marrow with high concentrations in the central axial skeleton, especially vertebrae and pelvis. The uptake was not typical of 18F-fluoride ion, which concentrates at the ends of long bones in arms and legs and in ribs. In fact, we incorporated two deuteriums in FMPEP to decrease defluorination and found in monkeys that about one third less radioactivity resided in the mandible by the end of the 180-min scan compared to FMPEP without deuterium [10]. Second, both 11C-MePPEP and 18F-FMPEP-d2 had uptake typical of red marrow, suggesting that it was not merely the result of defluorination and uptake of 18F-fluoride in bone. Instead, the uptake could reflect binding of both parent radioligands to CB1 receptors known to exist in bone marrow where they are likely involved in hematopoiesis and are found on lymphocytes and dendritic cells [17–19]. In preliminary experiments with 11C-MePPEP in monkeys, we found that about 20% of uptake in lumbar vertebrae was blocked by receptor-saturating doses of a nonradioactive inverse agonist (unpublished data). Third, we estimated the distribution of radioactivity in bone and red marrow by comparing uptake in radii and ulnae, which lack marrow in adults, with that in lumbar vertebrae, which contain both components. By this estimation, uptake of radioactivity in red marrow at 120 min was 83% of total vertebral activity for 11C-MePPEP and 88% for 18F-FMPEP-d2. While we were careful to choose regions (radii and ulnae and lumbar vertebrae) with minimal confounding sources of radioactivity, this method is vulnerable to error due to extrapolation because these regions represent a small portion of the total bone (<5%) or bone marrow (<15%).
Because of the substantial uptake of radioactivity in red marrow, the dose (μGy/MBq) to this tissue was comparatively high: 4.1 for 11C-MePPEP and 24.5 for 18F-FMPEP-d2. As a comparison, the dose (μGy/MBq) to red marrow is 24.0 for 18F-fluorothymidine and 10.5 for 18F-fluorodopa [20, 21].
Biodistribution of 11C-MePPEP and 18F-FMPEP-d2
11C-MePPEP and 18F-FMPEP-d2 demonstrated similar time-activity curves for most organs in human; however, there were a couple of notable differences. First, 11C-MePPEP had no apparent excretion through the urinary bladder, whereas ∼33% of radioactivity from 18F-FMPEP-d2 was excreted in urine. On the other hand, by the end of the scan only ∼9% of radioactivity from 11C-MePPEP and ∼7% of radioactivity from 18F-FMPEP-d2 was accounted for in the gallbladder and intestine combined. While these are different chemical compounds and their metabolism could be different, they have a high structural similarity and may undergo similar metabolic pathways. Thus, it is possible that the fluorine atom causes the creation of a hydrophilic radiometabolite which is excreted in urine, whereas a similar metabolite does not exist for 11C-MePPEP or is converted into 11C-CO2 and expired through the lungs. We also consistently noted uptake of radioactivity from 11C-MePPEP, but not 18F-FMPEP-d2, in thyroid, although it was a small contributor to the effective dose (5%).
Although much interest has been paid toward imaging CB1 receptors in the brain for drug occupancy or potentially studying neuropsychiatric diseases, CB1 receptors are found throughout the body where they may contribute to other pathophysiologies. For example, CB1 receptors are upregulated by at least two to three times in liver fibrosis [22, 23] and as much as several thousand times in rhabdomyosarcoma [24]. The ability of either 11C-MePPEP or 18F-FMPEP-d2 for imaging CB1 receptors in liver or intestines is likely to be confounded by the high hepatobiliary excretion of radioactivity. Nevertheless, the extremely large upregulation of CB1 receptors in disease states may provide an adequate signal with focal intensity.
One other CB1-selective PET tracer, 18F-MK-9470, has been reported with dosimetry and biodistribution data [25]. When compared to 18F-FMPEP-d2, 18F-MK-9470 demonstrates similar organ distribution and elimination with more predominant hepatobiliary elimination. 18F-MK-9470 has a slightly higher effective dose than 18F-FMPEP-d2 (22.8 vs 19.7 μSv/MBq, respectively).
Conclusion
The effective doses of 11C-MePPEP and 18F-FMPEP-d2 are similar to other 11C- and 18F-labeled radioligands. Brain uptake of both radioligands is high and prolonged. These radioligands may be useful to image CB1 receptors in the periphery, although additional studies are required to determine whether uptake reflects binding of parent radioligand rather than merely accumulation of radiometabolites.
Acknowledgments
We thank Maria D. Ferraris Araneta, William C. Kreisl, Barbara Scepura, Gerald Hodges, Amanda Farris, and Leah Dickstein for subject recruitment and care; Robert Gladding for his assistance in image processing; the NIH PET Department for imaging; and PMOD Technologies for providing its image analysis and modeling software. This research was supported by a Cooperative Research and Development Agreement with Eli Lilly and by the Intramural Program of NIMH (projects # Z01-MH-002852-04 and #Z01-MH-002793-06). Jussi Hirvonen was supported by personal grants from The Academy of Finland, The Finnish Cultural Foundation, The Finnish Foundation for Alcohol Studies, The Finnish Medical Foundation, The Instrumentarium Foundation, The Jalmari and Rauha Ahokas Foundation, The Paulo Foundation, The Research Foundation of Orion Corporation, and The Yrjö Jahnsson Foundation.
Footnotes
Conflicts of interest None.
Contributor Information
Garth E. Terry, Email: gartht@mail.nih.gov, Molecular Imaging Branch, National Institute of Mental Health, 31 Center Drive, Bethesda, MD 20892-2035, USA; Department of Clinical Neuroscience, Psychiatry Section, Karolinska Institutet, Stockholm, Sweden.
Jussi Hirvonen, Molecular Imaging Branch, National Institute of Mental Health, 31 Center Drive, Bethesda, MD 20892-2035, USA.
Jeih-San Liow, Molecular Imaging Branch, National Institute of Mental Health, 31 Center Drive, Bethesda, MD 20892-2035, USA.
Nicholas Seneca, Molecular Imaging Branch, National Institute of Mental Health, 31 Center Drive, Bethesda, MD 20892-2035, USA.
Johannes T. Tauscher, Lilly Research Laboratories, Lilly Corporate Center, Indianapolis, IN, USA
John M. Schaus, Lilly Research Laboratories, Lilly Corporate Center, Indianapolis, IN, USA
Lee Phebus, Lilly Research Laboratories, Lilly Corporate Center, Indianapolis, IN, USA.
Christian C. Felder, Lilly Research Laboratories, Lilly Corporate Center, Indianapolis, IN, USA
Cheryl L. Morse, Molecular Imaging Branch, National Institute of Mental Health, 31 Center Drive, Bethesda, MD 20892-2035, USA
Victor W. Pike, Molecular Imaging Branch, National Institute of Mental Health, 31 Center Drive, Bethesda, MD 20892-2035, USA
Christer Halldin, Department of Clinical Neuroscience, Psychiatry Section, Karolinska Institutet, Stockholm, Sweden.
Robert B. Innis, Email: robert.innis@nih.gov, Molecular Imaging Branch, National Institute of Mental Health, 31 Center Drive, Bethesda, MD 20892-2035, USA.
References
- 1.Piomelli D. The molecular logic of endocannabinoid signalling. Nat Rev Neurosci. 2003;4:873–84. doi: 10.1038/nrn1247. [DOI] [PubMed] [Google Scholar]
- 2.Glickfeld LL, Scanziani M. Self-administering cannabinoids. Trends Neurosci. 2005;28:341–3. doi: 10.1016/j.tins.2005.05.001. [DOI] [PubMed] [Google Scholar]
- 3.Basavarajappa BS. The endocannabinoid signaling system: a potential target for next-generation therapeutics for alcoholism. Mini Rev Med Chem. 2007;7:769–79. doi: 10.2174/138955707781387920. [DOI] [PMC free article] [PubMed] [Google Scholar]
- 4.Eggan SM, Hashimoto T, Lewis DA. Reduced cortical cannabinoid 1 receptor messenger RNA and protein expression in schizophrenia. Arch Gen Psychiatry. 2008;65:772–84. doi: 10.1001/archpsyc.65.7.772. [DOI] [PMC free article] [PubMed] [Google Scholar]
- 5.Kunos G, Osei-Hyiaman D, Batkai S, Sharkey KA, Makriyannis A. Should peripheral CB(1) cannabinoid receptors be selectively targeted for therapeutic gain? Trends Pharmacol Sci. 2009;30:1–7. doi: 10.1016/j.tips.2008.10.001. [DOI] [PMC free article] [PubMed] [Google Scholar]
- 6.Caraceni P, Domenicali M, Giannone F, Bernardi M. The role of the endocannabinoid system in liver diseases. Best Pract Res Clin Endocrinol Metab. 2009;23:65–77. doi: 10.1016/j.beem.2008.10.009. [DOI] [PubMed] [Google Scholar]
- 7.Mukhopadhyay P, Mohanraj R, Bátkai S, Pacher P. CB1 cannabinoid receptor inhibition: promising approach for heart failure? Congest Heart Fail. 2008;14:330–4. doi: 10.1111/j.1751-7133.2008.00016.x. [DOI] [PMC free article] [PubMed] [Google Scholar]
- 8.Donohue SR, Krushinski JH, Pike VW, Chernet E, Phebus L, Chesterfield AK, et al. Synthesis, ex vivo evaluation, and radiolabeling of potent 1, 5-diphenylpyrrolidin-2-one cannabinoid subtype-1 receptor ligands as candidates for in vivo imaging. J Med Chem. 2008;51:5833–42. doi: 10.1021/jm800416m. [DOI] [PMC free article] [PubMed] [Google Scholar]
- 9.Terry GE, Liow JS, Zoghbi SS, Hirvonen J, Farris AG, Lerner A, et al. Quantitation of cannabinoid CB1 receptors in healthy human brain using positron emission tomography and an inverse agonist radioligand. Neuroimage. 2009;48:362–70. doi: 10.1016/j.neuroimage.2009.06.059. [DOI] [PMC free article] [PubMed] [Google Scholar]
- 10.Terry GE, Hirvonen J, Liow JS, Zoghbi SS, Gladding R, Tauscher JT, et al. Imaging and quantitation of cannabinoid CB1 receptors in human and monkey brains using (18)F-labeled inverse agonist radioligands. J Nucl Med. 2010;51:112–20. doi: 10.2967/jnumed.109.067074. [DOI] [PMC free article] [PubMed] [Google Scholar]
- 11.Sprague DR, Chin FT, Liow JS, Fujita M, Burns HD, Hargreaves R, et al. Human biodistribution and radiation dosimetry of the tachykinin NK1 antagonist radioligand [18F]SPA-RQ: comparison of thin-slice, bisected, and 2-dimensional planar image analysis. J Nucl Med. 2007;48:100–7. [PMC free article] [PubMed] [Google Scholar]
- 12.ICRP. A report of age- and gender-related differences in the anatomical and physiological characteristics of reference individuals. Oxford: Pergamon; 2002. ICRP publication 89: Basic anatomical and physiological data for use in radiological protection: reference values. [PubMed] [Google Scholar]
- 13.ICRP. ICRP publication 23: Report of the Task Group on Reference Man. Oxford: Pergamon; 1975. [Google Scholar]
- 14.ICRP. ICRP publication 30 part 1: Limits for intakes of radionuclides by workers. Oxford: Pergamon; 1979. [Google Scholar]
- 15.Stabin MG, Sparks RB, Crowe E. OLINDA/EXM: the second-generation personal computer software for internal dose assessment in nuclear medicine. J Nucl Med. 2005;46:1023–7. [PubMed] [Google Scholar]
- 16.Brown AK, Fujita M, Fujimura Y, Liow JS, Stabin M, Ryu YH, et al. Radiation dosimetry and biodistribution in monkey and man of 11C-PBR28: a PET radioligand to image inflammation. J Nucl Med. 2007;48:2072–9. doi: 10.2967/jnumed.107.044842. [DOI] [PubMed] [Google Scholar]
- 17.Patinkin D, Milman G, Breuer A, Fride E, Mechoulam R. Endocannabinoids as positive or negative factors in hematopoietic cell migration and differentiation. Eur J Pharmacol. 2008;595:1–6. doi: 10.1016/j.ejphar.2008.05.002. [DOI] [PubMed] [Google Scholar]
- 18.Galiegue S, Mary S, Marchand J, Dussossoy D, Carriere D, Carayon P, et al. Expression of central and peripheral cannabinoid receptors in human immune tissues and leukocyte subpopulations. Eur J Biochem. 1995;232:54–61. doi: 10.1111/j.1432-1033.1995.tb20780.x. [DOI] [PubMed] [Google Scholar]
- 19.Do Y, McKallip RJ, Nagarkatti M, Nagarkatti PS. Activation through cannabinoid receptors 1 and 2 on dendritic cells triggers NF-kappaB-dependent apoptosis: novel role for endogenous and exogenous cannabinoids in immunoregulation. J Immunol. 2004;173:2373–82. doi: 10.4049/jimmunol.173.4.2373. [DOI] [PubMed] [Google Scholar]
- 20.Vesselle H, Grierson J, Peterson LM, Muzi M, Mankoff DA, Krohn KA. 18F-Fluorothymidine radiation dosimetry in human PET imaging studies. J Nucl Med. 2003;44:1482–8. [PubMed] [Google Scholar]
- 21.Brown WD, Oakes TR, DeJesus OT, Taylor MD, Roberts AD, Nickles RJ, et al. Fluorine-18-fluoro-L-DOPA dosimetry with carbidopa pretreatment. J Nucl Med. 1998;39:1884–91. [PubMed] [Google Scholar]
- 22.Bátkai S, Jarai Z, Wagner JA, Goparaju SK, Varga K, Liu J, et al. Endocannabinoids acting at vascular CB1 receptors mediate the vasodilated state in advanced liver cirrhosis. Nat Med. 2001;7:827–32. doi: 10.1038/89953. [DOI] [PubMed] [Google Scholar]
- 23.Teixeira-Clerc F, Julien B, Grenard P, Tran Van Nhieu J, Deveaux V, Li L, et al. CB1 cannabinoid receptor antagonism: a new strategy for the treatment of liver fibrosis. Nat Med. 2006;12:671–6. doi: 10.1038/nm1421. [DOI] [PubMed] [Google Scholar]
- 24.Oesch S, Walter D, Wachtel M, Pretre K, Salazar M, Guzmán M, et al. Cannabinoid receptor 1 is a potential drug target for treatment of translocation-positive rhabdomyosarcoma. Mol Cancer Ther. 2009;8:1838–45. doi: 10.1158/1535-7163.MCT-08-1147. [DOI] [PubMed] [Google Scholar]
- 25.Van Laere K, Koole M, Sanabria Bohorquez SM, Goffin K, Guenther I, Belanger MJ, et al. Whole-body biodistribution and radiation dosimetry of the human cannabinoid type-1 receptor ligand 18F-MK-9470 in healthy subjects. J Nucl Med. 2008;49:439–45. doi: 10.2967/jnumed.107.047290. [DOI] [PubMed] [Google Scholar]