

Abstract
Electron paramagnetic resonance (EPR) spectroscopy has been used in a number of ways to study nitric oxide chemistry and biology. As an intrinsically stable and relatively unreactive diatomic free radical, the challenges for detecting this species by EPR are somewhat different than those for transient radical species. This review gives a basic introduction to EPR spectroscopy and discusses its uses to assess and quantify nitric oxide formation in biological systems.
1. Introduction
Electron paramagnetic resonance (EPR) spectroscopy (also referred to as electron spin resonance - ESR - and occasionally electron magnetic resonance -EMR) is a technique that detects paramagnetic species. These include any atom, molecule or complex with one or more unpaired electrons. While this definition includes diatomic free radicals such as nitric oxide (NO) and superoxide, in practice, for a number of reasons, it is not possible to directly detect these species in any meaningful biological situation. Consequently a number of techniques have been developed to detect such species and these techniques are often gathered under the term ‘spin-trapping’. In this review I will discuss the various methods that have been used to detect NO by EPR spectroscopy and also discuss endogenous NO-derived EPR signals that have been observed in biological systems.
2. EPR Spectroscopy for the p-chem impaired
While a thorough understanding of quantum mechanics may be essential in order to understand the fundamental origin of the EPR signal it is not required to comprehend how EPR spectroscopy can be useful for the detection and quantification of free radical species and metalloprotein complexes in biological systems. As such (with apologies to my biophysics colleagues) here is a description of how EPR works.
Unpaired electrons are spinning charges (hence the preponderance of the word ‘spin’ in EPR) and a spinning charge generates a magnetic field. Consequently, each unpaired electron is a magnetic dipole (something like a tiny bar magnet with a ‘North’ and ‘South’ pole). Magnetic dipoles align themselves along magnetic fields (this is what makes a compass needle point to magnetic north) or stated another way; the presence of an external magnetic field creates a situation in which it is energetically favorable for the dipole to point in a particular direction. In order to rotate the dipole (rotate the compass needle away from pointing north) energy has to be applied. While it is possible to force a compass needle to any angle away from north and so generate a continuum of energetic states, the magnetic dipole of an electron can only take on two energy states (it is quantized). Consequently, the amount of energy required to flip the electron from its favorable direction to its unfavorable direction is a discrete value. It follows that if you supply this discrete amount of energy the system will absorb the energy as the electrons are flipped, and the detection of this absorbed energy is the basis of the EPR signal. For an electron in a magnetic field of about 0.35 T or 3500 G1, the energy required is in the X-band microwave range (about 9.5 GHz), and most spectrometers operate in this range (hence ‘X-band EPR’). The EPR spectrometer is basically a machine that shines microwave radiation on a sample and measures how much of that radiation is absorbed by the sample as a function of externally applied magnetic field. The fundamental equation of EPR spectroscopy is shown in equation 1, where ν is the frequency of the microwaves, h is Plank's constant, B is the external
| [1] |
magnetic field, β is another constant referred to as the Bohr magneton, and g is a dimensionless constant that is characteristic of the sample under study. To take an EPR spectrum, the microwave frequency (ν) is held constant and the magnetic field is swept across the desired range. When this equation is true (referred to as the resonance condition), energy will be absorbed. The detection of absorbed microwave energy as a function of magnetic field is referred to as the continuous wave EPR spectrum as shown in Figure 1A. There are two important things to notice about Figure 1A. First, there is no y-axis. The intensity of an EPR spectrum is measured on a machine-dependent arbitrary scale, and so the y-axis is usually omitted. Second, the spectrum is a first derivative. Due to the way the EPR spectrum is detected, the readout from the detector is a first derivative of the absorption spectrum. With modern computation power it is trivial to integrate this signal to get back to the absorption spectrum (Figure 1B), but the first derivative representation has become the standard way to present EPR data and most EPR spectra are presented in this format. For quantitative purposes, it is the area under the absorption spectrum (Figure 1B) that is proportional to the number of unpaired electrons in the sample. As a result the first derivative spectrum needs to be integrated twice (once to get the absorption spectrum and once again to get the area under the absorption spectrum) and compared with a standard in order to determine the concentration of unpaired electrons. For accurate quantification it is important to use a stable radical standard that exhibits an absorption at a similar magnetic field (i.e. a similar g-value) to the sample.
Figure 1. Single-line EPR spectrum displayed as both a first derivative (upper) and absoption spectrum (lower).

Spectra are simulations created using WinSim.
Each feature of an EPR spectrum can be defined by a specific value of g (or ‘g-value’). As can be seen from Equation 1, h and β are fundamental constants and ν is held constant for the experiment, and so H is inversely proportional to g. As H increases, g decreases. For this reason features at high magnetic field have low g-values and features at low magnetic field have high g-values. Although the g-value (or more correctly the g-tensor, as it is directional) is a fundamental property of the unpaired electron(s) under study, it is conventional to refer to parts of the EPR spectrum as (for example) the ‘g=6 region’ or the ‘g=2 region’. One g value that is of particular interest is that of the free electron, which has a value of 2.0023. The difference in g-value between an unpaired electron in an atom/molecule and the free electron can give important information about the magnetic properties of the microenvironment of the unpaired electron. The EPR spectrum also reports the presence of paramagnetic nuclei in the vicinity of the unpaired electron. Such nuclei (which include the proton, and the 14N nucleus as the two most common in biological molecules) also have spin and are contain one or more tiny quantum mechanical magnets that can only point in one of two directions. So the presence of these nuclei can either add or subtract from the external magnetic field applied by the spectrometer. The result of this is that the actual magnetic field experienced by the unpaired electron may not be the field you apply but may be either more or less than this depending on orientation of the local magnetic nuclei. As an example, a proton nucleus in close association with the unpaired electron will have the effect of adding or subtracting from the magnetic field experienced by the electron. Due to the fact that approximately half of the magnetic dipoles generated by the protons will be aligned with the external field and half will be aligned against the field, the effect will be that about half of the unpaired electrons will experience a larger magnetic field and half will experience a lower magnetic field than expected. The result of this is that the resonance condition described by equation 1 will be true at different values of H for these two populations and so instead of a single EPR feature there will be two of roughly equal intensity (Figure 2A). This effect is referred to as the hyperfine effect and is usually reported as the difference in magnetic field between the two EPR features (i.e. aH=6.2 G means that that the two EPR lines are 6.2 G apart and is referred to as the hyperfine splitting constant2). The g value, in this case, will be the point equidistant between the two EPR lines. The nitrogen nucleus is a slightly different case as each nucleus can be thought of as containing two of these tiny quantum mechanical magnets. Consequently you have three possible combinations of alignment that are approximately equally populated; namely both aligned with the field, both aligned against the field and one with and one against the field. In the latter case the contribution to the external field will be zero, and so the effect will be to generate 3 EPR features of equal intensity, with the middle one positioned at the g-value (Figure 2B). From this discussion it can be seen that a combination of magnetic nuclei will rapidly multiply the number of EPR features and this gives rise to complex hyperfine splitting patterns. For example 5 protons will give rise to 32 EPR lines some of which may completely or partially overlap. In order to aid interpretation of complex EPR spectra and also to help examination of situations where more than one radical species is present in the experiment, spectral simulation tools have been developed such as the WinSim program developed at NIEHS to analyze isotropic spectra [1].
Figure 2. The effect of magnetic nuclei on the EPR spectrum showing the hyperfine interaction.

A) The effect of nucleus with nuclear Spin of one half. B) The effect of a nucleus with a nuclear spin of 1. Spectra are simulations created using WinSim.
Both the g-value and the hyperfine splitting constants are tensors, in that they have a different value in every direction. If the molecule is freely diffusing, these values average out to single directionless values (referred to as the isotropic value). However, in frozen solution, the molecule orientations will be random and fixed, such that all possible values will be present in the spectrum (referred to as a powder spectrum). In this case, the g-value and the hyperfine constant are given as three orthogonal values in the x, y and z directions (e.g. gx, gy and gz). In metal complexes, depending on the symmetry of the complex, the values in the x and y direction can be identical giving only two values that are referred to as g-perpendicular and g-parallel. These terms are often used to describe the EPR spectra of NO/metal complexes as will be seen later.
This background information is simplistic and incomplete but should be sufficient to understand the following discussion. For a more complete and robust description of EPR spectroscopy the reader is referred to the following texts [2,3].
3. The utility of EPR as an NO detection strategy
As NO is a diatomic free radical, it is possible to observe it directly by EPR. While this has been done in the gas phase for example in the measurement of NO in polluted air [4], in the liquid phase the EPR signal is broad and insensitive. It is consequently not feasible to directly observe NO by EPR in any biologically meaningful experiment. The steady-state levels of NO in biological systems are below the detectable limit of EPR and so any method needs to either trap NO to form an EPR detectable product or otherwise exploit the unique chemistry of NO to the same end. Several strategies have been developed to trap and detect nitric oxide by EPR. In what may be termed ‘conventional spin-trapping’, a high concentration of a diamagnetic spin-trap is used to react with and detect the presence of a transient reactive free radical [5]. For example the nitrone DMPO can be used to trap superoxide, hydroxyl, glutathionyl radicals to give radical adducts with unique spectra. NO, however, is not a transient radical in the same sense of (for example) superoxide, in that it is intrinsically stable and it is very selectively reactive. NO will not directly react with conventional nitrone-based spin-traps to form spin-adducts. It has been shown to react with aci-anion of nitromethane, but this only has utility at very high pH [6]. Instead, EPR approaches to NO detection have focused on either its selective reactivity with other radicals, or on its ability to coordinate with iron ions.
It is worth asking the question whether EPR provides advantages over other methods for NO detection. The seminal advantage of EPR is that it can directly and unambiguously detect unpaired electrons and EPR techniques attempt to capitalize on the paramagnetic nature of NO to provide the signal. However, other methods of NO detection (spectrophotometric, electrochemical, chemiluminescence) are often more direct, more sensitive, and may not require specialized equipment. So why use EPR? Two major advantages are evident. The first is that EPR only detects paramagnetic material, and so can be performed in optically opaque and turbid solutions. This is a very useful advantage in biological matrices as measurements can be done in the presence of cells/tissues. The second is that in some methods, the paramagnetic signature of the EPR-detectable NO-derived product is influenced by the hyperfine splitting from the nitrogen nucleus of the original NO. Consequently, nitrogen isotope substitution can be used to examine the source of NO. If for example, there was some doubt as to whether NO was derived from L-arginine from nitrite, or from some other source, appropriate 15N-labelled version of the progenitor compounds can be used to see how they influence the EPR-detectable product [7-9].
Of course one of the major uses of EPR in NO research is to study endogenous NO-derived paramagnetic species. It has been known for many years that NO is able to generate several paramagnetic species in cells, particularly nitrosyl hemes and dinitrosyl iron complexes [10,11]. In some cases these species are only defined by their EPR spectrum. Consequently EPR should not be thought of as simply an NO measurement technique, but rather as a part of the armamentarium necessary to fully characterize NO-derived products in biological systems.
4. Nitronyl Nitroxides
Nitronyl nitroxides (NNO), or imidazolinoxyl-N-oxides, were first synthesized in the 1970's as small molecule spin labels [12]. It was noted in these early studies that nitrous acid and nitric oxide were able to convert the nitronyl nitroxide to a corresponding immino nitroxide (INO) as shown below [13]. Nadeau and Boocock [14] proposed in 1977 that these reagents could be used as solid-phase dosimiters of atmospheric nitric oxide formation. After nitric oxide was discovered to be an important mammalian signaling molecule, it was soon realized that these compounds may have significant utility as both NO detectors and NO scavengers [15,16]. The most common commercially available compound is 2-(4-carboxyphenyl)-4,5-dihydro-4,4,5,5, tetramethyl-1H- imidazoyl-1-oxyl-3-oxide (CPTIO). The use of these compounds as EPR-sensitive NO detectors derives from the chemistry shown in Figure 3. The nitronyl nitoxide contains an unpaired electron in a ring with two nitrogen nuclei. As the nitrone and the nitroxide are conjugated through a double bond, the unpaired electron density is equally distributed over both nitrogen nuclei. As discussed above, each nitrogen nucleus should split the EPR signal by 3, giving a total of 9 EPR lines. However, because, the nuclei are equivalent, the hyperfine splitting constant is the same for both nitrogens there is total overlap of the central lines giving rise to a characteristic 5-line 1:2:3:2:1 intensity pattern (Figure 3). When NO reacts with the nitronyl nitroxide to generate an immino nitroxide, the equivalence of the two nitrogens is lost, unpaired electron density is greater on the nitroxide nitrogen and the hyperfine splitting constants for the two nitrogens are no longer equal. Now, although the spectrum still contains 9 lines, they overlap in a more complex way giving rise to spectra similar to the one shown in Figure 3 (each NNO will give a different pattern depending on the value of the two nitrogen hyperfine splitting constants). Consequently the EPR detection of NO using NNO depends upon observing a change in spectrum from the 5-line pattern to the more complex pattern. This has the advantage that you can observe both the loss of the NNO and the formation of the INO in real time and so observe the kinetics of NO formation. However this method also has the major disadvantage that you have to carefully select the amount of NNO to use. If, for example, you use a much higher concentration of NNO than you expect NO to be generated then the EPR spectrum will be dominated by the NNO spectrum at all time points and it may be difficult to see the small amount of INO formed against a large background of NNO. The rate constant between NO and various NNOs are around 1000 M-1s-1 and so relatively high concentrations may need to be used to compete with other targets of NO (e.g. heme iron).
Figure 3. Nitronyl nitroxides as NO detectors/scavengers.
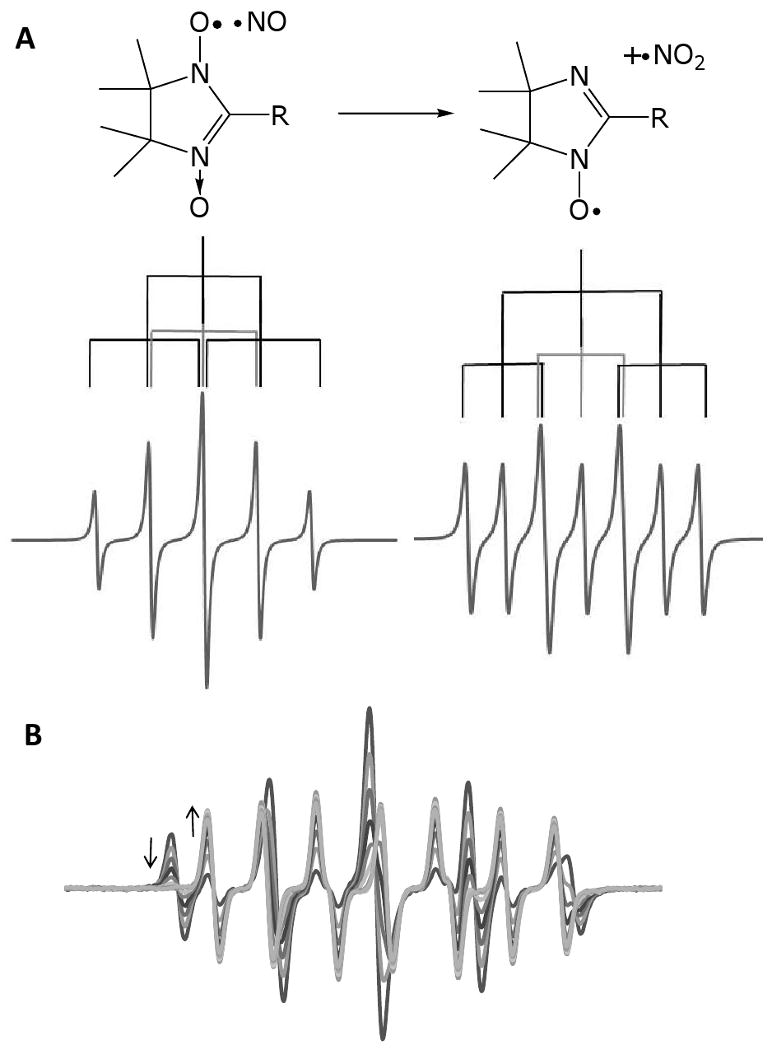
A) Reaction of nitronyl nitroxide with NO showing conversion to an immino nitroxide and nitrogen dioxide. B) Typical EPR spectral changes that occur upon reaction of a nitronyl nitroxide with NO.
As shown in Figure 3, the products of the reaction between NO and NNO are shown to be INO and nitrogen dioxide. It was determined that the stiochiometry of the reaction between NO and NNO was 2:1 [17], and this was explained by the fact that the nitrogen dioxide can trap another molecule of NO to form N2O3 which subsequently hydrolyzed to from nitrite [15]. This mechanism had the potential consequence that NNO could enhance nitrosation chemistry by catalyzing the formation of N2O3. More recently, however, this mechanism has been reassessed, and a hitherto unrecognized reaction between NNO and nitrogen dioxide has been reported that forms NNO+, an EPR silent one-electron oxidized product of NNO [18]. The reported mechanism of the reaction NNO with NO is shown in equations 2-4 and
| [2] |
| [3] |
| [4] |
show that NNO+ can be rapidly re-reduced to NNO by nitric oxide. The result of reactions 3 and 4 is that the NO2 from reaction 1 is scavenged without affecting the 2:1 reaction stoichiometery. N2O3 is unlikely to be a product of this reaction, except at very low concentrations of NNO that would allow the reaction between NO and NO2. A recent study has confirmed experimentally that at low concentrations of CPTIO, this compound can promote S-nitrosation, but at higher concentrations S-nitrosation is inhibited [19].
Although the NNOs are potentially very useful as NO detectors, several factors weigh against their use in biological systems. The major one is that both the reactant and product nitroxides are relatively easily reduced to EPR silent hydroxylamines by biological reducing agents (in particular ascorbate) and so the EPR signals diminish rapidly with time. We have observed that because NNOs are good one-electron acceptors they can have some rather unexpected effects. For example, SIN-1, in oxygenated solution will reduce oxygen to superoxide to generate and intermediate which releases NO. As NO and superoxide rapidly combine to form peroxynitrite, this compound has been used as a peroxynitrite donor [20,21]. It might be expected that NNO would scavenge the NO and convert SIN-1 into a superoxide donor. However, it turns out that both INO and NNO can replace oxygen as the electron acceptor for SIN-1, and so paradoxically, NNO converts SIN-1 into a pure NO donor [22].
NNOs, and CPTIO in particular, are now mainly used as NO scavengers rather than EPR-sensitive NO detectors, except in chemical systems, and their utility in biological systems for quantitative detection of NO is limited.
5. Iron dithiocarbamate-based NO traps
NO will coordinate with both ferric and ferrous iron to form complexes with variable stability. Many such complexes exhibit EPR signals and so iron has been utilized in several ways as a spin-trap for NO. Unlike NNO-based detection, the atoms of NO are a part of the EPR-detectable nitrosyl complex and consequently isotopic substitution of nitrogen (and potentially oxygen) can be used to confirm the involvement of NO in the formation of the spin-adduct.
The original work in this area was conducted with iron complexes of diethyldithiocarbamate [23,24] (Figure 4). The ferrous iron complex is insoluble in aqueous media and yeast membranes were used to carry the complex. More water soluble analogues, such as N-methyl-D-glucamine dithiocarbamate (MGD) have been extensively utilized for the biological detection of NO in vitro and in vivo [25]. At 37° C, the NO complex exhibits a three-line signal, with a g value of 2.035. The three lines derive from the hyperfine splitting of the nitric oxide 14N nucleus, and substitution with 15N generates a two-line spectrum. In the frozen state the spectrum broadens and the g-tensor resolves to perpendicular and parallel components, but the nitrogen hyperfine can still be observed. One of the major advantages of using iron as a spin trap is that it will generally react with NO extremely rapidly. NO will bind to dithiocarbamate complexes with rate constants of between 1 and 5 × 10⁸ M-1s-1. Not only therefore will the spin-trap effectively compete with other reactions of NO, but in principal it should be possible to use much lower concentrations of trap than have been traditionally employed in spin-trapping experiments. The use of dithiocarbamates as NO spin traps has recently been reviewed [26].
Figure 4. The Iron dithiocarbamate/NO complex, and the structure of the more water soluble ligand MGD.

The wide-spread use of this technique has led dithiocarbamate-based spin-trapping to receive significant scrutiny in the literature. One of the major limitations of this method is that the spin-trap is air sensitive and should be synthesized in deoxygenated solutions [27], usually at a ratio of about 1 iron: 5 ligand. Oxygen-dependent oxidation of the iron dithioncarbamate complex has been reported to occur with second order rate constant of 5 × 10⁵ M-1s-1 and gives rise to a ferric complex, and also to reactive oxygen species [27]. Not only could these reactive species represent an increase in oxidative stress to the system under study, they could also scavenge NO and prevent it from being detected. The quasi-stable nature of the spin-trap in oxygenated solution makes quantification of NO production particularly troublesome. In a prime example of a situation where the addition of the trap changes the outcome, the oxidant(s) generated from the oxidation of the iron complex result in the oxidative generation of NO from hydroxyurea [27] which was then detectable by the trap. As well as NO, iron-dithiocarbamate complexes have been shown to detect HNO [28], nitrite [29] and S-nitrosothiols [29]. HNO can react with the ferric iron complex to make the ferrous ntirosyl product, and both nitrite and S-nitrosothiols can be reduced by the ferrous complex to form NO. Although these reactions are slow compared to the very rapid coordination of NO with ferrous iron, care needs to be taken to distinguish between these possible sources of signal. On the other hand, if the formed EPR signal is inhibitable by a nitric oxide synthase (NOS) inhibitor, the signal could be regarded as an integration of several NOS-derived products; a valuable observable.
As in most methods, dithiocarbamate trapping provides a useful tool to examine NO formation as long as the potential problems and artifacts are understood and examined.
6. Hemoglobin and myoglobin
The reactions of hemoglobin with NO have been known for decades, and NO-bound forms of hemoglobin have been important in elucidating conformation transitions of this protein [30-32]. In addition, hemoglobin-dependent scavenging has been used as one of the diagnostic tests of an NO-dependent process. Two reactions are of interest in EPR studies. The first is shown in Equation 5.
| [5] |
Oxygenated hemoglobin (and myoglobin) reacts with NO to generate metHemoglobin (metHb), where the heme iron is in the ferric oxidation state, and nitrate [33]. This change can be detected spectrophotometrically, as both HbO2 and metHb have characteristic absorption spectra between 350 and 700 nm, and this method has been routinely used to calibrate NO solutions and quantify NO formation [34]. From an EPR perspective this reaction is interesting as metHb is paramagnetic and can be detected in the g=6 region of the spectrum away from most other EPR signals which cluster around g=2 (see figure 5A). What is in fact observed is the low field (gx,y) line of high spin aquo-metHb. The major disadvantage is that this signal can only be observed at low temperatures in the frozen state (∼100 K, although much better signal to noise is obtained at ∼5 K) and so this cannot be used to monitor NO formation in real time. However, as mentioned above, EPR can be used in situations where spectrophotometry is difficult if not impossible, such as in whole blood samples. We have observed increases in the metHb signal in whole blood in response to NO inhalation in humans [35] and it is possible that metHb can be used as an approximate dosimeter of NO exposure in whole blood. One problem with this is that red cells contain approximately 1-2% metHb under normal conditions (a concentration of about 100 μM in whole blood), so small changes will be lost in the background. In addition, metHb is slowly reduced to the ferrous form by cellular meHb reductase activity. In contrast, plasma contains negligible metHb under normal conditions, and nanomolar changes in metHb levels can be observed. We have used this to examine plasma metHb levels in sickle cell disease, a hemolytic pathology, in the presence and absence of NO inhalation [36].
Figure 5. EPR spectra of metHb and HbNO.

A) MetHb was prepared by incubating human oxyHb with ferricyanide followed by purification on sephadex G25 size exclusion chromatography. The metHb was placed in an EPR tube frozen. The EPR spectrum was taken at 5K using the following EPR parameters. B) EPR spectra of HbNO. EPR spectra of HbNO consist of a superposition of at least three EPR spectra. These derive from the β-chain heme iron-NO complex, the α-chain heme iron NO complex in a 6-coordinate geometry (T-state) and the α-chain heme iron complex in a 5-coordinate geometry (R-State). (Adapted from a Figure originally published in The Journal Of Biological Chemistry Piknova, B., Gladwin, M.T., Schechter, A. N., and Hogg, Nl. Electron paramagnetic resonance analysis of nitrosylhemoglobin in humans during NO inhalation. J. Biol. Chem. 280, 40583-40588. 2005. © the American Society for Biochemistry and Molecular Biology.
Although NO will bind to metHb to make a ferric nitrosyl complex, the binding is very weak. Formation of ferric nitrosyl Hb is therefore only likely to be an issue at high non-physiological NO levels.
| [6] |
In the second reaction of interest, NO will bind tightly to deoxygenated ferrous hemoglobin to form HbNO (Equation 6), and EPR-detectable paramagnetic complex. This complex is relatively stable with a very slow off rate. HbNO has been observed in humans after NO inhalation [35], but basal levels are too low to be detected by EPR (analytical assessment of basal HbNO levels gives values of about 20 nM [37], and the EPR limit of detection is closer to 200 nM). HbNO can be observed ex vivo in animal models after i.v. injection of NO or nitrite [38]. The EPR spectrum of HbNO is an overlap of spectra derived from at least three species. Hemoglobin is a tetramer consisting of two alpha chains and two beta chains, each containing a heme prosthetic group. The nitrosylated forms of these chains exhibit differential EPR spectra (Figure 5B). Moreover, the nitrosylated alpha chain heme can exist in two forms, depending on conformation state of the tetramer. In the ‘R’ conformation (which has high oxygen affinity, and is stabilized by alkylation of a beta-chain cysteine residue) the nitrosylheme iron is 6-coordinate, with 4 nitrogen ligands from the heme, one from a protein histidine residue and one from NO. The EPR spectrum in the direction orthogonal to the heme plane is split by the histidine and NO nitrogen nuclei to give 9 lines that are poorly resolved. Upon transition to the ‘T’ conformation (low oxygen affinity that can be stabilized by diphosphoglycerate or inositol hexaphosphate), the histidine-iron bond is elongated and the effect of the histidine nitrogen on the EPR spectrum is lost. The result is that the EPR spectrum is only split by the NO nitrogen and resolved into three sharp lines with a hyperfine splitting constant of 17 G (Figure 5B). The beta chain heme nitrosyl is always 6-coordate and is not affected by conformation. EPR spectra of HbNO are generally a composite of these three species, and can be deconvoluted by linear regression if appropriate basis spectra are obtained [30,35]. There are a number of useful consequences of these spectral differences: (i) EPR can report on the proportion of NO bound to alpha compared to beta chain heme, and on the kinetics and thermodynamics of these associations [30,32]. For example, Luchsinger et al showed that reductive nitrosylation of hemoglobin by NO has a bias to generate beta-chain HbNO [39]. (ii) EPR can give an indication of the conformation of hemoglobin. The R to T transition that occurs upon passage of blood from arterial to venous circulation can be observed using this technique in both humans and animals [35,38]. (iii) The fact that the 5-coordiate alpha chain HbNO spectrum is dominated by the nitrogen hyperfine splitting from NO allows one to use 15N labeling to probe for the source of NO [8]. As discussed above the 15N-labelled NO gives a signal with only two lines instead of 3. While HbNO formation is not a good dosimeter of NO exposure, NO can be used as a useful probe to assess hemoglobin function in complex biological tissues, without purification.
Myoglobin can be used in much the same way as hemoglobin in tissues that are rich in this oxygen carrying protein (namely striated muscle tissue). Myoglobin is monomeric with a higher oxygen binding affinity that hemoglobin, and can be converted to both metMb and MbNO after exposure to NO. Tissue studies have largely focused on the formation of MbNO from the formation of NO under conditions of hypoxia. For example the formation of MbNO has been observed as a result of cardiac allograft [40], and the reduction of inorganic nitrite to NO in the ischemic heart has been followed by detecting tissue MbNO [41].
7. Other Methods
Several additional methods have been examined for the detection of NO by EPR. One interesting idea was the formation of a nitroxide from the reaction between NO and a diene – so called cheletropic trapping [42]. In fact, it has been shown that NO can react with naturally occurring dienes, for example β-carotene, to generate nitroxides [43]. Cheletropic tapping has not been developed for EPR but the idea has been utilized for the fluorescent detection of NO [44].
8. Endogenous NO-dependent EPR signals
Although this article is focused in spin-trapping of NO it is pertinent to mention endogenous NO-dependent EPR signals. The production of NO, can give rise to long lasting paramagnetic centers that can be relatively easily detected. The two major classes of these are heme nitrosyls and dinitrosyl iron complexes.
Heme nitrosyls have been discussed at length above. The level of HbNO in humans is too low to be detected by EPR and, using less direct techniques, has been reported to be in the range of 100-150 nM (calculated from [37]). In other species, such as rodents, that have a very robust NO component to their inflammatory response, HbNO levels can be detected by EPR in whole blood and tissues after administration of endotoxin or in response to other inflammatory stresses [45,45].
Dinitrosyl iron signals were observed using EPR, even before the realization that NO was physiologically generated, by the characteristic signal with a maximum at g = 2.04 [46]. Note that although the g value for this feature is actually g=2.03, which is the point where the first derivative signal passes though zero, the maximum at g=2.04 is often used to identify the species. This signal has been detected in activated macrophages [10] and in tumor cells after NO exposure [11]. Dinitrosyl iron complexes (DNIC) can be generated from iron, thiol and NO in vitro, and these complexes have vasodilatory properties and act in many ways like a source of NO. See [47] and [48] for a recent extensive review. Figure 6 shows the formation of DNIC in RAW264.7 macrophages after exposure to either spermineNONOate or S-nitrosocystiene, demonstrating the characteristic g = 2.04 signal. It has recently been shown that DNICs are produced from the cellular chelatable iron pool (a pool of loosely bound iron that can be bound by cell-permeable chelators) [49]. DNICs may be precursors to the formation of S-nitrosothiols [50,51], which are regarded as important NO-dependent protein modifications involved in signaling.
Figure 6. Dinitrosyl Iron complexes in RAW264.7 macrophages.

RAW264.7 mouse macrophage-like cells were cultured to confluence. Either spermineNONOate or S-nitrosocysteine were added and incubated for 30 minutes. Cells were scraped and placed in an EPR tube and frozen. EPR spectra were taken at 77K.
9. Conclusions
EPR is an invaluable and informative tool for NO research. Since the discovery of NO as a biological molecule, the situation has switched from NO being the probe to it being the focus of investigation. The ability to make observations in complex, non homogenous and optically opaque solutions is a major advantage of EPR over other forms of spectroscopy. While NO research continues to thrive, EPR spectroscopy will continue to provide an important window on the biological chemistry of this free radical.
Acknowledgments
I would like to thank Drs Katarzyna Broniowska, Agnes Keszler and Candice Klug for critical reading of this review. This work was partially supported from grants GM55792 and HL090503 from the National Institutes of Health. I would also like to acknowledge the National Biomedical EPR Center in the Biophysics Department at the Medical College of Wisconsin (Grant P41-EB001980, PI Dr. James S. Hyde) for support of all EPR studies.
Footnotes
The units of magnetic field are Tesla (T), the SI unit, and Gauss (G), the cgs unit. 1T = 10,000 G.
Most hyperfine constants are given in terms of G, but mT is also used. It also possible (see equation 1) to define the hyperfine effect by the frequency difference between EPR lines at a given field strength, and so hyperfine constants can also be given in units of frequency (Hz).
Publisher's Disclaimer: This is a PDF file of an unedited manuscript that has been accepted for publication. As a service to our customers we are providing this early version of the manuscript. The manuscript will undergo copyediting, typesetting, and review of the resulting proof before it is published in its final citable form. Please note that during the production process errors may be discovered which could affect the content, and all legal disclaimers that apply to the journal pertain.
Reference List
- 1.Duling DR. Simulation of multiple isotropic spin-trap EPR spectra. J Magn Res B. 1994;104:105–110. doi: 10.1006/jmrb.1994.1062. [DOI] [PubMed] [Google Scholar]
- 2.Knowles PF, March D, Rattle HWE. Magnetic Resonance of Biomolecules. New Jersey: John Wiley and Sons; 1976. [Google Scholar]
- 3.Weil JA, Bolton JR. Electron Paramagnetic Resonance Elementary Theory and Practical Applications. New Jersey: John Wiley and Sons; 2007. [Google Scholar]
- 4.Uehara H, Arimitsu S. Gas-phase electron paramagnetic resonance detection of ntiric oxide and nitrogen dioxide in pulluted air. Anal Chem. 1973;45:1897–1900. doi: 10.1021/ac60333a002. [DOI] [PubMed] [Google Scholar]
- 5.Villamena FA, Zweier JL. Detection of Reactive Oxygen and Nitrogen Species by EPR Spin Trapping. Antioxidants & Redox Signaling. 2004;6:619–629. doi: 10.1089/152308604773934387. [DOI] [PubMed] [Google Scholar]
- 6.Reszka KJ, Bilski P, Chignell CF. EPR and spin-trapping investigation of nitric oxide (NO) from UV irradiated nitrite anions in alkaline aqueous solutions. J Am Chem Soc. 1996;118:8719–8720. [Google Scholar]
- 7.Tsuchiya K, Kanematsu Y, Yoshizumi M, Ohnishi H, Kirima K, Izawa Y, Shikishima M, Ishida T, Kondo S, Kagami S, Takiguchi Y, Tamaki T. Nitrite is an alternative source of NO in vivo. Am J Physiol Heart Circ Physiol. 2005;288:H2163–H2170. doi: 10.1152/ajpheart.00525.2004. [DOI] [PubMed] [Google Scholar]
- 8.Jiang J, Jordan SJ, Barr DP, Gunther MR, Maeda H, Mason RP. In vivo production of nitric oxide in rats after administration of hydroxyurea. Mol Pharmacol. 1997;52:1081–1086. doi: 10.1124/mol.52.6.1081. [DOI] [PubMed] [Google Scholar]
- 9.Xu X, Cho M, Spencer NY, Patel N, Huang Z, Shields H, King SB, Gladwin MT, Hogg N, Kim-Shapiro DB. Measurements of nitric oxide on the heme iron and β-93 thiol of heman hemoglobin during cycles of oxygenation and deoxygenation. Proc Natl Acad Sci USA. 2003;100:11303–11308. doi: 10.1073/pnas.2033883100. [DOI] [PMC free article] [PubMed] [Google Scholar]
- 10.Lancaster JR, Jr, Hibbs JB., Jr EPR demonstration of iron-nitrosyl complex formation by cytotoxic activated macrophages. Proc Natl Acad Sci U S A. 1990;87:1223–1227. doi: 10.1073/pnas.87.3.1223. [DOI] [PMC free article] [PubMed] [Google Scholar]
- 11.Bastian NR, Yim CY, Hibbs JBJ, Samlowski WE. Induction of iron-derived EPR signals in murine cancers by nitric oxide. Evidence for multiple intracellular targets. J Biol Chem. 1994;269:5127–5131. [PubMed] [Google Scholar]
- 12.Ullman EF, Osieki JH, Boocock GB, Darcy R. Studies of stable free radicls. X. Nitronyl nitroxide monoradicals and biradicals as possible small molecule spin labels. J Am Chem Soc. 1972;94:7049–7059. [Google Scholar]
- 13.Ullman EF, Call L, Osieki JH. Stable free radicals. VIII. New imino, amidino, and carbamoyl nitroxides. J Org Chem. 1998;35:3623–3631. [Google Scholar]
- 14.Nadeau JS, Boocock GB. Stable Free Radical Reagent and solid phase suitable for a nitric oxide dosimiter. Anal Chem. 1977;49:1672–1676. [Google Scholar]
- 15.Joseph J, Kalyanaraman B, Hyde JS. Trapping of nitric oxide by nitronyl nitroxides: an electron spin resonance investigation. Biochem Biophys Res Commun. 1993;192:926–934. doi: 10.1006/bbrc.1993.1504. [DOI] [PubMed] [Google Scholar]
- 16.Akaike T, Yoshida M, Miyamoto Y, Sato K, Kohno M, Sasamoto K, Miyazaki K, Ueda S, Maeda H. Antagonistic action of imidazolineoxyl N-oxides against endothelium-derived relaxing factor/.NO through a radical reaction. Biochemistry. 1993;32:827–832. doi: 10.1021/bi00054a013. [DOI] [PubMed] [Google Scholar]
- 17.Hogg N, Singh RJ, Joseph J, Neese F, Kalyanaraman B. Reactions of nitric oxide with nitronyl nitroxides and oxygen: prediction of nitrite and nitrate formation by kinetic simulation. Free Radic Res. 1995;22:47–56. doi: 10.3109/10715769509147527. [DOI] [PubMed] [Google Scholar]
- 18.Goldstein S, Russo A, Samuni A. Reactions of PTIO and Carboxy-PTIO with {middle dot}NO, {middle dot}NO2, and O3- J Biol Chem. 2003;278:50949–50955. doi: 10.1074/jbc.M308317200. [DOI] [PubMed] [Google Scholar]
- 19.Koshiishi I, Takajo T, Tsuchida K. Regulation of S-thiolation and S-nitrosylation in the thiol/nitric oxide system by radical scavengers. Nitric Oxide. 2007;16:356–361. doi: 10.1016/j.niox.2006.12.002. [DOI] [PubMed] [Google Scholar]
- 20.Hogg N, Darley-Usmar VM, Wilson MT, Moncada S. Production of hydroxyl radicals from the simultaneous generation of superoxide and nitric oxide. Biochem J. 1992;281:419–424. doi: 10.1042/bj2810419. [DOI] [PMC free article] [PubMed] [Google Scholar]
- 21.Darley-Usmar VM, Hogg N, O'Leary VJ, Wilson MT, Moncada S. The simultaneous generation of superoxide and nitric oxide can initiate lipid peroxidation in human low density lipoprotein. Free Radic Res Commun. 1992;17:9–20. doi: 10.3109/10715769209061085. [DOI] [PubMed] [Google Scholar]
- 22.Singh RJ, Hogg N, Joseph J, Konorev E, Kalyanaraman B. The Peroxynitrite Generator, SIN-1, Becomes a Nitric Oxide Donor in the Presence of Electron Acceptors. Arch Biochem Biophys. 1999;361:331–339. doi: 10.1006/abbi.1998.1007. [DOI] [PubMed] [Google Scholar]
- 23.Mordvintcev P, Mulsch A, Busse R, Vanin A. On-line detection of nitric oxide formation in liquid aqueous phase by electron paramagnetic resonance spectroscopy. Anal Biochem. 1991;199:142–146. doi: 10.1016/0003-2697(91)90282-x. [DOI] [PubMed] [Google Scholar]
- 24.Mulsch A, Vanin A, Mordvintcev P, Hauschildt S, Busse R. NO accounts completely for the oxygenated nitrogen species generated by enzymic L-arginine oxygenation. Biochem J. 1992;288:597–603. doi: 10.1042/bj2880597. [DOI] [PMC free article] [PubMed] [Google Scholar]
- 25.Komarov A, Mattson D, Jones MM, Singh PK, Lai CS. In vivo spin trapping of nitric oxide in mice. Biochem Biophys Res Commun. 1993;195:1191–1198. doi: 10.1006/bbrc.1993.2170. [DOI] [PubMed] [Google Scholar]
- 26.Kleschyov AL, Wenzel P, Munzel T. Electron paramagnetic resonance (EPR) spin trapping of biological nitric oxide. J Chromatogr B Analyt Technol Biomed Life Sci. 2007;851:12–20. doi: 10.1016/j.jchromb.2006.10.006. [DOI] [PubMed] [Google Scholar]
- 27.Tsuchiya K, Jiang JJ, Yoshizumi M, Tamaki T, Houchi H, Minakuchi K, Fukuzawa K, Mason RP. Nitric oxide-forming reactions of the water-soluble nitric oxide spin-trapping agent, MGD. Free Radic Biol Med. 1999;27:347–355. doi: 10.1016/s0891-5849(99)00062-3. [DOI] [PubMed] [Google Scholar]
- 28.Komarov AM, Wink DA, Feelisch M, Schmidt HHHW. Electron-paramagnetic resonance spectroscopy using N-methyl--glucamine dithiocarbamate iron cannot discriminate between nitric oxide and nitroxyl: implications for the detection of reaction products for nitric oxide synthase. Free Radic Biol Med. 2000;28:739–742. doi: 10.1016/s0891-5849(00)00156-8. [DOI] [PubMed] [Google Scholar]
- 29.Tsuchiya K, Kirima K, Yoshizumi M, Houchi H, Tamaki T, Mason RP. The role of thiol and nitrosothiol compounds in the nitric oxide-forming reactions of the iron-N-methyl-d-glucamine dithiocarbamate complex. Biochem J. 2002;367:771–779. doi: 10.1042/BJ20020310. [DOI] [PMC free article] [PubMed] [Google Scholar]
- 30.Hille R, Olson JS, Palmer G. Spectral transitions of nitrosyl hemes during ligand binding to hemoglobin. J Biol Chem. 1979;254:12110–12120. [PubMed] [Google Scholar]
- 31.Henry Y, Banerjee R. Electron paramagnetic studies of nitric oxide haemoglobin derivatives: Isolated subunits and nitric oxide hybrids. Journal of Molecular Biology. 1973;73:469–482. doi: 10.1016/0022-2836(73)90094-6. [DOI] [PubMed] [Google Scholar]
- 32.Taketa F, Antholine WE, Chen JY. Chain nonequivalence in binding of nitric oxide to hemoglobin. J Biol Chem. 1978;253:5448–5451. [PubMed] [Google Scholar]
- 33.Doyle MP, Hoekstra JW. Oxidation of nitrogen oxides by bound dioxygen in hemoproteins. J Inorg Biochem. 1981;14:351–358. doi: 10.1016/s0162-0134(00)80291-3. [DOI] [PubMed] [Google Scholar]
- 34.Hogg N, Kalyanaraman B. The use of nitric oxide gas in biological systems. In: MA Titheradge., editor. Nitric oxide protocols. Totowa, New Jersey: Humana Press; 1997. pp. 233–238. [Google Scholar]
- 35.Piknova Barbora, Gladwin Mark T, Schechter Alan N, Hogg Neil. Electron paramagnetic resonance analysis of nitrosylhemoglobin in humans during NO inhalation. Journal of Biological Chemistry. 2005;280(49):40583–40588. doi: 10.1074/jbc.M506292200. [DOI] [PubMed] [Google Scholar]
- 36.Reiter CD, Wang X, Tanos-Santos JE, Hogg N, Cannon RO, III, Schechter A, Gladwin MT. Cell-free hemoglobin limits nitric oxide bioavalability in sickle-cell disease. Nat Med. 2002;8:1383–1389. doi: 10.1038/nm1202-799. [DOI] [PubMed] [Google Scholar]
- 37.Gladwin MT, Ognibene FP, Pannell LK, Nichols JS, Pease-Fye ME, Shelhamer JH, Schechter AN. Relative roles of heme nitrosylation and β-cystiene 93 nitrosation in the transport and metabolism of nitric oxide by hemoglobin in the human circulation. Proc Natl Acad Sci USA. 2000;97:9943–9948. doi: 10.1073/pnas.180155397. [DOI] [PMC free article] [PubMed] [Google Scholar]
- 38.Jiang J, Corbett J, Hogg N, Mason RP. An electron paramagnetic resonance investigation of the oxygen dependence of the arterial-venous gradient of nitrosyl hemoglobin in blood circulation. Free Radic Biol Med. 2007;43:1208–1215. doi: 10.1016/j.freeradbiomed.2007.06.024. [DOI] [PMC free article] [PubMed] [Google Scholar]
- 39.Luchsinger BP, Rich EN, Gow AJ, Williams EM, Stamler JS, Singel DJ. Routes to S-nitroso-hemoglobin formation with heme redox and preferential reactivity in the beta subunits. Proc Natl Acad Sci USA. 2003;100:461–466. doi: 10.1073/pnas.0233287100. [DOI] [PMC free article] [PubMed] [Google Scholar]
- 40.Pieper GM, Roza AM, Adams MB, Hilton G, Johnson M, Felix CC, Kampalath B, Darkes M, Wanggui Y, Cameron B, Fricker SP. A ruthenium (III) polyaminocarboxylate complex, a novel nitric oxide scavenger, enhances graft survival and decreases nitrosylated heme protein in models of acute and delayed cardiac transplant rejection. J Cardiovasc Pharmacol. 2002;39:441–448. doi: 10.1097/00005344-200203000-00016. [DOI] [PubMed] [Google Scholar]
- 41.Lohr NL, Keszler A, Pratt P, Bienengraber M, Warltier DC, Hogg N. Enhancement of nitric oxide release from nitrosyl hemoglobin and nitrosyl myoglobin by red/near infrared radiation: Potential role in cardioprotection. J Mol Cell Cardiol. 2009;47:256–263. doi: 10.1016/j.yjmcc.2009.03.009. [DOI] [PMC free article] [PubMed] [Google Scholar]
- 42.Gabr IM, Rai US, Symons MCR. Conversion of nitric oxide into a nitroxide radical using 2,3-dimethylbutadiene and 2,5-dimehtylhexadiene. J Chem Soc Chem Commun. 1993:1099–1100. [Google Scholar]
- 43.Gabr I, Patel RP, Symmons MCR, Wilson MT. Novel reactions of nitrx oxide in biological systems. J Chem Soc Chem Commun. 1995:915–919. [Google Scholar]
- 44.Meineke P, Rauen U, de GH, Korth HG, Sustman R. Nitric oxide detection and visualization in biological systems. Applications of the FNOCT method. Biol Chem. 2000;381:575–582. doi: 10.1515/BC.2000.074. [DOI] [PubMed] [Google Scholar]
- 45.Davies NA, Brealey DA, Stidwill R, Singer M, Svistunenko DA, Cooper CE. Nitrosyl heme production compared in endotoxemic and hemorrhagic shock. Free Radic Biol Med. 2005;38:41–49. doi: 10.1016/j.freeradbiomed.2004.09.026. [DOI] [PubMed] [Google Scholar]
- 46.Vanin AF, Varich VI. Formation of nitrosyl complexes of nonheme iron (2.03 complexes) in animal tissues in vivo. Biofizika. 1979;24:666–670. [PubMed] [Google Scholar]
- 47.Vanin AF. Dinitrosyl iron complexes with thiolate ligands: physico-chemistry, biochemistry and physiology. Nitric Oxide. 2009;21:1–13. doi: 10.1016/j.niox.2009.03.005. [DOI] [PubMed] [Google Scholar]
- 48.Ueno T, Yoshimura T. The physiological activity and in vivo distribution of dinitrosyl dithiolato iron complex. Jpn J Pharmacol. 2000;82:95–101. doi: 10.1254/jjp.82.95. [DOI] [PubMed] [Google Scholar]
- 49.Toledo J, Bosworth CA, Hennon SW, Mahtani HA, Bergonia HA, Lancaster JR. Nitric Oxide-induced Conversion of Cellular Chelatable Iron into Macromolecule-bound Paramagnetic Dinitrosyliron Complexes. J Biol Chem. 2008;283:28926–28933. doi: 10.1074/jbc.M707862200. [DOI] [PMC free article] [PubMed] [Google Scholar]
- 50.Boese M, Mordvintcev P, Vanin AF, Busse R, Mülsch A. S-Nitrosation of serum albumin by dinitrosyl-iron complex. J Biol Chem. 1995;270:29244–29249. doi: 10.1074/jbc.270.49.29244. [DOI] [PubMed] [Google Scholar]
- 51.Bosworth CA, Toledo JC, Zmijewski JW, Li Q, Lancaster JR. Dinitrosyliron complexes and the mechanism(s) of cellular protein nitrosothiol formation from nitric oxide. Proc Natl Acad Sci USA. 2009;106:4671–4676. doi: 10.1073/pnas.0710416106. [DOI] [PMC free article] [PubMed] [Google Scholar]