

Abstract
Purpose
To determine the effects of age, optic disc area, ethnicity, eye, gender, and axial length on the retinal nerve fiber layer (RNFL) in the normal human eye as measured by Stratus OCT (optical coherence tomography).
Design
Cross-sectional observational study.
Participants
Three hundred twenty-eight normal subjects 18 to 85 years old.
Methods
Peripapillary Fast RNFL scans performed by Stratus OCT with a nominal diameter of 3.46 mm centered on the optic disc were performed on one randomly selected eye of each subject.
Main Outcome Measures
Linear regression analysis of the effects of age, ethnicity, gender, eye, axial length, and optic disc area on peripapillary RNFL thickness.
Results
The mean RNFL thickness for the entire population was 100.1 μm (standard deviation, 11.6). Thinner RNFL measurements were associated with older age (P<0.001); being Caucasian, versus being either Hispanic or Asian (P = 0.006); greater axial length (P<0.001); or smaller optic disc area (P = 0.010). For every decade of increased age, mean RNFL thickness measured thinner by approximately 2.0 μm (95% confidence interval [CI], 1.2–2.8). For every 1-mm-greater axial length, mean RNFL thickness measured thinner by approximately 2.2 μm (95% CI, 1.1–3.4). For every increase in square millimeter of optic disc area, mean RNFL thickness increased by approximately 3.3 μm (95% CI, 0.6–5.6). Comparisons between ethnic groups revealed that Caucasians had mean RNFL values (98.1±10.9 μm) slightly thinner than those of Hispanics (103.7±11.6 μm; P = 0.022) or Asians (105.8±9.2 μm; P = 0.043). There was no relationship between RNFL thickness and eye or gender.
Conclusions
Retinal nerve fiber layer thickness, as measured by Stratus OCT, varies significantly with age, ethnicity, axial length, and optic disc area. These variables may need to be taken into account when evaluating patients for diagnosis and follow-up of glaucoma, particularly at the lower boundary of the normal range. Due to the relatively small numbers of subjects of Asian and African descent in the normative database, conclusions regarding the effect of ethnicity should be interpreted with caution.
Glaucoma is an optic neuropathy associated with accelerated apoptosis of retinal ganglion cells (RGCs) that manifests as increased cupping of the optic disc and thinning of the retinal nerve fiber layer (RNFL). The diagnosis of glaucoma is currently based on the appearance of the optic disc, RNFL, and standard achromatic perimetry.1 The optic disc is quite variable in appearance in the normal population; hence, a progressive change in the appearance of the disc architecture compared with a baseline condition is a more robust criterion for diagnosing glaucoma damage. This is performed through the use of optic disc photographs or careful clinical examination.2 However, a clinically detectable change in the optic cup likely represents loss of thousands of axons. Furthermore, testing of visual function, at least with conventional techniques, is a relatively insensitive measure of glaucoma damage, because studies have shown that 25% to 35% of RGCs may be lost before an abnormality appears on standard achromatic perimetry.3–5
Optical coherence tomography (OCT), first described by Huang et al,6 is a high-resolution cross-sectional imaging technique that allows in vivo measurements of the RNFL. The third-generation instrument, Stratus OCT (Carl Zeiss Meditec, Dublin, CA) received Food and Drug Administration clearance in May 2002, and the normative values for RNFL thickness were approved in July 2003. Under ideal conditions, OCT can quantify the thickness of the RNFL with a resolution of 8 to 10 μm, providing an objective tool to diagnose glaucomatous axon loss. Optical coherence tomography uses interferometry to interpret reflectance data and measure RNFL thickness.6 Near infrared light passing through the retina is compared interferometrically with a reference beam at each level within the tissue. The strength of the interferometric signal depends upon the optical reflectivity of each retinal structure, allowing construction of high-resolution B-scan images. Retinal nerve fiber layer thickness is measured using algorithms based upon reflectivity changes between adjacent structures.7
To optimize the predictive power of this instrument for glaucoma management, we determined the normal thickness of the RNFL as measured with Stratus OCT and evaluated the effects of age, gender, ethnicity, axial length, and optic disc size on RNFL thickness measurements.
Materials and Methods
This study was performed to generate the normative database for macular thickness and peripapillary RNFL thickness for Stratus OCT. The institutional review board of each participating center approved the study. Participating centers included the University of Miami Miller School of Medicine, Indiana University School of Medicine, Valley EyeCare Center, Tufts–New England Medical Center, and University of Southern California. Each subject gave informed consent. Complete ocular examinations were conducted by an ophthalmologist or optometrist on both eyes to determine eligibility. Normal subjects at least 18 years of age were invited to participate. An attempt was made to recruit subjects in each of 6 age groups, as outlined in Table 1.
Table 1.
Mean Retinal Nerve Fiber Layer (RNFL) Thickness Stratified by Age Category
| Age Category (yrs) | No. of Subjects (%) | Mean RNFL Thickness (μm) ± Standard Deviation | 95% Confidence Interval |
|---|---|---|---|
| 18–29 | 58 (18) | 103.7±9.7 | 101.2–106.2 |
| 30–39 | 45 (14) | 104.7±10.4 | 101.7–107.8 |
| 40–49 | 74 (23) | 99.9±12.2 | 97.1–102.7 |
| 50–59 | 71 (22) | 99.4±12.7 | 96.4–102.3 |
| 60–69 | 43 (13) | 96.89±10.8 | 93.7–100.1 |
| 70–85 | 37 (11) | 94.1±10.0 | 90.9–97.3 |
| Total | 328 | 100.1±11.6 | 98.8–101.3 |
Males or females ≥18 years old who were able and willing to make required study visits, give consent, and follow study instructions were included as subjects. Exclusion criteria were contraindication to dilation or intolerance to topical anesthetics or mydriatics; intraocular pressure (IOP) ≥22 mmHg or glaucoma in either eye; evidence of a reproducible visual field (VF) defect (pattern standard deviation significant at the <5% level or abnormal glaucoma hemifield test result) in either eye as measured with the Humphrey Visual Field Analyzer (Carl Zeiss Meditec); unreliable VFs (false-positive or false-negative rate > 15% or fixation losses > 20%); any pattern of loss consistent with ocular disease; intraocular surgery in the study eye (except cataract or refractive surgery if performed >1 year before testing); best-corrected visual acuity (VA) worse than 20/32 on the Early Treatment Diabetic Retinopathy Study scale; evidence of diabetic retinopathy, diabetic macular edema, or other vitreoretinal disease in either eye; evidence of optic nerve or RNFL abnormality in either eye; and use of a photosensitizing agent within 14 days. Stratus OCT scans were excluded if there was algorithm failure, as evidenced by the raster lines that divide the boundaries of the RNFL coming together, usually related to some media opacification.
Each subject had a complete ophthalmologic evaluation, including VA measurement, slit-lamp examination, intraocular pressure measurement, and dilated fundus examination. Threshold VF examinations were performed on all subjects using the Humphrey Visual Field Analyzer. Manifest refractions were determined by an eye care specialist, and axial length measurements were made using the IOL Master (Carl Zeiss Meditec).
Optic disc photographs were obtained from 303 of the 328 subjects for whom OCT results were available with a variety of fundus cameras. The images were recorded either digitally or on film. Film images were scanned to obtain digital images. The digital images were analyzed by using ImageNet software (Topcon Instrument Corp. of America, Paramus, NJ). The images of the optic nerve were enlarged on the monitor and the optic disc boundary traced with a mouse by an investigator without knowledge or access to data about nerve fiber layer thickness measurements. Tracing of the optic discs was performed by a single coauthor (DRA) to assure consistency in defining the optic nerve boundary. At least 3 and typically ≥5 area measurements were taken. The larger number of measurements was obtained when the edge of the optic nerve was indistinct or was uncertain because of anatomic variations, such as tilting of the optic nerve exit, or because broad boundaries of sclera and other peripapillary tissues introduced uncertainty. The size was recorded as the median value of the 3 the operator considered most representative and reproducible, the ones that represented the area within the innermost boundary of the scleral border tissue, thus excluding the zones of irregular peripapillary tissue layers. The extreme outlier values were nearly always <5% different from the recorded median value.
Because cameras of different types and models were used to take optic nerve and macular photographs, the following technique was used to make conversion factors to adjust for differences in magnification. A hollow model eye of the type used to practice retinoscopy and ophthalmoscopy was etched with a circle on the fundus painted on its inner surface. The model eye was photographed with the same cameras set at the same magnification as was used on study subjects at each study site. The images of the etched circle were traced and analyzed with the ImageNet system so that the relative magnifications of images from the cameras used in the study could be calculated. As images taken with Topcon cameras provide areas of traced areas in square millimeters, the area in square pixels could be converted to square millimeters for all optic discs measured.
One eye of each subject was selected as the study eye based on alternating assignment. Two types of measurements were made on each subject: standard RNFL and Fast RNFL. Only the Fast RNFL measurements were included in this analysis. The Fast RNFL scan consists of 3 peripapillary scans, each consisting of 256 test points measured along a circle having a nominal diameter of 3.46 mm centered on the optic disc. The RNFL analysis then averages the peripapillary scan measurements and produces 17 values for each scan set. These include mean RNFL thickness, 4 quadrant averages (temporal, superior, nasal, inferior), and 12 clock-hour averages. In this analysis, data from the mean RNFL thickness and quadrant averages are presented. Figure 1 shows the results from the Fast RNFL Stratus OCT scans of a patient with bilateral glaucomatous optic neuropathy.
Figure 1.
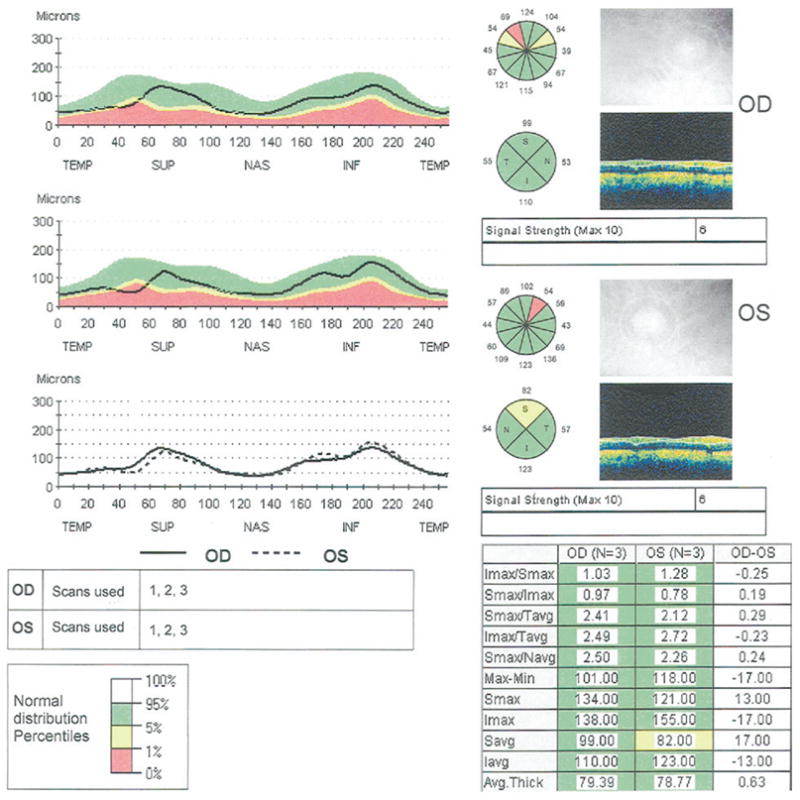
Stratus OCT printout of a peripapillary Fast retinal nerve fiber layer (RNFL) scan in a patient with bilateral glaucoma. Retinal nerve fiber layer thicknesses in the normal range are shown on green backgrounds, those that are abnormal at the 5% level are shown on yellow backgrounds, and those abnormal at the 1% level are shown on red backgrounds.
Stata (version 7.0, Stata Corp., College Station, TX) was used to perform all analyses. A multiple linear regression analysis of demographic and clinical variables, with average RNFL thickness as the dependent variable, was performed. The demographic and clinical variables used in the model included age, gender, eye, self-described ethnicity, axial length, and disc area. Because refractive error is highly correlated with axial length, one or the other was used in the model. Axial length was considered more robust than refractive error because there were some pseudophakic subjects in the sample and their refractive error had more to do with the intraocular lens power implanted than the shape or size of the eye. The linear regression model also was performed, substituting refractive error for axial length to test for a difference in regression coefficients. One-way analysis of variance (ANOVA) was used to compare RNFL between ethnicities and quadrants.
In addition to the univariate ANOVAs and regressions, an examination of these data for all possible pairwise statistical interactions was made by constructing for each a general linear model including the pair of variables (or appropriate design variables) and associated interaction term(s). After univariate ANOVA of the effect of polychotomous variables on nerve fiber layer measurements, post hoc least significant difference multiple comparison tests were performed when merited by a statistically significant overall result.
Results
Three hundred twenty-eight normal subjects were enrolled in the study, of whom 155 were men (48%) and 171 were women (52%). Mean age was 47.4 years (standard deviation [SD], 15.8; range, 18–85) (Table 1). Eyes were equally distributed between right and left (164 in each group). There were 9 pseudophakic subjects, and the average age of these subjects was 73.6 years. Table 2 provides the ethnic distribution of subjects. Mean axial length was 23.8 mm (SD, 1.1; range, 20.4–28.1). Spherical equivalent (SE) of the refractive errors ranged from −11.75 to +6.75 diopters (D), with a mean refractive error of −0.54 (SD, 1.9). Mean optic disc area was 2.26 mm2 (SD, 0.51; range, 0.85–4.06).
Table 2.
Mean Retinal Nerve Fiber Layer (RNFL) Thickness Stratified by Ethnicity
| Ethnic Group | No. of Subjects | Mean RNFL Thickness (μm ± Standard Deviation) | 95% Confidence Interval |
|---|---|---|---|
| Caucasian | 206 (63%) | 98.1±10.9 | 96.7–99.7 |
| Hispanic | 80 (24%) | 103.7±11.6 | 101.2–106.3 |
| African American | 27 (8%) | 101.1±14.0 | 95.8–106.4 |
| Asian | 11 (3%) | 105.8±9.2 | 100.3–111.2 |
| Asian Indian | 3 (1%) | 107.7±9.9 | 96.5–118.9 |
Table 1 shows results of mean RNFL thickness by decade. Table 2 provides a detailed summary of mean RNFL in different ethnic groups studied. Comparisons between ethnic groups revealed that Caucasians had mean RNFL values (98.1±10.9 μm) slightly thinner than those of Hispanics (103.7±11.6 μm; P = 0.0001) or Asians (105.8±9.2 μm; P = 0.031). There were no other between-group ethnic differences in RNFL thickness measurements.
Table 3 provides a summary of RNFL thickness in each of 4 quadrants measured. Superior and inferior RNFL thicknesses did not quite differ significantly (P = 0.063). All other quadrants differed at the P<0.001 level, the superior and inferior quadrants being thicker than the nasal and temporal quadrants and the nasal quadrant being thicker than the temporal quadrant.
Table 3.
Retinal Nerve Fiber Layer Thickness by Quadrant
| Quadrant | Mean ± Standard Deviation (μm) | 95% Confidence Interval |
|---|---|---|
| Temporal | 69.0±12.7 | 67.6–70.4 |
| Superior | 124.2±17.9 | 122.3–126.1 |
| Nasal | 80.9±18.1 | 79.0–82.9 |
| Inferior | 126.1±17.8 | 124.1–128.0 |
Table 4 shows the multiple linear regression of the effects of demographic and clinical variables on mean RNFL thickness measured with Stratus OCT. The multiple R2 for the model was 0.18. Retinal nerve fiber layer thickness was associated significantly with age (P<0.001). For every decade of higher age, the mean RNFL was thinner by approximately 2.0 μm (95% CI, 1.2–2.8), all other variables kept constant. Figure 2 shows the relationship between mean RNFL thickness and age plotted as a continuous variable. Retinal nerver fiber layer thickness also was associated significantly with axial length—the longer the eye, the thinner the mean RNFL (P<0.001). For every 1-mm-greater axial length, RNFL thickness was thinner by approximately 2.2 μm (95% CI, 1.1–3.4). Figure 3 shows the relationship between mean RNFL thickness and axial length. When refractive error was used in the linear regression model instead of axial length, the regression coefficient for refractive error was also significant (P = 0.019), with mean RNFL thickness decreasing by approximately 0.9 μm for every 1-D change in SE power toward greater myopia (95% CI, 0.2–1.6). Optic disc area also showed a significant positive relationship with RNFL (P = 0.01), with an increase of approximately 3.3 μm for every square millimeter increase in optic disc area (95% CI, 0.6–5.6). Figure 4 shows the trend for mean RNFL thickness to increase with increasing optic disc size. There were no statistically significant relationships between either eye (P = 0.86) or gender (P = 0.34) and RNFL thickness. No statistically significant interactions between predictor variables were found (P>0.2 for all tests for interaction).
Table 4.
Multiple Linear Regression of Demographic and Clinical Variables: Effect on Mean Retinal Nerve Fiber Layer Thickness
| Variable | Regression Coefficient | Standard Error | P Value | 95% Confidence Interval |
|---|---|---|---|---|
| Age (per decade) | −1.99 | 0.41 | <0.001 | −2.79 to −1.19 |
| Gender | 1.25 | 1.29 | 0.332 | −1.28 to 3.78 |
| Ethnicity* | ||||
| Hispanic | 3.54 | 1.54 | 0.022 | 0.50–6.58 |
| African | 0.34 | 2.28 | 0.882 | −4.15 to 4.83 |
| Asian | 7.88 | 3.88 | 0.043 | 0.25–15.5 |
| Asian–Indian | 2.99 | 6.29 | 0.635 | −9.40 to 15.37 |
| Eye | 0.47 | 1.24 | 0.706 | −1.96 to 2.90 |
| Axial length (per mm) | −2.24 | 0.60 | <0.001 | −3.42 to −1.06 |
| Disc area (per mm2) | 3.34 | 1.28 | 0.010 | 0.81–5.86 |
Caucasian was used as the reference group.
Figure 2.
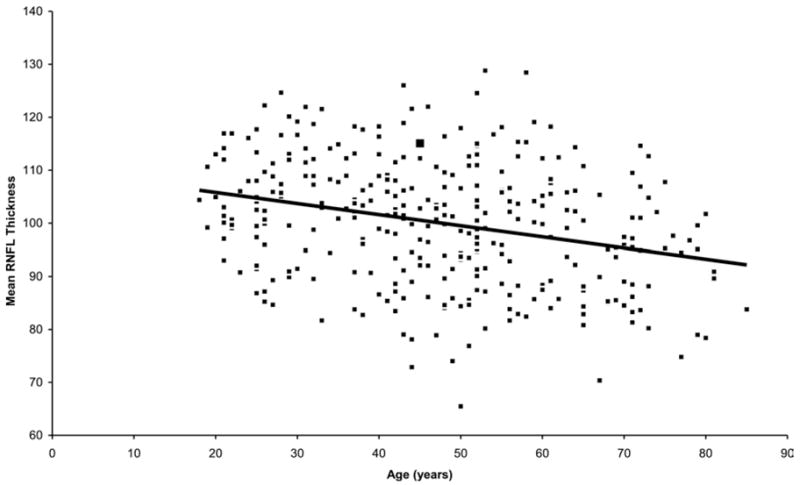
Relationship between retinal nerve fiber layer (RNFL) and age. Note relationship showing decrease in RNFL thickness (μm) with age.
Figure 3.
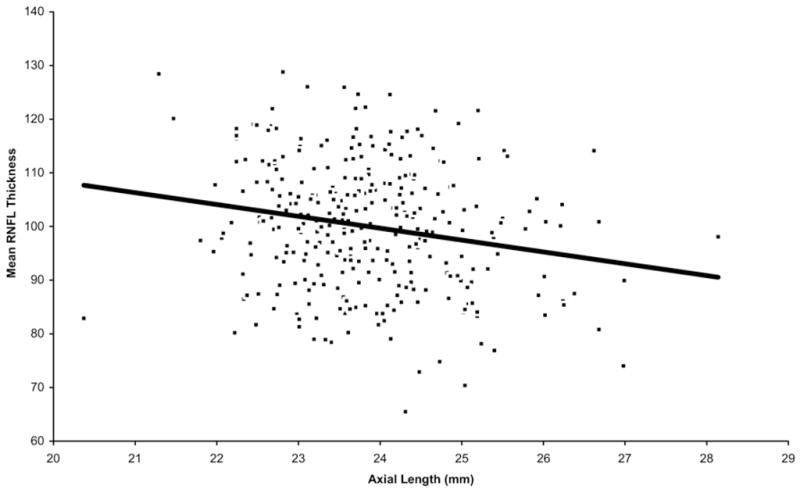
Relationship between retinal nerve fiber layer (RNFL) thickness (μm) and axial length. Note relationship showing decrease in RNFL thickness with increasing axial length.
Figure 4.
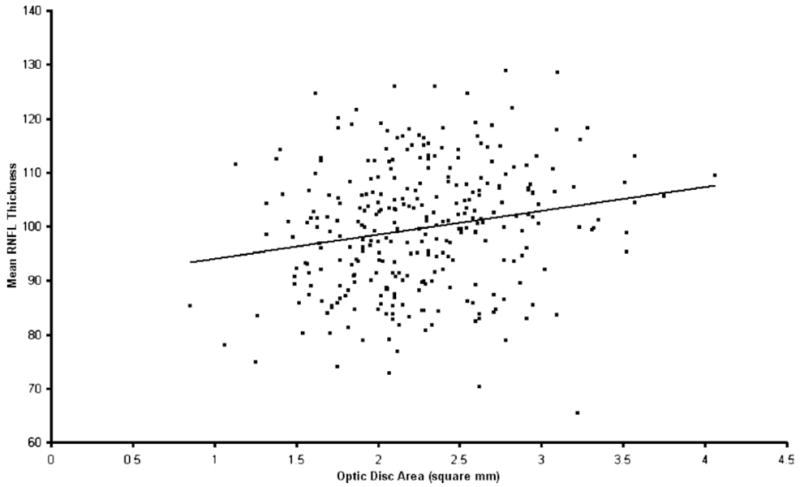
Relationship between retinal nerve fiber layer (RNFL) thickness (μm) and optic disc area. Note relationship showing increase in RNFL thickness with increasing optic disc area.
Discussion
The diagnosis of glaucoma involves a set of characteristic optic nerve findings usually accompanied by VF changes. It is known that pathologic changes of the optic nerve precede VF changes as measured with standard achromatic perimetry to such an extent that 25% to 35% of axons can be lost at a given location before the visual threshold ventures outside of the normal range.3–5 This observation has stimulated interest in measuring RNFL thickness as a potential method of recognizing axon loss in advance of recognizing VF abnormality. Indeed, clinical grading of RNFL is highly predictive of future VF defect development.8 Scanning laser polarimetry and optical coherence tomography are 2 methods currently available for quantitatively assessing the RNFL.
The current study demonstrates that OCT measures the RNFL as thinner in older persons, with a decline of approximately 2 μm per decade. Because there have been no OCT longitudinal studies of RNFL thickness in healthy individuals, we make the assumption that a cross-sectional analysis is a good surrogate for change over time in an individual. Cross-sectional studies of RNFL thickness using scanning laser polarimetry also have found a decrease in RNFL thickness with age.9–12 The human RNFL loses approximately 5000 axons per year from birth to death, approximately 2500 per year before age 50 and 7500 per year after 50.3 It is not surprising, then, that RNFL thickness decreases with age. Our findings indicate a loss per year of 0.2 μm, or 0.2% per year loss in the 100-μm mean thickness for older adults studied. The loss of 7500 axons from the total of about 1 000 000 axons in the normal adult is 0.75% per year. Because the loss of RNFL thickness and loss of optic nerve axons as a proportion of the total number are on the same order of magnitude, the 2 sets of data support the likelihood that there is a modest loss of RGCs with age. Likewise, the general similarity of the 2 estimates for age-related loss, clinical and histological, in a sense provides mutual validity for the 2 approaches. Several earlier studies have shown a decrease in RNFL thickness with age by OCT7,13 or in RNFL axons by histologic analysis.14,15 A third histologic study failed to find any difference in the number of axons between older and younger individuals.16 Conflicting results in histologic studies may be because these studies look at relatively few subjects and there is a large variation in the number of RNFL axons in normal individuals, between 700 000 and 1.4 million. Unless one looks at a large number of normal subjects, trends such as this might be missed.
The clinical implications of the finding that RNFL thickness measurements decreases with age cannot be overemphasized. This decline should be taken into consideration when interpreting the lower limits of the normal range for diagnosis. For instance, an RNFL thickness of 80 μm may be normal for a 70-year-old but would be abnormally low for the average 40-year-old. This age-related change in RNFL thickness is taken into account by the Stratus OCT software to avoid confusing the normal aging effect with glaucomatous RNFL thinning; however, at 2 μm per decade, the effect of aging on RNFL thickness, though statistically significant, is still clinically small.
Ethnicity was associated modestly with RNFL thickness in the current study, though in the regression model all ethnic designations had 95% confidence limits that overlapped 1. The present Stratus OCT normative database has relatively few subjects in the African American, Asian, and East Indian subgroups, as shown in Table 2, so conclusions about ethnicity must be interpreted with caution. Thus, further study may be worthwhile for those of Asian, African, or East Indian heritage. We did find that persons of Hispanic ethnicity had a significantly thicker mean RNFL than those of European derivation. Perhaps future studies will clarify whether ethnic differences in RNFL exist and need to be taken into account when diagnosing glaucoma using RNFL thickness measurements. In addition, ethnicity-specific databases may need to be developed for accurate use of the normative database software.
The current study found that RNFL thickness was related significantly to both axial length and refractive error. Longer eyes and more myopic eyes had a thinner measured RNFL. A recent study by Hoh et al17 failed to demonstrate a relationship between peripapillary RNFL thickness and refractive error or axial length in 132 young Asian male military subjects. Limitations of that study included the use of first-generation technology OCT; a relatively small sample size; lack of gender, age, or ethnic diversity; and the use of univariate analysis. Also, a small study using scanning laser polarimetry in 43 normal subjects failed to find a relationship between refractive error or axial length and RNFL thickness.18
Because the current study measured all eyes at a fixed angular distance from the geometric center of the disc, several variables could play a role in how variations in ocular anatomy impact RNFL thickness as determined by OCT. If all eyes had the same number of RGCs, with one axon per neuron, the size of the disc would be unimportant in assessing RNFL thickness. However, eyes with larger optic discs are known to have more axons in histological studies of monkeys,19 and disc rim area increases with increasing disc area in humans,20 also indicating that there may be more axons in larger discs. Our findings are consistent with this hypothesis. The current study also found that larger eyes and more myopic eyes had a statistically lesser mean RNFL thickness in a model that adjusted for disc area. Thus, highly myopic or long eyes inherently may have fewer ganglion cell axons than emmetropic average-size eyes. Alternatively, eye length and refraction could be related to another variable, such as disc area. In this case, to be consistent with other findings, greater axial length would have to be associated with smaller disc area, but in our model, there was no interactive relationship between axial length and disc area. Another possibility is that OCT measurements are affected optically by greater axial length and higher myopia, producing apparently thinner RNFL as an artifact. A longer eye will produce a larger scanning circle diameter, thereby measuring the RNFL in an area thinner than that intended. Whatever the reason for these differences, axial length or refractive error may need to be taken into account in the assessment of RNFL thickness by OCT.
We found a significant relationship between optic disc area and RNFL thickness. Eyes with larger optic disc areas had thicker peripapillary RNFL measurements, independent of axial length, refractive error, and other demographic and clinical variables. Savini et al found a similar relationship between optic disc size and peripapillary RNFL thickness in 54 normal Caucasian subjects using a model that took into consideration age and several optic disc parameters.21 There are several possible explanations for this finding. First, it is likely that eyes with larger optic discs have more axons. A histologic study in monkey eyes demonstrated this,15 although a human histologic study failed to find a relationship between optic disc size and RNFL thickness.22 A second hypothesis is that eyes have the same number of axons regardless of disc size but that the fixed circular scan of the peripapillary RNFL measurements performed with Stratus OCT somehow produces a thicker measurement. Indeed, in larger discs the OCT measurement is made closer to the optic disc margin, where axons may be sampled as they are at a different incident plane to the scanning beam. If they are coursing more obliquely (either heaping up into the disc rim or already diving downward into it), the measurement by the instrument might give a thicker value than in eyes in which the axons are further from the disc rim and are completely perpendicular to the measuring light. A histologic study in normal human eyes showed that RNFL thickness decreases with increasing distance from the disc margin.18 Regardless of the explanation for this finding, it suggests that somewhat greater predictive power in the assessment of RNFL might be achieved if disc area were taken into account, perhaps by measuring the optic disc area using the Stratus OCT optic disc scan protocol and incorporating this variable into the comparison with the normative database. Another way to adjust for this would be to measure RNFL at a fixed relative distance from the optic disc margin. Carpineto et al23 performed Stratus OCT measurements using the fixed 3.46-mm-diameter circle and a variable scan circle diameter designed to measure the RNFL 0.85 mm from the edge of the optic disc in the same group of 30 normal eyes. They confirmed the findings of the current study—namely, that eyes with larger optic nerves had thicker RNFL measurements—but also showed that RNFL thickness is unrelated to vertical optic disc diameter if one measures RNFL thickness a fixed distance from the disc margin.
Other demographic and clinical factors, such as right or left eye and gender, were found not to be important determinants of RNFL thickness. Thus, these factors need not be considered when determining what constitutes normal RNFL measurements. Other factors not explored in the current study, such as time of day and IOP, may need to be evaluated further for their effects on RNFL thickness.
The purpose of this article was to identify factors that may merit consideration in future normative databases, and not to present normative data for general clinical use with Stratus OCT or any other product. The analyses presented here were done independently of any work performed by the manufacturer in calculating the normative data present commercially in its Stratus OCT product. Statistical estimation methods differed, and it is therefore likely that the values presented in this article differ somewhat from those in the commercial Stratus OCT software.
It is important to note that the first and fifth percentiles of normality described in the Fast RNFL printout, which are based on the data collected in the current study, are not necessarily diagnostic of glaucoma. First, 1% and 5% of normal individuals would be expected to have values for RNFL thickness in the bottom first and fifth percentiles, by definition. Second, the current version of the Stratus OCT software adjusts for age but not ethnicity, axial length, or optic disc size. Based upon the present study, adjustment for such parameters in current and future iterations of OCT technology would be expected to provide better sensitivity and specificity for glaucoma detection. Additional normative data may need to be collected that include more subjects of African, Asian, and Indian–Asian ethnicity and those with higher degrees of refractive error.
Acknowledgments
Collection of the normative database used in this study was supported by a grant from Carl Zeiss Meditec. The study also was supported in part by an unrestricted grant from Research to Prevent Blindness, Inc., New York, New York.
References
- 1.American Academy of Ophthalmology Glaucoma Panel. Primary open-angle glaucoma. San Francisco: American Academy of Ophthalmology; 2003. [Accessed October 18, 2006]. Preferred Practice Pattern; p. 3. Available at: http://www.aao.org/education/library/ppp/upload/Primary_Open-Angle_Glaucoma.pdf. [Google Scholar]
- 2.Kass MA, Heuer DK, Higginbotham EJ, et al. The Ocular Hypertension Treatment Study: a randomized trial determines that topical ocular hypotensive medication delays or prevents the onset of primary open-angle glaucoma. Arch Ophthalmol. 2002;120:701–13. doi: 10.1001/archopht.120.6.701. [DOI] [PubMed] [Google Scholar]
- 3.Quigley HA, Dunkelberger GR, Green WR. Retinal ganglion cell atrophy correlated with automated perimetry in human eyes with glaucoma. Am J Ophthalmol. 1989;107:453–64. doi: 10.1016/0002-9394(89)90488-1. [DOI] [PubMed] [Google Scholar]
- 4.Mikelberg FS, Yidegiligne HM, Shulzer M. Optic nerve axon count and axon diameter in patients with ocular hypertension and normal visual fields. Ophthalmology. 1995;102:342–8. doi: 10.1016/s0161-6420(95)31019-6. [DOI] [PubMed] [Google Scholar]
- 5.Kerrigan-Baumrind LA, Quigley HA, Pease ME, et al. Number of ganglion cells in glaucoma eyes compared with threshold visual field tests in the same persons. Invest Ophthalmol Vis Sci. 2000;41:741–8. [PubMed] [Google Scholar]
- 6.Huang D, Swanson EA, Lin CP, et al. Optical coherence tomography. Science. 1991;254:1178–81. doi: 10.1126/science.1957169. [DOI] [PMC free article] [PubMed] [Google Scholar]
- 7.Schuman JS, Hee MR, Puliafito CA, et al. Quantification of nerve fiber layer thickness in normal and glaucomatous eyes using optical coherence tomography. Arch Ophthalmol. 1995;113:586–96. doi: 10.1001/archopht.1995.01100050054031. [DOI] [PubMed] [Google Scholar]
- 8.Quigley HA, Enger C, Katz J, et al. Risk factors for the development of glaucomatous visual field loss in ocular hypertension. Arch Ophthalmol. 1994;112:644–9. doi: 10.1001/archopht.1994.01090170088028. [DOI] [PubMed] [Google Scholar]
- 9.Chi QM, Tomita G, Inazumi K, et al. Evaluation of the effect of aging on the retinal nerve fiber layer thickness using scanning laser polarimetry. J Glaucoma. 1995;4:406–13. [PubMed] [Google Scholar]
- 10.Tjon-Fo-Sang MJ, de Vries J, Lemij HG. Measurement by nerve fiber analyzer of retinal nerve fiber layer thickness in normal subjects and patients with ocular hypertension. Am J Ophthalmol. 1996;122:220–7. doi: 10.1016/s0002-9394(14)72013-6. [DOI] [PubMed] [Google Scholar]
- 11.Poinoosawmy D, Fontana L, Wu JX, et al. Variation of nerve fibre layer thickness measurements with age and ethnicity by scanning laser polarimetry. Br J Ophthalmol. 1997;81:350–4. doi: 10.1136/bjo.81.5.350. [DOI] [PMC free article] [PubMed] [Google Scholar]
- 12.Da Pozzo S, Iacono P, Marchesan R, et al. The effect of ageing on retinal nerve fibre layer thickness: an evaluation by scanning laser polarimetry with variable corneal compensation. Acta Ophthalmol Scand. 2006;84:375–9. doi: 10.1111/j.1600-0420.2006.00655.x. [DOI] [PubMed] [Google Scholar]
- 13.Varma R, Bazzaz S, Lai M. Optical tomography-measured retinal nerve fiber layer thickness in normal Latinos. Invest Ophthalmol Vis Sci. 2003;44:3369–73. doi: 10.1167/iovs.02-0975. [DOI] [PubMed] [Google Scholar]
- 14.Balazsi AG, Rootman J, Drance SM, et al. The effect of age on the nerve fiber population of the human optic nerve. Am J Ophthalmol. 1984;97:760–6. doi: 10.1016/0002-9394(84)90509-9. [DOI] [PubMed] [Google Scholar]
- 15.Johnson BM, Miao M, Sadun AA. Age-related decline of human optic nerve axon populations. Age. 1987;10:5–9. [Google Scholar]
- 16.Repka MX, Quigley HA. The effect of age on normal human optic nerve fiber number and diameter. Ophthalmology. 1989;96:26–32. doi: 10.1016/s0161-6420(89)32928-9. [DOI] [PubMed] [Google Scholar]
- 17.Hoh ST, Lim MC, Seah SK, et al. Peripapillary retinal nerve fiber layer thickness variations with myopia. Ophthalmology. 2006;113:773–7. doi: 10.1016/j.ophtha.2006.01.058. [DOI] [PubMed] [Google Scholar]
- 18.Garcia-Valenzuela E, Mori M, Edward DP, Shahidi M. Thickness of the peripapillary retina in healthy subjects with different degrees of ametropia. Ophthalmology. 2000;107:1321–7. doi: 10.1016/s0161-6420(00)00166-4. [DOI] [PubMed] [Google Scholar]
- 19.Quigley HA, Coleman AL, Dorman-Pease ME. Larger optic nerve heads have more nerve fibers in normal monkey eyes. Arch Ophthalmol. 1991;109:1441–3. doi: 10.1001/archopht.1991.01080100121056. [DOI] [PubMed] [Google Scholar]
- 20.Caprioli J, Miller JM. Optic disc rim area is related to disc size in normal subjects. Arch Ophthalmol. 1987;105:1683–5. doi: 10.1001/archopht.1987.01060120081030. [DOI] [PubMed] [Google Scholar]
- 21.Savini G, Zanini M, Carelli V, et al. Correlation between retinal nerve fibre layer thickness and optic nerve head size: an optical coherence tomography study. Br J Ophthalmol. 2005;89:489–92. doi: 10.1136/bjo.2004.052498. [DOI] [PMC free article] [PubMed] [Google Scholar]
- 22.Varma R, Skaf M, Barron E. Retinal nerve fiber layer thickness in normal human eyes. Ophthalmology. 1996;103:2114–9. doi: 10.1016/s0161-6420(96)30381-3. [DOI] [PubMed] [Google Scholar]
- 23.Carpineto P, Ciancaglini M, Aharrh-Gnama A, et al. Custom measurement of retinal nerve fiber layer thickness using STRATUS OCT in normal eyes. Eur J Ophthalmol. 2005;15:360–6. doi: 10.1177/112067210501500308. [DOI] [PubMed] [Google Scholar]