

Abstract
Background
Abnormal levels of T cell antigen expression occur in T cell neoplasia. We examined CD2 expression in malignant and normal T cells to determine if the level of CD2 expression differed significantly and if quantitation assisted in detecting this difference.
Method
Flow cytometric immunophenotypic (FCI) evaluation was performed on specimens from 36 patients with mature T cell neoplasia. Abnormal T cells were identified based upon abnormal FCI and morphology. Levels of CD2 expression were quantitated using 1:1 PE conjugates of anti-CD2 and QuantiBRITE bead standards to calculate the antibodies bound per cell (ABC). The efficacy of ABC measurement verses simple examination of dots plots was compared.
Results
Abnormal levels of CD2 expression were frequently observed in mature T cell malignancies. The CD2 ABC values were highly sensitive in detecting differences between malignant and normal T cells (p=0.0028). In most cases (24/32 specimens, 75%) CD2 ABCs differed by > 20%. CD2 ABCs had high variability in normal T cells.
Conclusions
CD2 expression by malignant T cells differed significantly from that of normal T-cells by CD2 ABC quantitation. The high variability in normal T cell CD2 ABCs limited the determination of normal reference ranges, and thus its utility in the diagnosis of T cell neoplasia. However, examination of CD2 can help in detection of tumor cells when residual normal T cells are present for comparison. Moreover, the increased sensitivity of CD2 quantitation is valuable in confirming FCI cases where abnormalities in CD2 expression are difficult to appreciate by visual inspection alone.
Keywords: CD2, quantitation, ABC, lymphoma, normal T cells
Introduction
Mature T cell neoplasms are relatively uncommon, accounting for less than 10% of all non Hodgkin Lymphomas (NHL) in North America and Western Europe (1). Flow cytometric (FC) immunophenotyping is useful in diagnosis and classification of mature T cell neoplasms (2–9). The diagnosis of mature T cell neoplasms by flow cytometric immunophenotyping (FC) is usually based upon demonstration of an aberrant T cell population. T cell clonality can also be determined by demonstrating V- beta restriction in such a population (10–12). Aberrant T cell populations are defined by abnormal intensity of antigen expression, abnormal size (as reflected by increased forward light scatter properties), failure to express T-cell associated antigens and expression of aberrant/non-T cell antigens. Abnormal intensity of antigen expression is a diagnostic characteristic that is frequently encountered in T cell malignancies, with abnormal CD3 expression being especially common (2,13–15). The human CD2 (T11, LFA-2, sheep red blood cell receptor) molecule is a 50kd surface glycoprotein expressed on greater than 95% of thymocytes and all peripheral T lymphocytes. The main functions of CD2 are adhesion and activation (16). CD2 expression is upregulated in reactive T cells and a subpopulation of activated T cells expressing higher levels of CD2 can be observed (17,18). Abnormal CD2 expression is also noted in T cell neoplasia, although the reported incidence is lower than that of CD3 and less than 20% of cases lack CD2 expression entirely (2,4).
Quantitative flow cytometry determines the number of molecules of bound fluorescent antibody (19–24). When saturating concentrations of antibodies and optimal conditions are used, quantitative flow cytometry can provide an objective measurement of the molecules of antigen on the cell surface (20–22). By including a combination of antibodies specific for tumor cells or lymphocyte subsets with the antibody for quantitation, one can assess antigen expression on sub-populations of cells without the confounding influence of other populations with in the specimen (18,25–30). Thus, quantitative flow cytometry is particularly useful in clinical specimens such as blood, bone marrow or lymph nodes, where immunophenotypic information from a minor cell population of interest may be extracted from an obscuring admixture of normal cellular components. One method of quantitative flow cytometry utilizes 1:1 PE conjugates of antibody and QuantiBRITE pre-calibrated bead standards to calculate the antibody bound per cell (ABC)(19,23).
In this study, we utilized simple visual inspection of dot plots and quantitative flow cytometry to investigate the levels of expression of CD2 in normal and malignant T cells in patients with mature T cell lymphoma and leukemia. The rationale of our study was to determine the frequency of abnormal levels of CD2 expression in malignant T cells compared to residual normal T cells and to determine if quantitative flow cytometry could be utilized to increase sensitivity of detection of neoplastic T cells for diagnostic purposes.
Materials and Methods
Case selection
Specimens (31 peripheral blood samples and 6 fine needle aspirates) from a total of 36 patients with a confirmed diagnosis of a mature T cell lymphoma were submitted to the Flow Cytometry Unit, Laboratory of Pathology, National Cancer Institute (Bethesda, MD, USA). Specimens were submitted for evaluation by FC of cell surface expression of CD2 by malignant and normal T-cells. In one patient, normal T cells were evaluated in peripheral blood and malignant T cells in a fine needle aspirate. Patients were undergoing eligibility evaluation for a research protocol studying the efficacy of anti-CD2 monoclonal antibody therapy in various T cell lymphoproliferative disorders. All patients signed IRB-approved informed consent to be screened for eligibility. Clinical data were obtained through medical record review and by contacting the patients’ NIH staff physicians. All patients had a confirmed diagnosis of T cell neoplasia with a distinctively abnormal FC immunophenotype that could be employed to distinguish malignant cells from normal lymphoid cell populations. The cases included 20 patients with HTLV-I associated adult T-cell leukemia/lymphoma (ATL), 1 patient with anaplastic large cell lymphoma (ALCL), 1 cutaneous T-cell lymphoma (CTCL), 2 peripheral T-cell lymphomas, not otherwise specified (PTCL-NOS), and 12 T-cell large granular lymphocytic leukemia (T-LGL) patients.
Tumor subclassification was based on the WHO criteria for hematologic malignancies using a combination of morphologic, immunohistochemical and FC studies. When necessary, molecular studies for T cell receptor gamma gene rearrangement by polymerase chain reaction (PCR) and HTLV-1 serology (performed by ELISA and confirmed by western blot) and blood HTLV-1 viral load by real-time PCR were utilized. The diagnoses were confirmed by review of the original pathology reports, FC immunophenotype, IHC immunophenotype, and cytology or histological evaluation by two hematopathologists (C. Yuan, and M. Stetler-Stevenson). All the specimens, including peripheral blood and fine needle aspiration from lymph node, skin nodules, and soft tissue mass, were collected and analyzed prior to initiation of therapy.
Immunophenotyping
Specimens were stained within 24 hour of collection with a panel of antibodies. Erythrocytes in peripheral blood and bloody fine needle aspirates were lysed by incubating with lysing solution (150 mM NH4Cl, 10 mM KHCO3, 0.1 mM EDTA) for 10 minutes at room temperature (maintained at 21–23 °C) at a ratio of 1:9 (volume of sample: volume of lysing solution). Specimens were then washed with phosphate buffered saline (PBS) to remove cytophilic antibodies before determining cell number. Cellularity was manually determined by a hemocytometer and viability by trypan blue uptake. Specimens were stained for 30 minutes at room temperature (maintained at 21–23 °C) with a cocktail of four antibodies (antibody concentration according to manufacturer’s recommendations) according to Clinical Laboratory Standards Institute (CLSI) document H43-A recommendations(31). The antibody panels, including antibody combinations used, were chosen based on the number of cells and previous histological diagnosis and immunophenotypic data. The panels included antibodies against CD2, CD3, CD5, CD4, CD8, CD7, CD16, CD19, CD45, CD56, gamma/delta T cell receptor, alpha/beta T cell receptor, anti-kappa and anti-lambda. CD2 was studied in all the cases. Moreover, depending on individual cases, antibodies targeting specific antigens characteristically expressed in the patient’s lymphomas were also used, including CD25 for ATL, CD57 for T-LGL, and CD30 for ALCL. Based upon cell number and available diagnostic information, CD10, CD26 and CD27 were included in some panels for diagnostic purposes. After incubation, cells were pelleted by centrifugation (500xg for 15 minutes at room temperature), the media was aspirated, and the cells washed twice in a PBS solution containing 0.1% NaN3 and 0.5% albumin. All cells were fixed in 1.0% paraformaldehyde and stored at 4°C for up to 12 h before acquisition. Normal lymphoid cells within specimens served as internal controls.
Four-color cytometry was performed using a BD Biosciences FACSCalibur flow cytometer. The sensitivity of fluorescent detectors was monitored using Calibrite beads (BD Biosciences, San Jose, CA) according to the manufacturer’s recommendations. Data (collected in list mode) were analyzed with CellQuest Pro software (BD Bioscience) and FCSExpress (De Novo Software). At least 5,000 lymphocytes were acquired per tube. For analysis, relevant cell populations were analyzed by gating on forward scatter (FSC), side scatter (SSC), CD45, CD3, and characteristic markers for each specific entity (i.e. CD25 for ATL), and the cell population of interest subsequently examined for staining with anti-CD2.
In patients with T cell lymphoma or leukemia and sufficient cell number, antibody bound per cell (ABC) in the malignant and residual normal T cells was determined for anti-CD2 clones S5.2(BD Biosciences, 1:1 antibody to PE conjugate prepared by BD Biosciences) and MEDI-507(siplizuman, humanized monoclonal anti-CD2 antibody MedImmune, Gaithersburg, USA, 1:1 antibody to PE conjugate prepared by BD Biosciences) using saturating concentrations of antibody and the BD Biosciences QuantiBRITE system for fluorescence quantitation. Anti-CD2 clone S5.2 ABC data in malignant T cells were available on all 36 patients whereas 34 patients had anti-CD2 clone MEDI-507 ABC data in the malignant T cell population. We also analyzed CD2 expression in the normal T cell populations and obtained anti-CD2 clone S5.2 ABC data from 33 patients and anti-CD2 clone MEDI-507 data from 29 patients. Analysis of normal T cell populations could not be performed in all patient samples due to paucity of normal T cells in the predominantly malignant phenotype. The ABC value is the measurement of the mean value of the maximum capacity of each cell to bind the anti-CD2 antibody. QuantiBRITE PE Beads (BDIS) are pre-calibrated standard beads containing known levels of PE molecules. QuantiBRITE beads were run through a FACSCalibur flow cytometer on the same day at the same instrument settings as the individual patient specimens. A standard curve comparing the geometric mean of fluorescence to known PE content of the QuantiBRITE beads was constructed using QuantiCALC software. The regression analysis, slope, intercept and correlation coefficient were determined. Analysis gates were drawn based upon immunophenotype and cell size to include only the malignant cells or normal T cells for determination of the geometric mean fluorescence of CD2 staining. The ABC values were generated from the measured geometric mean fluorescence of cells in analysis gates containing only the malignant cells or only the normal T cells using the QuantiBRITE standard curve.
Results
Visual inspection of dot plots revealed abnormal levels of staining with anti-CD2 antibodies (Figure 1) in 12 cases. Abnormal staining with S5.2 anti-CD2 and MEDI507 anti-CD2 was observed in 11 cases each, with non-concordant results in patient number 22 and 36 (Table 1). Due to log scale, differences were more easily detected with lower level expression. Greater sensitivity was attained when both antibodies were utilized.
Figure 1.
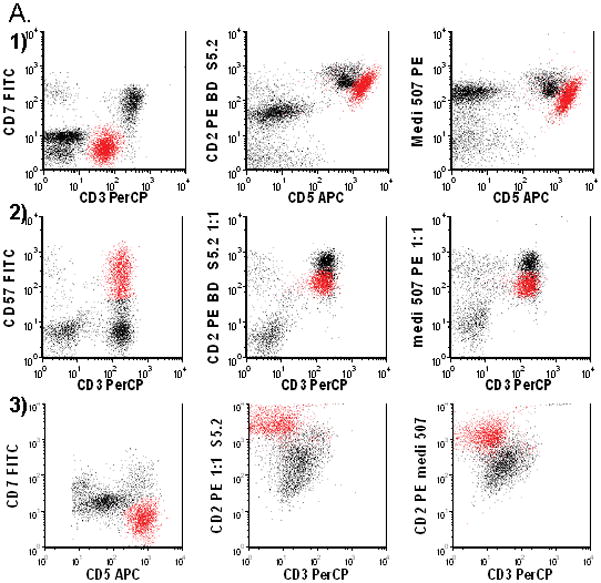
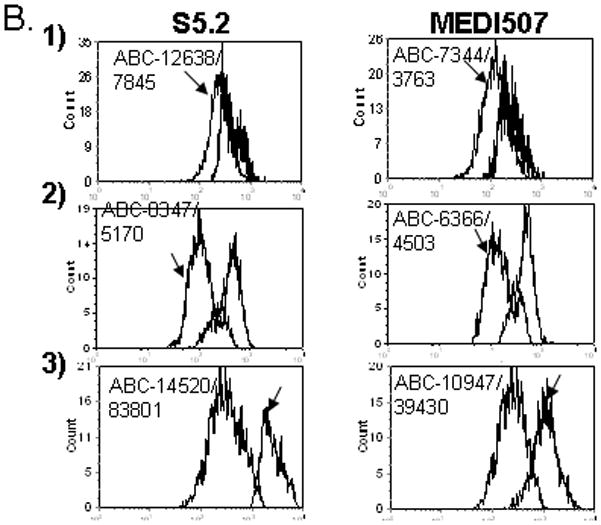
Abnormal expression of CD2 in malignant T cells in 1) patient 4, 2) Patient 23 and 3) Patient 7. A.1) Abnormal T cells (red) have dim CD3, negative CD7, bright CD5 and slightly decreased CD2. 2) Abnormal T cells are CD3 positive, CD57 positive and have dim CD2. 3) Abnormal T cells have bright CD5, negative CD7, negative CD3 and bright CD2. B. Levels of CD2 Expression in Malignant and Normal T Cells as Measured by Anti-CD2 Clones S5.2 and MEDI-507: 1) Malignant T cells (arrow) have a lower level of CD2 expression as measured by S5.2 and MEDI-507. 2) Malignant T cells (arrow) have a lower level of CD2 expression as measured by S5.2 and MEDI-507. 3) Malignant T cells (arrow) have a higher level of CD2 expression as measured by S5.2 and MEDI-507.
Table 1.
Antibody bound per cell for anti-CD2 antibodies S5.2 and MEDI-507 in Malignant and Normal T Cells:
| Patient No. | Age | Sex | S5.2 ABC Normal/ Malignant T Cells | S5.2 Dot Plot | MEDI507AB C Normal/ Malignant T Cells | MEDI50 7 Dot Plot | Diagnosis | Specimen |
|---|---|---|---|---|---|---|---|---|
| 1 | 36 | M | 14654/ 9071 19350/ | − | 7840/ 4883 | − | ATL | PB |
| 2 | 42 | M | 15475 17022/ | − | 7572/ 6198 | − | ATL | PB |
| 3 | 51 | M | 28333 | − | 6543/ 12336 | − | ATL | PB, FNA |
| 4 | 39 | F | 12638/ 7845 13947/ | + | 7344/ 3763 | + | ATL | PB |
| 5 | 81 | F | 14254 11514/ | − | 7028/ 7055 | − | ATL | PB |
| 6 | 48 | F | 13992 14520/ | − | 6941/ 8914 10947/ | − | ATL | PB |
| 7 | 51 | F | 83801 22722/ | + | 39430 | + | ATL | FNA |
| 8 | 67 | F | 13090 10595/ | + | 16585/ 8392 | + | ATL | PB |
| 9 | 24 | M | 12377 17858/ | − | 6241/ 6114 | − | ATL | PB |
| 10 | 49 | F | 17422 11818/ | − | 9054/ 8363 | − | ATL | FNA |
| 11 | 56 | F | 11200 18938/ | − | 7506/ 7299 | − | ATL | PB |
| 12 | 53 | F | 28470 | − | NA/ NA | NA | ATL | FNA |
| 13 | 53 | M | NA/ 10638 18975/ | − | NA/ 8670 | − | ATL | PB |
| 14 | 59 | F | 10142 | + | 11733/ 5827 | + | ATL | PB |
| 15 | 37 | F | NA/ 27064 | − | NA/ 11494 | − | ATL | PB |
| 16 | 59 | F | 9009/ 7814 14952/ | − | 6770/ 4091 | − | ATL | PB |
| 17 | 44 | M | 11854 15226/ | − | 5837/ 4870 | − | ATL | PB |
| 18 | 52 | M | 18307 | − | 6015/ 6335 | − | ATL | PB |
| 19 | 45 | M | NA/ 11155 | − | NA/ 11027 | − | ATL | PB |
| 20 | 38 | M | NA/10290 19116/ | − | NA/ 6252 11814/ | − | ATL | PB |
| 21 | 72 | M | 20920 | − | 16090 | − | T-LGL | PB |
| 22 | 65 | M | 14612/ 7114 | + | 8789/ 7238 | − | T-LGL | PB |
| 23 | 59 | M | 8347/ 5170 | + | 6366/ 4503 | + | T-LGL | PB |
| 24 | 54 | M | 15846/ 9774 15649/ | + | 6537/ 4807 | + | T-LGL | PB |
| 25 | 52 | M | 10921 | − | 6617/ 7569 | − | T-LGL | PB |
| 26 | 67 | M | 12042/ 2862 14955/ | + | 4017/ 1222 | + | T-LGL | PB |
| 27 | 65 | F | 11634 17275/ | − | 9921/ 8847 17358/ | − | T- LGL | PB |
| 28 | 52 | F | 16075 28898/ | − | 16733 | − | T-LGL | PB |
| 29 | 57 | F | 21064 | − | NA/ NA | NA | T-LGL | PB |
| 30 | 53 | F | 11508/ 8523 | − | 7183/ 5372 | − | TLGL | PB |
| 31 | 77 | F | 20144/ 5364 | + | 11029/ 2799 | + | T-LGL (γδ) | PB |
| 32 | 65 | F | 14911/ 5494 | + | 11406/ 6566 | + | T-LGL (γδ) | PB |
| 33 | 71 | M | 17176 | − | 11733/ 8854 | − | PTCL | FNA |
| 34 | 72 | F | 21713/ 5727 22623/ | + | 5518/ 3471 | + | PTCL | PB |
| 35 | 79 | F | 15484 19345/ | − | NA/ NA | NA | ALCL | FNA |
| 36 | 58 | M | 11860 | − | 8350/ 5723 | + | CTCL | PB |
Abbreviations: −: no visual difference in CD2 expression by malignant T cells detected in dot plots; + : visual difference in CD2 expression by malignant T cells detected in dot plots; NA: not available; ATL: Adult T cell leukemia/lymphoma; T-LGL: T cell large granular lymphocytic leukemia; T-LGL(γδ): gamma delta T cell large granular lymphocytic leukemia; PTCL:Peripheral T cell lymphoma; ALCL:Anaplastic large cell leukemia/lymphoma; PB-Peripheral blood; FNA: fine needle aspiration.
S5.2 ABC- Antibody bound per cell for anti-CD2 antibody clone S5.2; MEDI-507 ABC- Antibody bound per cell for anti-CD2 antibody clone MEDI-507; αβ T cell type; γδ T cell type; PTCL NOS- Peripheral T cell lymphoma not otherwise specified; CTCL/MF- Cutaneous T cell lymphoma/mycosis fungoides; NA- Not available.
ABC Data on CD2 expression levels in normal and malignant T cells as measured by anti-CD2 clone S5.2 was available in 32 patients (Table 1). In 4 patients the number of normal T cells was too low to determine ABC levels of CD2 expression. CD2 expression as measured by anti-CD2 clone S5.2 differed in malignant T cells compared to normal T cells (p=0.0028 by the Wilcoxon signed rank test). CD2 expression by malignant T cells was lower than normal in 24 patients (75%), with 19 demonstrating 20% or greater decrease in CD2 expression by malignant cells compared to normal T cells (Table 1, Figure 1). The decrease in CD2 expression could be detected by simple visual inspection in 10 of these cases. CD2 expression by malignant T cells was greater than normal in 8 patients, with 5 demonstrating 20% or greater increase in CD2 expression by malignant cells compared to normal T cells (Table 1, Figure 1). The increase in CD2 expression could be detected by simple visual inspection in 1 of these cases (patient 7). In 24 (75%) of the patients, CD2 expression as measured by anti-CD2 clone S5.2 differed from normal (higher or lower) by 20% or greater. Data on levels of CD2 expression in normal and malignant T cells as measured by anti-CD2 clone MEDI-507 was available in 29 patients and again there was a difference when malignant T cells were compared to normal T cells (p=0.0060 by the Wilcoxon signed rank test). CD2 expression by malignant T cells as measured by MEDI507 ABC was lower than normal in 22 patients (76%) with the decrease being detected by visual inspection in 10 patients. CD2 expression by malignant T cells as measured by MEDI507 ABC was higher than normal in 7 patients (24%) with the decrease being detected by visual inspection in 1 patient.
We demonstrated that there was extensive interpersonal variation in levels of normal T cell CD2 expression as measured by anti-CD2 clones S5.2 and MEDI-507 ABCs. Although within a specimen the CD2 expression appeared homogeneous in the normal T cells, the levels measured differed from specimen to specimen. The coefficient of variation (CV) of the CD2 ABCs in normal T cells were 27% using S5.2 antibody and 36% using MEDI-507. As the cells were stained at room temperature instead of 4°C, per NCCLS guidelines for flow cytometric immunophenotyping of hematolymphoid neoplasia(31) observed differences in normal T cell CD2 expression may be due to variable T cell activation and random antigenic modulation. Due to the variation in CD2 expression by normal T cells a diagnosis of aberrant T cells could not be made by anti-CD2 ABC values alone and required visual inspection of multiparametric data.
Although antibody staining was performed under saturating conditions, the number of antibodies bound per cell (ABC values) of anti-CD2 clones S5.2 and MEDI-507 differed. Of the 29 patients with ABC values in normal T cells from both antibodies, 28 (97%) had lower normal T cell ABCs with MEDI-507. The mean difference in ABC values was 6,800 or 30% decrease relative to the mean of the 2 groups (p<0.0001 by the Wilcoxon signed rank test). Of the 33 patients with ABC values from both antibodies in the malignant cells, 30 (91%) have lower levels with MEDI-507. The mean difference in ABC values was 6,100 or 25% decrease relative to the mean of the 2 groups (p<0.0001 by the Wilcoxin signed rank test). Despite the differences in ABC values obtained from the two anti-CD2 clones, there is a strong correlation between S5.2 and MEDI-507 ABC values in malignant T cells (Spearman rank coefficient 0.76, p<0.0001) and normal T cells (Spearman rank coefficient 0.44, p=0.019). This indicates that there is a consistent systematic decreased binding of MEDI-507 compared to the S5.2 anti-CD2 antibody. Since MEDI507 was equally sensitive in detecting aberrant CD2 expression, the decrease binding does not impact upon diagnostic evaluations.
Discussion
T cell lymphomas and leukemias are a heterogeneous group of neoplasms with a broad spectrum of clinical, immunophenotypic, and morphological features, making them at times difficult to differentiate from reactive conditions and non-T-cell neoplasms. The diagnosis of mature T cell neoplasia by FC is usually based upon demonstration of an aberrant T cell population, identified by a qualitative visual inspection of flow cytometry data. Aberrant T cell populations are defined by abnormal intensity of antigen expression, abnormal size (as reflected by increased forward light scatter), failure to express T-cell associated antigens and expression of aberrant/non-T cell antigens. Quantitative flow cytometry can provide an objective measurement of the molecules of antigen on the cell surface (20–22) and thus of abnormal intensity of antigen expression. Since abnormal intensity of antigen expression is a frequently encountered diagnostic feature in T cell malignancies, we investigated the utility of quantitative flow cytometry compared to simple visual inspection of dot plots in the diagnostic evaluation of clinical specimens. Although abnormal levels of CD2 expression have been demonstrated in T cell neoplasia, the reported incidence is low and less than 20% of specimens tested completely lacked CD2 expression (2,4). In this study, we have utilized the non-subjective technology of quantitative flow cytometry to measure the levels of expression of CD2 in normal and malignant T cells in patients with mature T cell lymphoma and leukemia. Abnormal levels of CD2 expression were detected by visual inspection of dot plots in 12 (33%) cases. Malignant T cells exhibited abnormal levels of CD2 expression compared to normal T cells in as determined by antibody binding per cell (ABC) using anti-CD2 clones S5.2 (p=0.0028 by the Wilcoxon signed rank test) and MEDI-507 (p=0.0060 by the Wilcoxon signed rank test) in all cases. None of the specimens demonstrated complete lack of CD2 expression. Malignant T cell CD2 ABCs were lower than normal in the majority of patients (75%), with a smaller group (25%) demonstrating increased levels of CD2 expression by the malignant T cells. In the majority (75%) of the patients CD2 ABCs differed from normal T cell CD2 ABCs by 20% or greater.
CD2 is a surface glycoprotein expressed on all normal mature T cells. In vitro studies indicate that surface CD2 expression is upregulated by stimulation of the TCR/CD3 complex (32). Furthermore, CD2 expression levels in T cells can increase in acute infectious mononucleosis(17). We examine the interpersonal variability of CD2 expression by normal T cells in our series of patients with T cell neoplasia. There was notable interpersonal variation in normal T cell CD2 expression as measured by anti-CD2 clones S5.2 (CV 27%) and MEDI-507 (CV 36%) ABCs. As the cells were stained at room temperature, per NCCLS guidelines for flow cytometric immunophenotyping of hematolymphoid neoplasia (31), the observed differences in normal T cell CD2 expression may be due to variable T cell activation and random antigenic modulation. Our studies confirm that CD2 expression is variable and likely regulated by stimulatory factors present in the patient or during processing of specimens for FC; furthermore, it indicates that abnormal T cell populations can not be defined by determining CD2 ABC values and reference to standard values when staining is performed according to NCCLS guidelines (31). Staining of cells at 4°C might prevent activation and decrease the observed interpersonal variation in CD2 expression by normal T cells. However incorporation of a separate staining protocol for ABC determination is cumbersome and may not be feasible in the standard clinical flow cytometry laboratory. Nevertheless, as long as normal T cells are present as an internal standard, demonstration of abnormal levels of CD2 expression in a T cell population by visual inspection can still be of diagnostic value in FC evaluation for T cell malignancy. If, however, sensitive detection of differences in antigen detection is required, delineation of an aberrant T cell population by multiparametric analysis followed by ABC determinations is recommended. Further studies are necessary to determine if differences in levels of antigen expression, as measured by ABC, will correlate with response to therapeutic antibody therapy directed against said antigen.
In our study the number of antibodies bound per cell (ABC values) of anti-CD2 clone S5.2 was significantly higher than the values obtained with MEDI-507 in normal T cells (p<0.0001 by the Wilcoxon signed rank test) and malignant T cells (p<0.0001 by the Wilcoxon signed rank test). There is a strong correlation between S5.2 and MEDI-507 ABC values in malignant T cells (Spearman rank coefficient 0.76, p<0.0001) and normal T cells (Spearman rank coefficient 0.44, p=0.019), indicating that there is a consistent systematic decreased binding of MEDI-507 compared to the S5.2 anti-CD2 antibody. These results clearly indicates that there is a higher number of anti CD2 clone S5.2 antibodies bound per T cell compared to MEDI-507. These results agree with previous studies indicating that antibody bound per cell measured with monoclonal antibodies (MAbs) directed at the same CD molecule but originating from different clones can give variable results(21,33). Studies have shown that this may be mainly due to differences within the epitopes, binding valency and affinity. Despite the differences in ABC values, both the S5.2 and MEDI-507 anti-CD2 antibodies are useful in detecting abnormal levels of CD2 expression by malignant T cells and the combination of the two resulted in increased sensitivity of detection by visual inspection.
In summary, we have demonstrated that malignant T cells frequently demonstrate abnormal levels of CD2 expression and evaluation of sub-populations of T cells with lower or higher levels of CD2 expression is recommended to rule out neoplasia. Quantitation of CD2 expression in such populations is more sensitive than visual inspection of dot plots. It is of limited practical diagnostic utility since anti-CD2 ABCs can not be compared to a normal reference value, due to the significant variation in normal T cell anti-CD2 ABCs. However, the increased sensitivity of CD2 quantitation is valuable in confirming FCI cases where abnormalities in CD2 expression are difficult to appreciate by visual inspection alone.
References
- 1.Swerdlow SHCE, Harris NL, Jaffe ES, Pileri SA, Stein H, Thiele J, Vardiman JW. WHO Classification of Tumours of Haematopoietic and Lymphoid Tissues. IARC Press; Lyon, France: 2008. [Google Scholar]
- 2.Jamal S, Picker LJ, Aquino DB, McKenna RW, Dawson DB, Kroft SH. Immunophenotypic analysis of peripheral T-cell neoplasms. A multiparameter flow cytometric approach. Am J Clin Pathol. 2001;116:512–526. doi: 10.1309/QF6N-VAQW-N74H-4JE2. [DOI] [PubMed] [Google Scholar]
- 3.Juco J, Holden JT, Mann KP, Kelley LG, Li S. Immunophenotypic analysis of anaplastic large cell lymphoma by flow cytometry. American Journal of Clinical Pathology. 2003;119:205–212. doi: 10.1309/HEFL-7KC4-35KF-WEX8. [DOI] [PubMed] [Google Scholar]
- 4.Gorczyca W, Weisberger J, Liu Z, et al. An approach to diagnosis of T-cell lymphoproliferative disorders by flow cytometry. Clinical Cytometry. 2002;50B:177–190. doi: 10.1002/cyto.10003. [DOI] [PubMed] [Google Scholar]
- 5.Ahmad E, Garcia D, Davis BH. Clinical utility of CD23 and FMC7 antigen coexistent expression in B-cell lymphoproliferative disorder subclassification. Cytometry ( Clinical Cytomerty) 2002;50:1–7. [PubMed] [Google Scholar]
- 6.Lundell RHL, Hill S, Perkins SL, Bahler DW. T-cell large granular lymphocyte leukemias have multiple phenotypic abnormalities involving pan-T-cell antigens and receptors for MHC molecules. Am J Clin Pathol. 2005;124(6):937–946. [PubMed] [Google Scholar]
- 7.Dahmoush LHY, Barnes E, Stetler-Stevenson M, Abati A. Adult T-cell leukemia/lymphoma - A cytopathologic, immunocytochemical, and flow cytometric study. CANCER CYTOPATHOLOGY. 2002;96(2):110–116. doi: 10.1002/cncr.10480. [DOI] [PubMed] [Google Scholar]
- 8.Morice WKPJ, Leibson PJ, Tefferi A, Hanson CA. Demonstration of aberrant T-cell and natural killer-cell antigen expression in all cases of granular lymphocytic leukaemia. BRITISH JOURNAL OF HAEMATOLOGY. 2003;120(6):1026–1036. doi: 10.1046/j.1365-2141.2003.04201.x. [DOI] [PubMed] [Google Scholar]
- 9.Yuan CVJA, Zhao XF, Smith TK, Harris NL, Bagg A. CD10 and BCL6 expression in the diagnosis of angioimmunoblastic T-cell lymphoma: utility of detecting CD10(+) T cells by flow cytometry. HUMAN PATHOLOGY. 2005;36(7):784–791. doi: 10.1016/j.humpath.2005.05.008. [DOI] [PubMed] [Google Scholar]
- 10.Ferenczi KYN, Jones D, Kupper TS. Monitoring the decrease of circulating malignant T cells in cutaneous T-Cell lymphoma during photopheresis and interferon therap. ARCHIVES OF DERMATOLOGY. 2003;139(7):909–913. doi: 10.1001/archderm.139.7.909. [DOI] [PubMed] [Google Scholar]
- 11.Morice WKJA, Pittelkow MR, el-Azhary RA, Gibson LE, Hanson CA. A comparison of morphologic features, flow cytometry, TCR-V-beta analysis, and TCR-PCR in qualitative and quantitative assessment of peripheral blood involvement by Sezary syndrome. Am J Clin Pathol. 2006;125(3):364–374. [PubMed] [Google Scholar]
- 12.Lima M, Almeida J, Santos AH, et al. Immunophenotypic Analysis of the TCR-V repertoire in 98 persistent expansions of CD3+/TCR large granular lymphocytes. American Journal of Pathology. 2001;159:1861–1868. doi: 10.1016/s0002-9440(10)63032-5. [DOI] [PMC free article] [PubMed] [Google Scholar]
- 13.Edelman JMH. Diminished CD3 expression is useful for detecting and enumerating Sezary cells. Am J Clin Pathol. 2000;114(3):467–477. doi: 10.1093/ajcp/114.3.467. [DOI] [PubMed] [Google Scholar]
- 14.Kuchnio M, Sausville EA, Jaffe ES, Gr T, Foss FM, McClanan M, Stetler-Stevenson M. Flow cytometric detection of neoplastic T cells in patients with mycosis fungoides based upon levels of T-cell receptor expression. Am J Clin Pathol. 1994;102:856–860. doi: 10.1093/ajcp/102.6.856. [DOI] [PubMed] [Google Scholar]
- 15.Yokote TAT, Oka S, Hara S, Kobayashi K, Nakajima H, Yamano T, Ikemoto T, Shimizu A, Tsuji M, Hanafusa T. Flow cytometric immunophenotyping of adult T-cell leukemia/lymphoma using CD3 gating. AMERICAN JOURNAL OF CLINICAL PATHOLOGY. 2005;124(2):199–204. doi: 10.1309/KEN4-MXM5-Y9A1-GEMP. [DOI] [PubMed] [Google Scholar]
- 16.Sayre P, Reinherz EL. Structure and function of the erythrocyte receptor CD2 on human T lymphocytes: a review. Scand J Rheumatol Suppl. 1988;76:131–144. doi: 10.3109/03009748809102963. [DOI] [PubMed] [Google Scholar]
- 17.Lima M, Teixeira MD, Queiros ML, Santos AH, Goncalves C, Correia J, Farinha F, Mendonca F, Soares JMN, Almeida J, Orfao A, Justica B. Immunophenotype and TCR-V beta repertoire of pperipheral blood T-cells in acute infectious mononucleosis. Blood cells molecules and disease. 2003;10:1–12. doi: 10.1016/s1079-9796(03)00014-7. [DOI] [PubMed] [Google Scholar]
- 18.Ginaldi LFN, Matutes E, DeMartinis M, Morilla R, Catovsky D. Differential expression of T cell antigens in normal peripheral blood lymphocytes: A quantitative analysis by flow cytometry. JOURNAL OF CLINICAL PATHOLOGY. 1996;49(7):539–544. doi: 10.1136/jcp.49.7.539. [DOI] [PMC free article] [PubMed] [Google Scholar]
- 19.Pannu KKJE, Iyer SB. Performance evaluation of QuantiBRITE phycoerythrin beads. Cytometry. 2001;45(4):250–258. doi: 10.1002/1097-0320(20011201)45:4<250::aid-cyto10021>3.0.co;2-t. [DOI] [PubMed] [Google Scholar]
- 20.Schwartz A, Marti GE, Poon R, Gratama JW. Fernández-Repollet, E Standardizing flow cytometry: A classification system of fluorescence standards used for flow cytometry. Cytometry. 1998;33(2):106–114. [PubMed] [Google Scholar]
- 21.Gratama JW, D'hautcourt J, Mandy F, Rothe G, Barnett D, Janossy G, Papa S, Schmitz G, Lenkei R. The European Working Group on Clinical Cell Analysis Flow cytometric quantitation of immunofluorescence intensity: Problems and perspectives. Cytometry. 1998;33(2):166–178. doi: 10.1002/(sici)1097-0320(19981001)33:2<166::aid-cyto11>3.0.co;2-s. [DOI] [PubMed] [Google Scholar]
- 22.Vogt RFWW, Henderson LO, Hannon WH. Fluorescence intensity calibration for immunophenotyping by flow cytometry. METHODS-A COMPANION TO METHODS IN ENZYMOLOGY. 2000;21(3):289–296. doi: 10.1006/meth.2000.1009. [DOI] [PubMed] [Google Scholar]
- 23.Iyer SBHL, Zawadzki JA, Davis KA, Giorgi JV. Quantitation of CD38 expression using QuantiBRITE (TM) beads. Cytometry. 1998;33(2):206–212. doi: 10.1002/(sici)1097-0320(19981001)33:2<206::aid-cyto15>3.0.co;2-y. [DOI] [PubMed] [Google Scholar]
- 24.Marti G, et al. In: Clinical and Laboratory Standards Institute (CLSI) Document ILA24-A:Fluorescence Calibration and Quantitative Measurement of Fluorescence Intensity; Approved Guideline. Marti G, et al., editors. Wayne, Pennsylvania, 19087–1898 USA: Clinical and Laboratory Standards Institute; 2004. [Google Scholar]
- 25.Ginaldi L, De Martinis M, Matutes E, Farahat N, Morilla R. Levels of expression of CD19 and CD20 in chronic B cell leukaemias. J Clin Pathol. 1998;51:364–369. doi: 10.1136/jcp.51.5.364. [DOI] [PMC free article] [PubMed] [Google Scholar]
- 26.Rossmann ELR, Lundin J, Mellstedt H, Osterborg A. Performance of calibration standards for antigen quantitation with flow cytometry chronic lymphocytic leukemia. CYTOMETRY PART B-CLINICAL CYTOMETRY. 2007;72B(5):363–379. doi: 10.1002/cyto.b.20359. [DOI] [PubMed] [Google Scholar]
- 27.Ginaldi LDMM, D'Ostilio A, Marini L, Loreto F, Modesti M, Quaglino D. Changes in the expression of surface receptors on lymphocyte subsets in the elderly: Quantitative flow cytometric analysis. AMERICAN JOURNAL OF HEMATOLOGY. 2001;67(2):63–72. doi: 10.1002/ajh.1082. [DOI] [PubMed] [Google Scholar]
- 28.Ginaldi LDMM, Matutes E, Farahat N, Morilla R, Dyer MJS, Catovsky D. Levels of expression of CD52 in normal and leukemic B and T cells: Correlation with in vivo therapeutic responses to Campath-1H. LEUKEMIA RESEARCH. 1998;22(2):185–191. doi: 10.1016/s0145-2126(97)00158-6. [DOI] [PubMed] [Google Scholar]
- 29.Hsi E, Kopecky KJ, Appelbaum FR, et al. Prognostic significance of CD38 and CD20 expression as assessed by quantitative flow cytometry in chronic lymphocytic leukaemia. Blood. 2003;120:1017–1025. doi: 10.1046/j.1365-2141.2003.04213.x. [DOI] [PubMed] [Google Scholar]
- 30.Hernandez-Campo PMJ, Almeida Matarraz S, de Santiago M, Sanchez ML, Orfao A. Quantitative analysis of the expression of glycosylphosphatidylinositol-anchored proteins during the maturation of different hematopoietic cell compartments of normal bone marrow. Cytometry B Clin Cytom. 2007;72(1):34–42. doi: 10.1002/cyto.b.20143. [DOI] [PubMed] [Google Scholar]
- 31.Stetler-Stevenson M, Ahmad E, Barnett D, et al. Clinical and Laboratory Standards Institute. Clinical Flow Cytometric Analysis of Neoplastic Hematolymphoid Cells; Approved Guideline-Second Edition. In: Stetler-Stevenson M, Ahmad E, Barnett D, et al., editors. CLSI document H43-A2. Wayne, Pennsylvania, 19087-1898 USA: Clinical and Laboratory Standards Institute; 2005. [Google Scholar]
- 32.ALBEROLAILA JPL, DELACALLE O, ROMERO M, YAGUE J, GALLART T, VIVES J, LOZANO F. STIMULATION THROUGH THE TCR/CD3 COMPLEX UP-REGULATES THE CD2 SURFACE EXPRESSION ON HUMAN LYMPHOCYTES-T. JOURNAL OF IMMUNOLOGY. 1991;146(4):1085–1092. [PubMed] [Google Scholar]
- 33.Davis KAAB, Iyer SB, Hoffman RA, Bishop JE. Determination of CD4 antigen density on cells: Role of antibody valency, avidity, clones, and conjugation. CYTOMETRY. 1998;33(2):197–205. doi: 10.1002/(sici)1097-0320(19981001)33:2<197::aid-cyto14>3.0.co;2-p. [DOI] [PubMed] [Google Scholar]