Abstract
Transient stretching of the ventricle can trigger arrhythmias and evoke ventricular fibrillation especially when the stimulation occurs in the vulnerable period. To explore the sensitivity of small hearts we used a commercial pressure servo (HSPC-1, ALA Scientific, USA) to study the kinetic relationship of left ventricular pressure (LVP) to excitability and arrhythmias in the rat heart. Stimulation protocols were readily composed in the computer and programmed to vary the stimulus amplitude and timing relative to pacing. The pressure induced premature ventricular excitations were similar to those observed in larger hearts, but the convenience of using small hearts allows the use of inexpensive transgenic animals to explore the molecular basis of transduction.
Keywords: mechanoelectric coupling, ventricular pressure clamp, premature ventricular excitation
Introduction
Most ion channels are mechanosensitive (Hu & Sachs, 1997) including those called voltage dependent (Lin et al., 2007; Morris & Juranka, 2007) and ligand gated (Van Wagoner, 1993; Link et al., 1999) types. In a dynamically contracting organ like the heart, time dependent mechanical stresses are the normal environment and it is reasonable to suppose that there is a coupling between mechanosensitive channels and stress in the heart. To study this coupling requires a controlled mechanical stimulus, and we have found that a commercial pressure servo developed for patch clamping (Besch et al., 2002; Niu & Sachs, 2003; Suchyna et al., 2004a; Suchyna et al., 2004b; Suchyna & Sachs, 2007) can apply controlled stimuli to small hearts. The ability to dissect the molecular mechanisms of stretch induced arrhythmias requires transgenic animals such as mice, so we needed to develop a robust measuring system that can reliably generate controlled mechanosensitive arrhythmias. Mechanical transduction, irrespective of mechanism, is commonly termed mechanoelectric coupling (MEC) (Lab, 1989) or mechanoelectric feedback (MEF) (Kohl et al., 2005).
Pro-arrhythmic effects of mechanical stimulation were noticed clinically over a century ago (Commotio cordis) (Madias et al., 2008). MEC is now commonly observed when a cardiac catheter touches the endocardium and generates extra systoles. Mechanical stimulation induces arrhythmias in many, if not all, species including humans (Taggart et al., 1992; Taggart & Lab, 2008), pigs (Madias et al., 2008), dogs (Hansen et al., 1990), rabbits (Zabel et al., 1996; Bode et al., 2006), lambs (Chen et al., 2004), and rats (Salmon et al., 1997). MEC has been studied in a variety of preparations including the whole organ (in vivo or in vitro) (Franz et al., 1992; Link, 2003), bundles of muscle (papillary muscle (Nicolosi et al., 2004), trabecula (Wilhelm et al., 2006), etc.), isolated cells (Zeng et al., 2000; Niu & Sachs, 2003; Nishimura et al., 2006; Liu et al., 2008) and cultured cell sheets (Kong et al., 2005).
The relationship of mechanical stimulation to the generation of arrhythmias in the intact heart is best studied by stretching the chambers. In canine heart, inflation of the ventricle to approximately double the end of diastole volume raised the chance of a premature ventricular excitation (PVE) to 50% (Hansen et al., 1990). In the isolated rabbit ventricle, volume pulses could successfully pace the heart (Franz et al., 1992). Kinetic and pharmacologic studies have repeatedly suggested that acute mechanical stimuli act on mechanosensitive ion channels and most likely, the cation selective stretch-activated variety known as stretch-activated channels (SACs) (Kamkin et al., 2001; Kelly et al., 2006). We have repeated a number of these studies in the rat heart to develop a technique that we will apply to the smaller mouse heart.
Methods
All animal experimental procedures were approved by the Institutional Animal Care and Use Committee of the Capital Medical University, Beijing, China, and performed in accordance with “Regulations for the Administration of Affairs Concerning Experimental Animals (the State Science and Technology Commission, China, 1988)”.
Preparation and perfusion of the heart
We used thirty-five Sprague-Dawley rats of either sex weighing from 230 to 250 g. After the rat was anesthetized with sodium pentobarbital (50 mg/kg) and heparinized (2500 IU/kg), the heart was rapidly removed and cannulated via aorta in a Langendorff apparatus and perfused with a modified Tyrode's solution at 8 mL/min and at 37 °C. The perfusate contained (mmol/L): 137 NaCl, 5.4 KCl, 1.8 CaCl2, 1.2 MgCl2, 5 HEPES, 10 Glucose, buffered at pH 7.4 with NaOH and bubbled continuously with 100% oxygen. Gadolinium chloride (GdCl3), verapamil and streptomycin sulfate (Sigma-Aldrich, St. Louis, MO, USA) were dissolved in the perfusate to give concentrations of 50, 1 and 500 μmol/L, respectively.
Recording of cardiac electric activities
The heart was routinely paced at 260 ms (SEN-3301, Nihon Kohden, Tokyo, Japan) using a small bipolar hooked electrodes of stainless steel thread, 0.15 mm in diameter, separated by 1.5 mm. These were placed on the surface of the right ventricle. The epicardial monophasic action potential (MAP) of the left ventricle (LV) was recorded with a suction electrode. The epicardial electrocardiogram (ECG) was recorded with two hooked electrodes (similar to the pacing electrodes, but monopolar) placed on the surfaces of the right atrium and LV, respectively. MAP, ECG and left ventricular pressure (LVP, see below) were amplified, filtered, digitized and acquired with a four-channel computer controlled data system (BL-420 System, TME Technology, Chengdu, China).
Ventricular pressure clamping
The pressure servo or “pressure clamp” (HSPC-1, ALA Scientific Instruments, Westbury, NY, USA) has been used in patch clamp studies of stretch-activated channels in astrocytes (Suchyna et al., 2004a), myotubes (Suchyna & Sachs, 2007), COS cells (Honore et al., 2006) and cardiac myocytes (Niu & Sachs, 2003). The pressure clamp utilizes a piezoelectric mixing valve for pressure and vacuum with closed-loop feedback from a pressure transducer. The system rise time is about 1 ms with a closed exit tube about 20 cm in length.
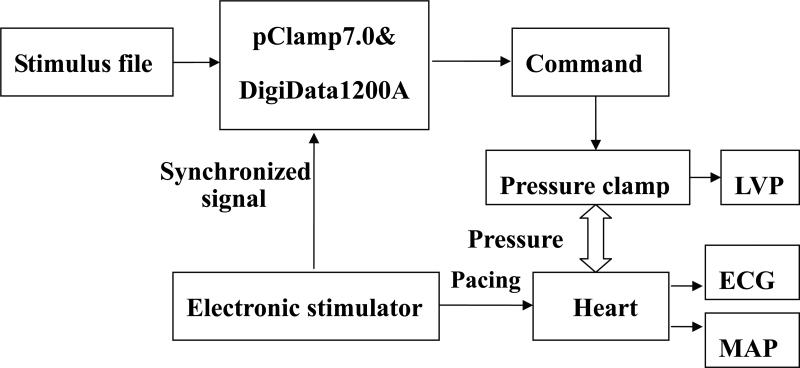
The HSPC-1 was introduced as a ventricular mechanical stimulator by Wei et al (Wei et al., 2006). In brief, a latex balloon filled with air was inserted into the LV via the left atrium and connected with the pressure outlet of the pressure clamp. The connecting tube was stiff and as short as possible (20 cm long and 1 mm in inside diameter). Fig.1 illustrates the signal flows. LVP was set by the pressure clamp and recorded with ECG and MAP simultaneously. A trigger from the pacing stimulator triggered pClamp7.0 software and the DigiData1200A acquisition board (Axon Instrument Inc., Foster City, CA, USA). pClamp software ran pre-edited stimulation files to control the pressure clamp.
Figure 1. Flow chart of ventricular pressure clamping.
The pressure clamp was controlled by analog voltages from the interface generated in response to pre-edited stimulus protocols. The double ended arrow denotes the pressure transfer with a connecting tube. The left ventricular pressure (LVP), epicardial electrocardiogram (ECG) and left ventricular monophasic action potential (LVMAP) were recorded synchronously.
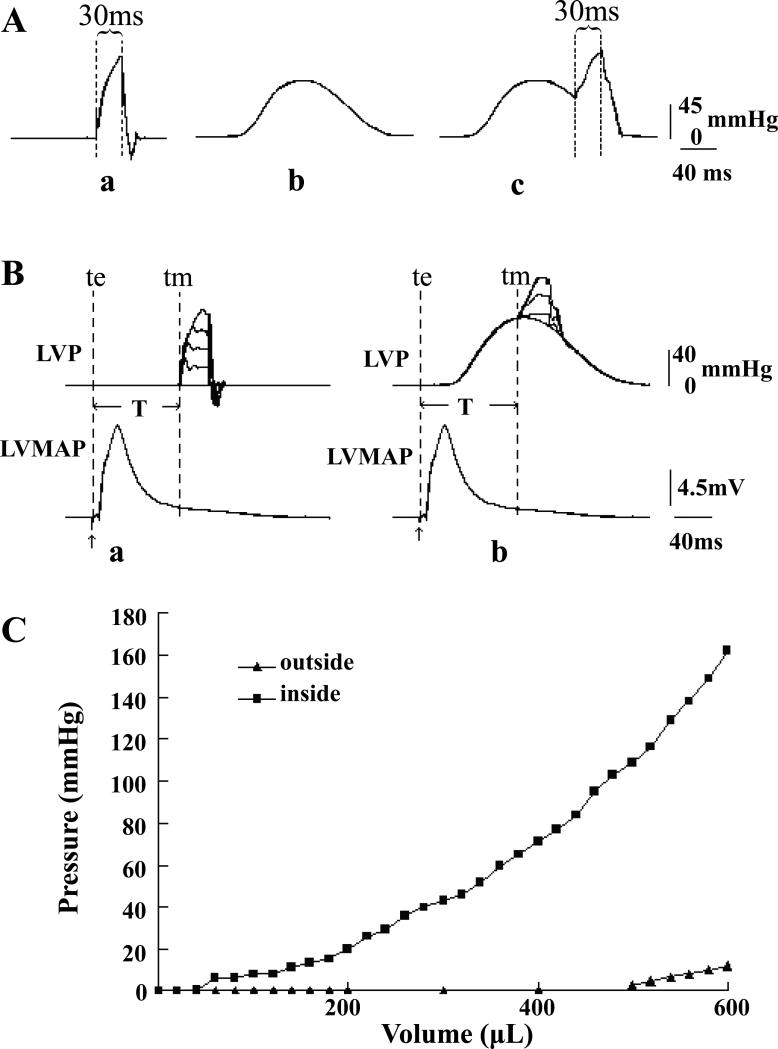
The controlled LVP was independent of cardiac contraction creating four basic modes of mechanical stimulation (Fig. 2): 1) Zero load contraction by holding the ventricular pressure at 0 mmHg continuously (not shown). 2) Pressure pulses with adjustable intensity and timing delivered at different phases of the pacing cycle with zero load (Fig. 2Aa). 3) Mimicking an isovolumic contraction by replaying a pressure waveform from an isovolumic contraction that had been prerecorded with the ventricular balloon filled with water. The LVP during the rest period between stimuli was set at 0 mmHg (Fig. 2Ab). We termed this mode isovolumic pressure profile (IPP). 4) Variations of the IPP with additional transient mechanical stretches (Fig. 2Ac).
Figure 2. Pressure-clamping modes and the pressure-volume curves of the balloon inside and outside the LV.
The LVP could be clamped at 0 mmHg continuously (not shown) and there were three other modes. Fig. Aa: clamping with a short pressure pulse from a background pressure of 0 mmHg. Fig. Ab: clamping with an isovolumic pressure profile (IPP). Fig. Ac: clamping with a short pressure pulse superimposed on an IPP. Panel B shows an example of the timing of LVP clamping relative to LVMAP. T is the coupling time defined as the time from the beginning of a pacing signal (te) to pressure pulse (tm). Panel C shows pressure-volume relations when the LV balloon was outside (▲) and inside (■) the LV. See text for more detail.
Fig. 2B illustrates the timing of a mechanical pulse with the left ventricular MAP (LVMAP) during a fixed pacing rhythm. The coupling interval (T) was defined as T = tm-te where te denotes the start of the pacing (excitation) signal and tm the start of the pressure (mechanical) pulse. In each run, the stimulus was repeated ten times and the incidence of resultant PVEs counted to compute the probability of occurrence. To minimize adaptation (Dick & Lab, 1998), the rest interval was set to 60 s.
The pressure clamp was designed originally to meet the demands of fixed volume pipettes. Since the left ventricle has a much larger volume than a pipette, the rise time was slower and the maximum pressure was smaller, but these limits can be extended with a redesign of the valve and the use of smaller hearts. Fig. 2 shows that the rise time of a 120-mmHg pressure pulse was about 30 ms and the fall time was 10-20 ms (Fig. 2A), so a practical minimum pulse was close to 50 ms. The maximum pressure output was 150 mmHg.
The balloon pressure from the clamp is balanced by both the elasticity of the balloon and the LV, and to gain an idea contribution of the passive balloon we compared pressure-volume curves with the balloon in air and inside the LV with the balloon filled with water. The heart was perfused with Thomas solution (contains K+ 16 mmol/L) at 37 °C to stop beating and Fig. 2C shows that the pressure for the balloon increased much more inside the LV than in air indicating that the inflation pressure was dominated by the LV. The balloon absorbed about 10 mmHg when LV was inflated to 150 mmHg and since the wall stiffness increases during contraction, the fractional error for the balloon elasticity will decrease.
Statistics analysis
Data are presented as means ± SD. A two-way analysis of variance (ANOVA) followed by multiple comparisons in ANOVA was performed to compare the effects of the coupling interval (T) and the amplitude of the pressure pulse on PVE incidence. Student's paired t test was applied to compare the effects of gadolinium chloride and streptomycin sulfate on PVE incidence. All data analysis was performed by means of SPSS software (SPSS, Chicago, IL, USA). Values of P<0.05 were considered statistically significant.
Results
Effects of pressure pulse stimulation from 0 mmHg
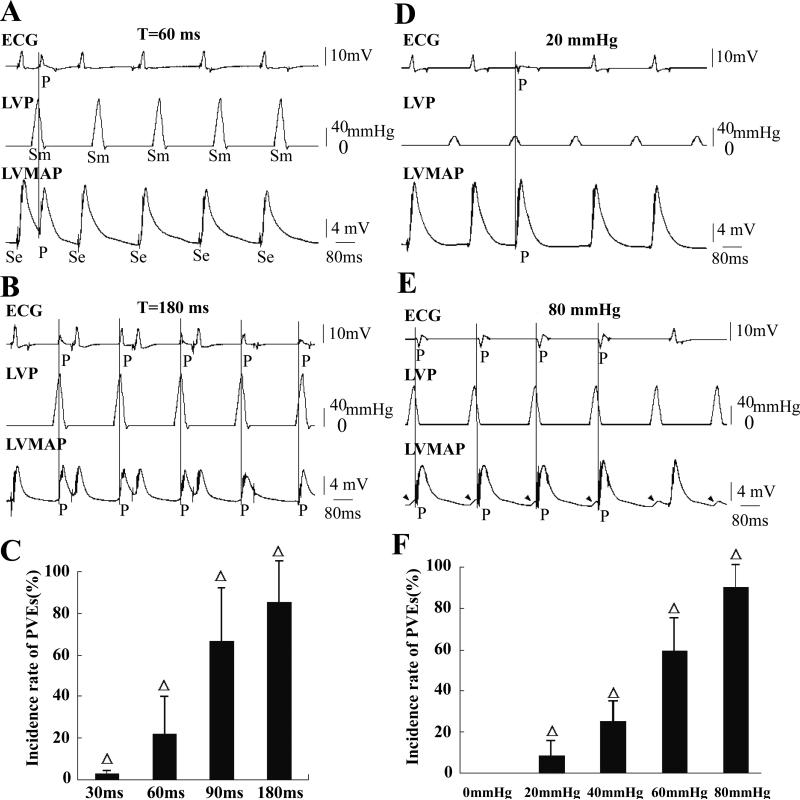
To investigate the time-dependence of mechanical stimulation we applied pulses of 120 mmHg when the LVP was held at a background of 0 mmHg. Figs. 3A and B show two records from the same heart with pulses of T= 60 and 180 ms when the ventricle was paced every 260 ms. In Fig. 3A, pressure pulses induced only one PVE at T=60 ms. Fig. 3B shows five PVEs at T=180 ms, but there were eight extrasystoles in the ten repetitions. The statistical data for the timing effects on the PVE incidence is shown in Fig. 3C (n=15, P<0.01). PVEs increased with the delay of the pressure pulse and recovery of excitability.
Figure 3. Effects of pressure pulses when holding ventricular pressure at 0 mmHg.
The ventricle was electrically paced at a cycle length of 260 ms. P denotes a PVE caused by pressure stimulation and the vertical line marks the time of PVE occurrence. In this figure LVP was held at a background 0 mmHg. The electrical pacing artifact (Se) and the mechanical stimulus (Sm) are marked only in A. Pressure pulses of 120 mmHg were delivered with coupling intervals (T) of 30, 60, 90 and 180 ms. Only records for T= 60 ms and T=180 ms are shown in A and B, respectively. PVE incidence increased as T lengthened from 30 to 180 ms (C, n=15, Δ: P<0.01 vs each other). In D and E, the left ventricle was exposed to pressure pulses of 20 and 80 mmHg delivered at T=180 ms, respectively. More PVEs were induced by the larger pressures (F, n=15, Δ: P<0.01 vs 0 mmHg group and each other). In E, stretch activated depolarizations (SADs) marked with arrowheads and four were followed by PVEs.
We then tested the pressure-dependence of PVE triggering (Fig. 3). Figs. 3D and E were recorded in the same heart with T=180 ms but with different pressures. No PVEs occurred at 0 mmHg (record not shown), while sporadic PVEs could be provoked by 20 mmHg (Fig. 3D), and four PVEs were initiated by 80 mmHg (Fig. 3E) with a monotonic dependence of PVE incidence on pressure (Fig. 3F). We found it surprising that pulses as small as 20 mmHg significantly increased the occurrence of PVEs (Fig. 3F, n=15, P< 0.01). In the records of Fig. 3, vertical lines mark the beginning of PVEs. They usually occurred near when the pressure had peaked (also in Figs. 5A, B and G).
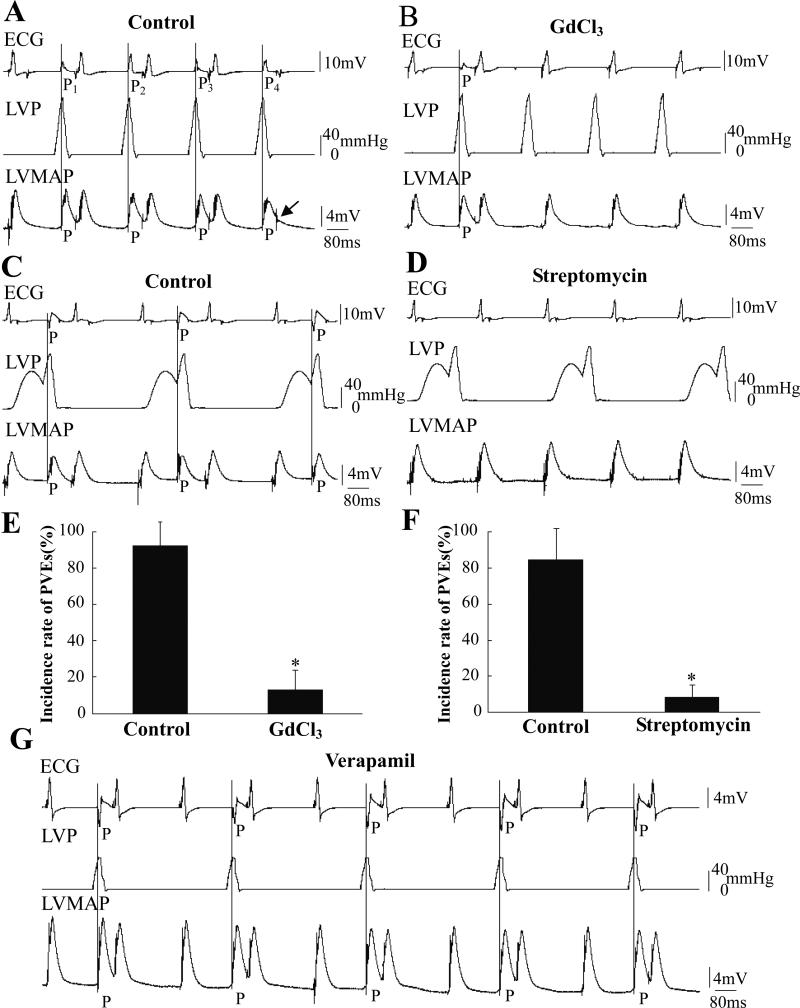
Figure 5. Effects of GdCl3 and streptomycin on pressure-induced PVEs.
A and B were recorded in the same heart before and after application of GdCl3. The LV was regularly inflated by pulses of 120 mmHg at T=180 ms from a resting pressure of 0 mmHg. In A, four numbered PVEs with four different shapes might indicate multiple PVE loci. The arrow in A indicated a pacing signal failed to pace the heart that occurred during the effective refractory period of the previous PVE. C and D were recorded before and after application of 500 μM streptomycin. The LV was regularly inflated by pulses of 120 mmHg with T=150 ms superimposed on the IPP during every other pacing cycle. The incidence of PVEs decreased after treatment with Gd3+ and streptomycin (E and F, n=14, *: P<0.01 vs. control). G shows a record when the LVP was held at 0 mmHg and stimulated with 60-mmHg pulse for T=180 ms after application of 1 μM verapamil. The PVEs caused by pressure pulses could not be blocked by verapamil in five hearts.
Extra pressure pulses combined with IPP
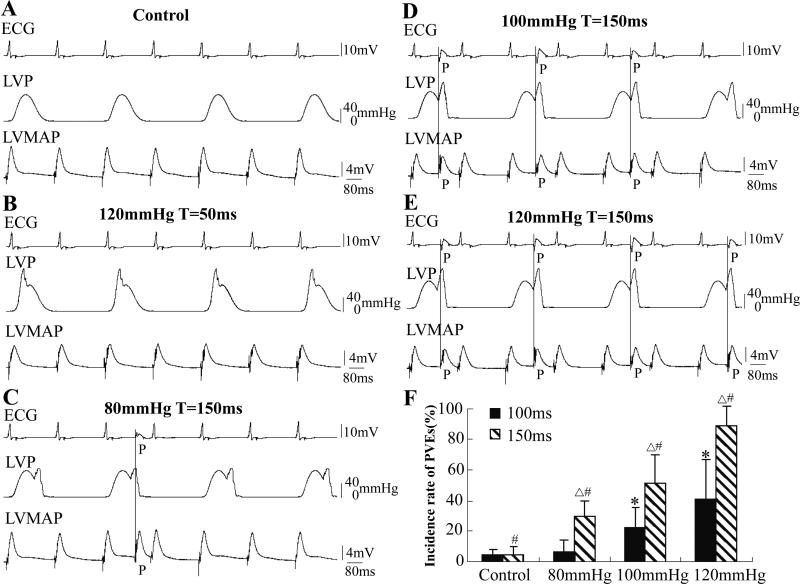
Ventricular pressure fluctuates cyclically with the cardiac rhythm. To better investigate the effects of transient pressure pulses in a loaded condition, we superimposed pressure pulses during the isovolumic contraction. The traces in Fig. 4 show the records from the same heart. The LV was alternately held at 0 mmHg and clamped with IPP from cycle to cycle. No PVEs occurred during a normal IPP (Fig. 4A). Pressure pulses of 120 mmHg with T=50 ms delivered during the rising phase of the isovolumic contraction could not induce PVEs (Fig. 4B). PVE frequency increased with the amplitude of the pressure pulse after repolarization (T=150 ms, Figs. 4C, D and E). Fig. 4E shows that every pressure pulse of 120 mmHg was followed by a PVE. Fig. 4F summarizes the data showing the PVE dependence on the intensity and timing of the pressure pulse stimulation (n=9, P<0.01). This data suggest that an abrupt increase of LVP in a range relevant to the physiological situation will induce PVEs. Pressure pulses applied during IPP caused PVEs most commonly at the beginning of the pressure pulse (Figs. 4D and E; also in Fig. 5C).
Figure 4. Effects of pressure pulses during IPP (the same heart).
No PVEs occurred when the LV was alternately held at 0 mmHg and clamped with an isovolumic contraction beat by beat (A). Pulses of 120 mmHg with short T (50 ms) could not induce a PVE (B). In C, D and E, transient pulses of 80, 100 and 120 mmHg with T=150 ms were superimposed on the IPP, respectively. F shows the data summary, focusing on the effects of intensity and timing of the pressure pulse. Δ signifies P<0.01 compared to the paired 100 ms group; # signifies P<0.01 compared to each other in the 150 ms group; * signifies P<0.01 compared to each other, the control, and 80 mmHg in the 100 ms group; n=9.
Blocking pressure-induced PVEs with gadolinium ion and streptomycin
Cardiac MEC has been attributed to the activation of SACs. We tested whether PVEs were related to SAC activity by using pharmacologic blockers. Fig. 5 shows that Gd3+ and streptomycin inhibited PVEs frequency. Before application of Gd3+, four PVEs were induced with four pressure pulses (Fig. 5A) while with 50 μM Gd3+ only one PVE occurred after 20 min of perfusion (Fig. 5B). Streptomycin (500 μM perfused for 20 min) also blocked pressure-induced PVEs (Figs. 5C and D). The statistics emphasize that the incidence of PVEs decreased significantly (92% to 13%) after Gd3+ treatment and from 87% to 7% after streptomycin treatment (Figs. 5E and F, P<0.01, n=14).
Because L-type calcium channels have been shown to be stretch-sensitive (Morris et al. 2006) and might be also blocked by Gd3+ (Lacampagne et al., 1994), we tested the specific L-type calcium channel blocker verapamil. After perfusion with 1 μM verapamil for 10 min (5 hearts), contraction was greatly reduced but PVEs could still be regularly induced by pressure pulses (Fig. 5G).
Discussion
Methodology of the ventricular pressure clamping: advantages and limitations
The air driven pressure clamp was introduced by Hamill and McBride (McBride & Hamill, 1992) to control the pressure on a patch. Besch et al (Besch et al., 2002) improved that design and ALA produced it under the model name HSPC-1. In the small volume of pipettes the rise time is ~ 1 ms with a range of ±200 mmHg, but the pressure range and volume flow is mostly set by the supply pumps and can be easily extended with larger pumps. The off the shelf device gave us a range of about 150 mmHg and a rise time of about 30 ms. Note that the use of a balloon is not necessary if the ventricle is filled with fluid although the HSPC should be placed above the heart to minimize the chance of fluid entry to the valve. This is particularly relevant for application to the smaller mouse heart. The present study shows that the pressure clamp is a powerful yet inexpensive tool to control the ventricular pressure of small hearts. Computer control allows arbitrary waveform stimulation emulating a variety of physiological scenarios. For example, the clamp can mimic a normal ventricular ejective contraction if we record the ventricular pressure/time curve during ejective systole in situ. With repeatable and controllable pressure stimuli it is now possible to explore the molecular correlates of molecular transduction with transgenic animals.
Reverse excitation-contraction coupling: stretch-induced vs. de-stretch-induced arrhythmias
Stretch-induced arrhythmias in variety of cardiac preparations, has been attributed to activation of SACs and termed MEC, a process of reverse excitation-contraction coupling (ECC). There is another type of reverse ECC that typically happens after a quick release of a cardiac myocyte during contraction (Kaufmann et al., 1971; Lab et al., 1984; Wakayama et al., 2005; Ter Keurs et al., 2008). Rapid unloading decreases the affinity of Ca2+ for troponin C and results in a surge of [Ca2+]i followed by delayed afterdeplarization and triggered action potentials. This type of feedback has recently been emphasized for non-uniform contractions (Ter Keurs et al., 2008). The ventricle is not homogeneous in fiber orientation, mechanics and electrophysiology between different layers or regions, especially between Purkinje and working fibers. According to the reports (Wakayama et al., 2005; Ter Keurs et al., 2008), a border zone between the stronger and weaker myocytes might become a locus of a [Ca2+]i surge. It is possible that a de-stretch mechanism might be involved in the pressure pulse-induced PVE, especially when the pulse reached the peak, the start of the pressure fall. However, in our experiments, after treatment with verapamil that will block Ca2+ influx, the contraction was greatly inhibited and [Ca2+]i would be low during excitation, but the pressure pulse still regularly induced premature beats (Fig. 5G). Thus, the stretch-induced premature beat was not likely to be dependent on the Ca2+-troponin C interaction.
Electrophysiological properties of MEC revealed by pressure clamp
Our results were similar to those obtained with volume stimulation in larger hearts with respect to timing and amplitude dependence of PVE occurrence. We were surprised at the small amplitudes (20 mmHg) that were required to evoke PVEs after the refractory period. This is much below the 140 mmHg that was required in rabbit heart (Bode et al., 2006). The rat PVEs were blocked by Gd3+ and streptomycin but not verapamil strongly indicated the involvement of cationic SACs.
The common models for SAC gating have an exponential dependency on membrane tension (Sukharev et al., 1999; Markin & Sachs, 2004), thus the time required for channel activation (Suchyna et al., 2004a) will strongly depend upon the applied force and the effective viscosity of the cells. We found that the contraction state was an important determinant of the latency of the stretch-induced PVE. The latency was shorter during IPP than during zero load contraction or during diastole, probably because elastic elements in parallel with the channels were preloaded. The plasmalemma of cells during zero load contraction wrinkles and was not under significant tension (except possibly in the T-tubules). Thus, the shortened myocytes are likely to respond more slowly to a pressure pulse (Fig. 3A) than in the inflated ventricle, where parallel elements are prestressed. The IPP protocol passively stretches the wall so that pulses delivered at high volume will have shorter latency (Figs. 4D and E; Fig. 5C). In diastole, the myocyte length will vary with the preload. When the preload is set to zero, the cells are shorter than in the physiological setting, and this will produce longer latency – the shorter myocyte in relaxation has to be pulled to a length necessary to activate the channels (Figs. 3B, D and E).
The similarity of the mechanically induced PVEs between the rat and the larger animals such as the rabbit and dog suggest that data learned from the small hearts can be reasonably applied to studies of the more expensive large animals, and eventually to clinical therapy in humans.
Acknowledgements
This work was supported by grants from National Natural Science Foundation of China (30570663, 30770790, 30800377), Beijing Natural Science Foundation (7052012) and NIH (FS).
References
- Besch SR, Suchyna T, Sachs F. High-speed pressure clamp. Pflugers Arch. 2002;445:161–166. doi: 10.1007/s00424-002-0903-0. [DOI] [PubMed] [Google Scholar]
- Bode F, Franz MR, Wilke I, Bonnemeier H, Schunkert H, Wiegand UK. Ventricular fibrillation induced by stretch pulse: implications for sudden death due to commotio cordis. J Cardiovasc Electrophysiol. 2006;17:1011–1017. doi: 10.1111/j.1540-8167.2006.00547.x. [DOI] [PubMed] [Google Scholar]
- Chen RL, Penny DJ, Greve G, Lab MJ. Stretch-induced regional mechanoelectric dispersion and arrhythmia in the right ventricle of anesthetized lambs. Am J Physiol Heart Circ Physiol. 2004;286:H1008–1014. doi: 10.1152/ajpheart.00724.2003. [DOI] [PubMed] [Google Scholar]
- Dick DJ, Lab MJ. Mechanical modulation of stretch-induced premature ventricular beats: induction of mechanoelectric adaptation period. Cardiovasc Res. 1998;38:181–191. doi: 10.1016/s0008-6363(97)00314-3. [DOI] [PubMed] [Google Scholar]
- Franz MR, Cima R, Wang D, Profitt D, Kurz R. Electrophysiological effects of myocardial stretch and mechanical determinants of stretch-activated arrhythmias. Circulation. 1992;86:968–978. doi: 10.1161/01.cir.86.3.968. [DOI] [PubMed] [Google Scholar]
- Hansen DE, Craig CS, Hondeghem LM. Stretch-induced arrhythmias in the isolated canine ventricle. Evidence for the importance of mechanoelectrical feedback. Circulation. 1990;81:1094–1105. doi: 10.1161/01.cir.81.3.1094. [DOI] [PubMed] [Google Scholar]
- Honore E, Patel AJ, Chemin J, Suchyna T, Sachs F. Desensitization of mechano-gated K2P channels. Proc Natl Acad Sci U S A. 2006;103:6859–6864. doi: 10.1073/pnas.0600463103. [DOI] [PMC free article] [PubMed] [Google Scholar]
- Hu H, Sachs F. Stretch-activated ion channels in the heart. J Mol Cell Cardiol. 1997;29:1511–1523. doi: 10.1006/jmcc.1997.0392. [DOI] [PubMed] [Google Scholar]
- Kamkin AG, Kiseleva IS, Iarygin VN. Ion mechanisms of the mechanoelectrical feedback in myocardial cells. Usp Fiziol Nauk. 2001;32:58–87. [PubMed] [Google Scholar]
- Kaufmann RL, Hennekes R, Lab MJ. Demonstration of an “excitation-contraction recoupling” mechanism in mammalian ventricular myocardium. Nat New Biol. 1971;230:150–151. doi: 10.1038/newbio230150a0. [DOI] [PubMed] [Google Scholar]
- Kelly D, Mackenzie L, Hunter P, Smaill B, Saint DA. Gene expression of stretch-activated channels and mechanoelectric feedback in the heart. Clin Exp Pharmacol Physiol. 2006;33:642–648. doi: 10.1111/j.1440-1681.2006.04392.x. [DOI] [PubMed] [Google Scholar]
- Kohl P, Sachs F, Franz M. Cardiac Mechano-Electric Feedback and Arrhythmias: from pipette to patient. Elsevier; Philadelphia: 2005. [Google Scholar]
- Kong CR, Bursac N, Tung L. Mechanoelectrical excitation by fluid jets in monolayers of cultured cardiac myocytes. J Appl Physiol. 2005;98:2328–2336. doi: 10.1152/japplphysiol.01084.2004. discussion 2320. [DOI] [PubMed] [Google Scholar]
- Lab MJ. Contribution of mechano-electric coupling to ventricular arrhythmias during reduced perfusion. Int J Microcirc Clin Exp. 1989;8:433–442. [PubMed] [Google Scholar]
- Lab MJ, Allen DG, Orchard CH. The effects of shortening on myoplasmic calcium concentration and on the action potential in mammalian ventricular muscle. Circ Res. 1984;55:825–829. doi: 10.1161/01.res.55.6.825. [DOI] [PubMed] [Google Scholar]
- Lacampagne A, Gannier F, Argibay J, Garnier D, Le Guennec JY. The stretch-activated ion channel blocker gadolinium also blocks L-type calcium channels in isolated ventricular myocytes of the guinea-pig. Biochim Biophys Acta. 1994;1191:205–208. doi: 10.1016/0005-2736(94)90250-x. [DOI] [PubMed] [Google Scholar]
- Lin W, Laitko U, Juranka PF, Morris CE. Dual stretch responses of mHCN2 pacemaker channels: accelerated activation, accelerated deactivation. Biophys J. 2007;92:1559–1572. doi: 10.1529/biophysj.106.092478. [DOI] [PMC free article] [PubMed] [Google Scholar]
- Link MS. Mechanically induced sudden death in chest wall impact (commotio cordis). Prog Biophys Mol Biol. 2003;82:175–186. doi: 10.1016/s0079-6107(03)00014-2. [DOI] [PubMed] [Google Scholar]
- Link MS, Wang PJ, VanderBrink BA, Avelar E, Pandian NG, Maron BJ, Estes NA., 3rd Selective activation of the K(+)(ATP) channel is a mechanism by which sudden death is produced by low-energy chest-wall impact (Commotio cordis). Circulation. 1999;100:413–418. doi: 10.1161/01.cir.100.4.413. [DOI] [PubMed] [Google Scholar]
- Liu X, Huang H, Wang W, Wang J, Sachs F, Niu W. Stretch-activated potassium channels in hypotonically induced blebs of atrial myocytes. J Membr Biol. 2008;226:17–25. doi: 10.1007/s00232-008-9135-3. [DOI] [PubMed] [Google Scholar]
- Madias C, Maron BJ, Supron S, Estes NA, 3rd, Link MS. Cell membrane stretch and chest blow-induced ventricular fibrillation: commotio cordis. J Cardiovasc Electrophysiol. 2008;19:1304–1309. doi: 10.1111/j.1540-8167.2008.01267.x. [DOI] [PubMed] [Google Scholar]
- Markin VS, Sachs F. Thermodynamics of mechanosensitivity. Phys Biol. 2004;1:110–124. doi: 10.1088/1478-3967/1/2/007. [DOI] [PubMed] [Google Scholar]
- McBride DW, Jr., Hamill OP. Pressure-clamp: a method for rapid step perturbation of mechanosensitive channels. Pflugers Arch. 1992;421:606–612. doi: 10.1007/BF00375058. [DOI] [PubMed] [Google Scholar]
- Morris CE, Juranka PF. Nav channel mechanosensitivity: activation and inactivation accelerate reversibly with stretch. Biophys J. 2007;93:822–833. doi: 10.1529/biophysj.106.101246. [DOI] [PMC free article] [PubMed] [Google Scholar]
- Morris CE, Juranka PF, Lin W, Morris TJ, Laitko U. Studying the mechanosensitivity of voltage-gated channels using oocyte patches. Methods Mol Biol. 2006;322:315–329. doi: 10.1007/978-1-59745-000-3_22. [DOI] [PubMed] [Google Scholar]
- Nicolosi AC, Kwok CS, Bosnjak ZJ. Antagonists of stretch-activated ion channels restore contractile function in hamster dilated cardiomyopathy. J Heart Lung Transplant. 2004;23:1003–1007. doi: 10.1016/j.healun.2004.05.006. [DOI] [PubMed] [Google Scholar]
- Nishimura S, Kawai Y, Nakajima T, Hosoya Y, Fujita H, Katoh M, Yamashita H, Nagai R, Sugiura S. Membrane potential of rat ventricular myocytes responds to axial stretch in phase, amplitude and speed-dependent manners. Cardiovasc Res. 2006;72:403–411. doi: 10.1016/j.cardiores.2006.08.011. [DOI] [PubMed] [Google Scholar]
- Niu W, Sachs F. Dynamic properties of stretch-activated K+ channels in adult rat atrial myocytes. Prog Biophys Mol Biol. 2003;82:121–135. doi: 10.1016/s0079-6107(03)00010-5. [DOI] [PubMed] [Google Scholar]
- Salmon AH, Mays JL, Dalton GR, Jones JV, Levi AJ. Effect of streptomycin on wall-stress-induced arrhythmias in the working rat heart. Cardiovasc Res. 1997;34:493–503. doi: 10.1016/s0008-6363(97)00024-2. [DOI] [PubMed] [Google Scholar]
- Suchyna TM, Besch SR, Sachs F. Dynamic regulation of mechanosensitive channels: capacitance used to monitor patch tension in real time. Phys Biol. 2004a;1:1–18. doi: 10.1088/1478-3967/1/1/001. [DOI] [PubMed] [Google Scholar]
- Suchyna TM, Sachs F. Mechanosensitive channel properties and membrane mechanics in mouse dystrophic myotubes. J Physiol. 2007;581:369–387. doi: 10.1113/jphysiol.2006.125021. [DOI] [PMC free article] [PubMed] [Google Scholar]
- Suchyna TM, Tape SE, Koeppe RE, 2nd, Andersen OS, Sachs F, Gottlieb PA. Bilayer-dependent inhibition of mechanosensitive channels by neuroactive peptide enantiomers. Nature. 2004b;430:235–240. doi: 10.1038/nature02743. [DOI] [PubMed] [Google Scholar]
- Sukharev SI, Sigurdson WJ, Kung C, Sachs F. Energetic and spatial parameters for gating of the bacterial large conductance mechanosensitive channel, MscL. J Gen Physiol. 1999;113:525–540. doi: 10.1085/jgp.113.4.525. [DOI] [PMC free article] [PubMed] [Google Scholar]
- Taggart P, Lab M. Cardiac mechano-electric feedback and electrical restitution in humans. Prog Biophys Mol Biol. 2008;97:452–460. doi: 10.1016/j.pbiomolbio.2008.02.021. [DOI] [PubMed] [Google Scholar]
- Taggart P, Sutton P, Lab M, Runnalls M, O'Brien W, Treasure T. Effect of abrupt changes in ventricular loading on repolarization induced by transient aortic occlusion in humans. Am J Physiol. 1992;263:H816–823. doi: 10.1152/ajpheart.1992.263.3.H816. [DOI] [PubMed] [Google Scholar]
- Ter Keurs HE, Shinozaki T, Zhang YM, Zhang ML, Wakayama Y, Sugai Y, Kagaya Y, Miura M, Boyden PA, Stuyvers BD, Landesberg A. Sarcomere mechanics in uniform and non-uniform cardiac muscle: a link between pump function and arrhythmias. Prog Biophys Mol Biol. 2008;97:312–331. doi: 10.1016/j.pbiomolbio.2008.02.013. [DOI] [PubMed] [Google Scholar]
- Van Wagoner DR. Mechanosensitive gating of atrial ATP-sensitive potassium channels. Circ Res. 1993;72:973–983. doi: 10.1161/01.res.72.5.973. [DOI] [PubMed] [Google Scholar]
- Wakayama Y, Miura M, Stuyvers BD, Boyden PA, ter Keurs HE. Spatial nonuniformity of excitation-contraction coupling causes arrhythmogenic Ca2+ waves in rat cardiac muscle. Circ Res. 2005;96:1266–1273. doi: 10.1161/01.RES.0000172544.56818.54. [DOI] [PubMed] [Google Scholar]
- Wei H, Huang H, Wang W, Zhang Z, Fu X, Liu P, Niu W. A ventricular pressure-clamping system for the study of mechano-electrical feedback. Sheng Li Xue Bao. 2006;58:606–610. [PubMed] [Google Scholar]
- Wilhelm J, Kondratev D, Christ A, Gallitelli MF. Stretch induced accumulation of total Ca and Na in cytosol and nucleus: a comparison between cardiac trabeculae and isolated myocytes. Can J Physiol Pharmacol. 2006;84:487–498. doi: 10.1139/y05-134. [DOI] [PubMed] [Google Scholar]
- Zabel M, Koller BS, Sachs F, Franz MR. Stretch-induced voltage changes in the isolated beating heart: importance of the timing of stretch and implications for stretch-activated ion channels. Cardiovasc Res. 1996;32:120–130. [PubMed] [Google Scholar]
- Zeng T, Bett GC, Sachs F. Stretch-activated whole cell currents in adult rat cardiac myocytes. Am J Physiol Heart Circ Physiol. 2000;278:H548–557. doi: 10.1152/ajpheart.2000.278.2.H548. [DOI] [PubMed] [Google Scholar]


