Abstract
One of the biggest challenges in the effort to treat and contain influenza A virus infections is the emergence of resistance during treatment. It is well documented that resistance to amantadine arises rapidly during the course of treatment due to mutations in the gene coding for the M2 protein. To address this problem, it is critical to develop experimental systems that can accurately model the selection of resistance under drug pressure as seen in humans. We used the hollow-fiber infection model (HFIM) system to examine the effect of amantadine on the replication of influenza virus, A/Albany/1/98 (H3N2), grown in MDCK cells. At 24 and 48 h postinfection, virus replication was inhibited in a dose-dependent fashion. At 72 and 96 h postinfection, virus replication was no longer inhibited, suggesting the emergence of amantadine-resistant virus. Sequencing of the M2 gene revealed that mutations appeared at between 48 and 72 h of drug treatment and that the mutations were identical to those identified in the clinic for amantadine-resistant viruses (e.g., V27A, A30T, and S31N). Interestingly, we found that the type of mutation was strongly affected by the dose of the drug. The data suggest that the HFIM is a good model for influenza virus infection and resistance generation in humans. The HFIM has the advantage of being a highly controlled system where multiplicity parameters can be directly and accurately controlled and measured.
Each year thousands of people die from human H1N1 and H3N2 influenza A virus epidemics (38). In 2009, a swine-origin influenza A (H1N1) virus caused a pandemic (8). Fortunately, this virus causes a mild disease that either resolves on its own or, if caught in time, is amenable to treatment with the currently available neuraminidase inhibitors, oseltamivir carboxylate and zanamivir (8). In the past, human H1N1, H2N2, and H3N2 influenza A viruses have caused pandemics leading to many more deaths (25). Neuraminidase inhibitors, such as oseltamivir carboxylate and zanamivir, and M2 ion channel blockers, such as the adamantane derivatives, amantadine, and rimantadine, have been effective for the prevention and treatment of human influenza A virus infections (19, 22, 30-32, 39). However, with more frequent use of these inhibitors, influenza viruses resistant to the adamantanes or oseltamivir carboxylate have emerged in the human population (4, 5, 9, 16, 20, 26, 32). Amantadine resistance is so widespread that adamantane is no longer recommended for the treatment of human influenza A virus infections (20), and resistance to oseltamivir carboxylate in the currently circulating H1N1 human influenza viruses is essentially 100% (32).
We wished to employ our hollow-fiber infection model (HFIM) to determine whether when influenza virus was exposed to amantadine in this in vitro circumstance (i) mutations could be generated in the M2 gene and (ii) these mutations would mimic those seen clinically. In this way, we would provide some validation that the system can be employed to identify clinically relevant mutations early for the development of new drugs and to explore the spacing of doses and administration schedule to determine if emergence of resistance can be suppressed.
Sequencing the M2 genes of progeny viruses obtained from individual viral plaques of viruses grown in the HFIM system in the presence of amantadine showed that most of the viruses contained mutations identical to those found in clinical isolates obtained from patients treated with amantadine (5).
(Portions of this paper were presented previously [29a].)
MATERIALS AND METHODS
Cell and virus.
MDCK cells (ATCC CCL-34) were obtained from the American Type Culture Collection and maintained in minimal essential medium (MEM) supplemented with 10% fetal bovine serum (FBS), 1% sodium pyruvate, 1% MEM nonessential amino acids, 1% penicillin-streptomycin, and 1% glutamine. The cells were grown as monolayers in 75-cm2 or 25-cm2 cell culture flasks (Corning Inc., Corning, NY) or in six-well tissue culture plates (Corning Inc., Corning, NY) at 37°C with 5% CO2.
Influenza virus, A/Albany/1/98 (H3N2), was isolated from a patient with “flu-like” symptoms at the Albany Medical Center Hospital in 1998. The virus strain was obtained from the Clinical Microbiology Laboratory at that hospital, and its use in these studies was approved by the Albany Medical Center Institutional Review Board. MDCK cells infected with this clinical isolate react with a monoclonal antibody specific for the influenza A virus nucleocapsid antigen and with a monoclonal antibody directed against the influenza virus H3 antigen, confirming that this clinical isolate is an H3N2 subtype of type A influenza virus. Both fluorochrome-labeled monoclonal antibodies were obtained from Chemicon International Inc., Temecula, CA.
Virus stocks.
Stocks of the A/Albany/1/98 virus were prepared by infecting 1-day-old, confluent MDCK cell monolayers in 75-cm2 flasks with virus diluted in virus growth medium (VGM) consisting of MEM (500 ml) supplemented with a final concentration of 0.2% bovine serum albumin (BSA) (Sigma Chemical Company, St. Louis, MO), 2 μg/ml of l-1-tosylamide-2-phenylethylchloromethyl ketone (TPCK)-treated trypsin (Sigma Chemical Company, St. Louis, MO), and 100 units/ml of penicillin-streptomycin solution (HyClone, Logan, UT) to yield a multiplicity of infection (MOI) of 0.0001 PFU/cell. After an adsorption period of 2 h at 36°C in an atmosphere of 5% CO2, the inoculum was removed, VGM was added to each flask, and the flasks were incubated for 24 to 48 h. At 24 or 48 h postinfection, the medium containing released virus was collected and clarified by centrifugation at 600 × g for 5 min, and the clarified supernatant was decanted into a fresh, sterile tube. The clarified medium was mixed, dispensed in small volumes, and stored at −80°C.
Plaque assay.
To determine the amount of infectious virus in our stocks or experimental samples, we performed a plaque assay on MDCK cells as previously described (21, 28, 29). In brief, MDCK cells were prepared in six-well plates and allowed to grow to confluence at 36°C with 5% CO2 overnight. Serial 10-fold dilutions of virus in VGM were prepared and kept on ice. The medium was removed from the six-well plates, the monolayers were washed twice with VGM, and 100 μl of each virus dilution was added to MDCK cell monolayers in duplicate. The inoculated plates were incubated at 36°C with 5% CO2 for a 2-h adsorption period. The inocula were removed, and 4 ml of a 1% (final concentration) agar overlay containing 1× MEM, 0.2% BSA, 2 μg/ml of TPCK-treated trypsin, and 0.01% DEAE-dextran was added to each well. After the agar solidified, the plates were inverted and incubated at 36°C with 5% CO2 for 48 to 72 h. Visible plaques were counted with the naked eye.
Antiviral drug.
Amantadine HCl, in powdered form, was purchased from Sigma Chemical Company, St. Louis, MO. Stocks of drug were prepared by suspending the powder in water to yield a final concentration of 10 mg/ml. The drug was then filter sterilized through a 0.2-μm filter, dispensed in small volumes, and stored at −80°C.
Real-time qPCR analysis.
The TaqMan quantitative PCR (qPCR) assay was used to quantify viral loads from experimental samples. The assay targets a region of the M1 gene that is conserved across influenza A virus strains using the primers AAGACCAATYCTGTCACCTCTGA and CAAAGCGTCTACGCTGCAGTCC and the MGB 6-carboxyfluorescein (FAM)-labeled probe, CGTGCCCAGTGAGC. Primers and probes were designed using Primer Express software (Applied Biosystems [AB], Foster City, CA). The assay was validated using plasmid standards and blinded influenza A (H3N2) virus samples containing various quantities of PFU of influenza virus. Standards were constructed by ligation of a PCR-amplified product of segment 7 (M gene) into a plasmid vector. The plasmid DNA was amplified in Escherichia coli strain TOP10 and purified using a Qiagen plasmid purification kit. The plasmid insert was confirmed in both directions using six separate primers. The concentration and purity of the plasmid DNA were calculated by measuring the optical density at 260 nm (OD260) and the OD280. These data were used to calculate the target copy number in the standard. Additionally, the standards were run in a 16S real-time TaqMan assay to check for contaminating DNA and were found to have insignificant levels. Standard curves were created using 10-fold dilutions from 109 to 101 target copies/reaction (9 log units) and had a typical r2 of 0.99.
Viral RNA was extracted from samples using a QIAmp viral mini kit according to manufacturer's instructions, and then reverse transcription was performed on the samples using the primer TCTAACCGAGGTCGAAACGTA at 42°C for 60 min followed by 95°C for 5 min. Real-time PCRs were conducted in 10-μl reaction mixtures that contained 900 nM forward and reverse primers, 225 nM probe, 1× ABI TaqMan universal PCR master mix with AmpErase UNG, and 2 μl of cDNA template. Thermal cycling was performed on an Applied Biosystems 7900 HT sequence detection system under the following conditions: 50°C for 3 min, 95°C for 10 min, and 50 cycles of 95°C for 15 s and 60°C for 1 min. Each sample and standard was run in triplicate in each 384-well plate. Samples with significant value variation (greater than one threshold cycle [CT]) between replicates were reassayed. Additionally, plates with standard curves that had an r2 of less than 0.95 were reassayed to ensure accurate quantification.
Plaque isolation.
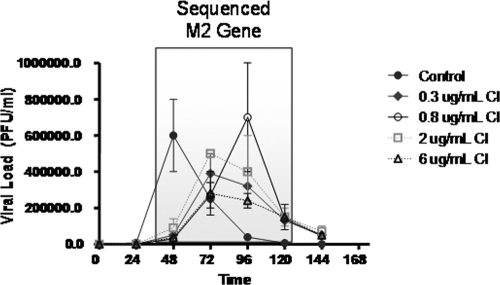
To identify mutations in the M2 gene, virus samples obtained from each HF unit at 48, 72, 96, and 120 h postinfection (see Fig. 3, boxed area) were diluted to yield approximately 20 PFU per ml, and 0.5 ml of each sample was added to MDCK cell monolayers in six-well plates. After 48 h of incubation at 36°C with 5% CO2, the monolayers were stained with neutral red agar and incubated for 8 h. Ten visible plaques were then picked from each plate with a sterile micropipette tip, the sample was suspended in AVL buffer (viral lysis buffer; Qiagen) containing carrier RNA, and the M2 gene was sequenced.
FIG. 3.
Dose range experiment for A/Albany/1/98 influenza virus and amantadine in the HFIM system. Virus-infected cells (102) and uninfected MDCK cells (108) were loaded into hollow-fiber units and continuously infused with various concentrations of amantadine for 6 days. Each hollow-fiber unit was sampled daily, and the amount of virus produced was measured by plaque assay. The boxed region indicates the portions of the time course from which viruses samples were plated on MDCK cells to form plaques. Ten of these plaques were picked and the M2 gene sequenced to determine the presence of coding regions that lead to amantadine resistance. Determinations were in duplicate. The mean values are shown, and the error bars represent standard deviations.
Sequencing of influenza virus M2 RNA.
To identify the development of mutations related to selective pressure from the use of antiviral drugs, the M2 gene in 10 plaque picks from each viral population, including experiment input virus, was sequenced. Oligonucleotide primers for the M2 gene were developed, using standard techniques, to ensure capture of the entire region of interest across the M2 gene. This region contains all previously identified mutations that have been related to antiviral resistance, i.e., M2 residues 26 to 34 (19). Initial PCR was performed using a DNAEngine Peltier thermal cycler (Bio-Rad, Hercules, CA). Then amplicons of the expected size were identified by size comparison to a 100-bp ladder on an agarose gel. The PCR products were sequenced in both directions using the same primers that were used for the PCR assay. Sequencing reactions were carried out using the Applied Biosystems (AB) Big Dye 3.1 kit. DyeEx columns (Qiagen, Valencia, CA) were used in a postsequencing reaction cleanup. Samples were dried completely and resuspended in HiDi formamide before being loaded on the AB 3130xl Genetic Analyzer. Sequences were analyzed using Lasergene sequence analysis software (DNAStar, Madison, WI). The SeqMan program (DNAStar) was used to determine the mutation status of each of the loci of interest in the M2 gene.
EC50 determination.
The procedure for determination of the 50% effective concentration (EC50) has been previously described (21, 28, 29). In brief, to determine the amantadine EC50 for this influenza A virus clinical isolate, MDCK cell monolayers were prepared in 25-cm2 plastic tissue culture flasks. The following day, the monolayers were pretreated with various amounts of amantadine diluted in VGM for 1 h at 36°C with 5% CO2. The drug-containing medium was removed, and 100 PFU of virus in 100 μl of VGM was inoculated into each well of the six-well plate to yield an MOI of 0.0001 PFU/cell (102 PFU/106 cells). After a 2-h incubation period at 36°C with 5% CO2, the inoculum was removed and 5 ml of VGM supplemented with various concentrations of amantadine was added to the appropriate flasks. The infected monolayers were incubated at 36°C under an atmosphere of 5% CO2 for 24 to 48 h. The monolayers were observed daily for cytopathic effect. At 24 and 48 h postinfection, the medium containing released virus was sampled, and the effects of different concentrations of amantadine on the yield of influenza A virus were determined by plaque assay.
HFIM system.
To determine the dose range for antiviral compounds effective against the A/Albany/1/98 strain of influenza virus, we used the hollow-fiber infection model (HFIM) system developed by Drusano and colleagues (1, 2, 3, 11-13, 28, 29, 33). In brief, 102 virus-infected MDCK cells were mixed with 108 uninfected MDCK cells and placed in the extracapillary space (ECS) of the hollow-fiber units. Each unit was continuously infused with various concentrations of amantadine for 6 or 7 days. The hollow-fiber units were sampled each day. The samples were clarified by low-speed centrifugation, and the supernatant was assayed for infectious virus by plaque assay and for genomic RNA equivalents by real-time quantitative reverse transcription-PCR (qRT-PCR).
Drug assay.
The concentrations of amantadine present in each HF unit throughout the experiment were determined as follows. Samples in VGM (50 μl) were diluted with high-pressure liquid chromatography (HPLC) water (50-μl sample diluted into 1.00 ml water) and analyzed by high-pressure liquid chromatography tandem mass spectrometry (LC/MS/MS). The LC/MS/MS system was comprised of a Shimadzu Prominence HPLC system and an Applied Biosystems/MDS Sciex API5000 LC/MS/MS. Chromatographic separation was performed using a ThermoScientific Betasil C18 HPLC column, a 100- by 3.0-mm column, and a mobile phase consisting of 75% 10 mM ammonium formate (pH 3.5) and 25% acetonitrile at a flow rate of 0.25 ml/min. Amantadine concentrations were obtained using LC/MS/MS, monitoring the MS/MS transition m/z 152 to m/z 135. The analysis run time was 4.0 min. The assay was linear over a range of 0.01 to 5.0 μg/ml (r2 > 0.994). The interday coefficients of variation (CVs) for the quality control samples analyzed in replicates of three at three concentrations on each analysis day (0.050, 0.250, and 3.50 μg/ml) ranged from 3.05 to 10.4%, with accuracies (percent recovery) ranging between 90.2% and 114%.
Statistical analysis.
The statistical analysis was performed as previously described (24). An inhibitory sigmoid-Emax model of the form effect = control effect − (maximal effect × exposureH/(exposureH + EC50H) was fit to the data. Control effect is the measured viral output in the absence of drug, maximal effect is the greatest reduction in viral output produced by drug exposure, EC50 is the drug exposure producing half-maximal effect, and H is Hill's constant. The model was fit to the data by nonlinear regression analysis, as performed within the ADAPT II package of programs of D'Argenio and Schumitzky (7).
RESULTS
EC50s of amantadine for the A/Albany/1/98 strain of influenza virus grown in MDCK cells.
To demonstrate that the clinical isolate we chose for these studies was susceptible to amantadine, we determined the effect of amantadine on the replication of the A/Albany/1/98 strain of influenza virus in MDCK cell monolayers in six-well plates. The average from three independent analyses of the EC50 for amantadine for the A/Albany/1/98 strain of influenza virus grown in MDCK cells is 0.051 ± 0.01 μg/ml (0.337 ± 0.06 μM), with a range of 0.04 to 0.06 μg/ml (0.26 to 0.40 μM). This value is within the range of EC50s associated with wild-type influenza A viruses isolated before 2000 (21).
Growth of the A/Albany/1/98 strain of influenza virus in MDCK cells in hollow-fiber units.
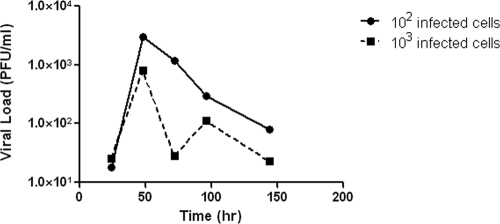
To determine the best conditions for the growth of the A/Albany/1/98 strain of influenza virus in MDCK cells in the hollow-fiber units, 102 or 103 A/Albany/1/98 influenza virus-infected MDCK cells were mixed separately with 108 uninfected MDCK cells and placed in two hollow-fiber units. Each unit was continuously infused with VGM for 6 days. At various times postinfection, the ECS was sampled and the amount of cell-free infectious virus released into the medium was determined by plaque assay. The results are illustrated in Fig. 1. The hollow-fiber unit initiated with 102 virus-infected cells produced approximately 8 × 10⁵ PFU/ml at 48 h postinfection, followed by a rapid decline in the number of infectious viruses by 72 h postinfection. This decline in virus infectivity is most likely due to the lack of fresh target cells to keep the infection going and to the temperature sensitivity of the cell-free virus produced in the HFIM system (see below). The hollow-fiber unit initiated with 103 virus-infected cells produced about half as much infectious virus at 48 h postinfection. In either case, the peak of virus production occurred at 48 h postinfection, a time frame that mimics the clinical disease (10). The data clearly demonstrate that, under these conditions of low MOI, the A/Albany/1/98 strain of influenza virus can grow in MDCK cells in the hollow-fiber system. All experiments reported in this paper were performed by initiating the HFIM systems with 102 virus-infected MDCK cells and 108 uninfected MDCK cells.
FIG. 1.
Growth of influenza virus in the HFIM system. For growth of the A/Albany/1/98 strain of influenza virus in MDCK cells in the HFIM system, 102 or 103 virus-infected MDCK cells were mixed with 108 uninfected MDCK cells and the cell mixtures were inoculated into hollow-fiber units. Virus growth medium (VGM) was continuously circulated through each hollow-fiber unit at 36°C with 5% CO2. At various times postinfection, virus-infected cells and cell-free virus were removed from the ECS through ports on the tops of the hollow-fiber cartridges. The cells were removed by low-speed centrifugation, and the amount of infectious virus in the clarified supernatant was determined by plaque assay.
Temperature sensitivity of A/Albany influenza virus.
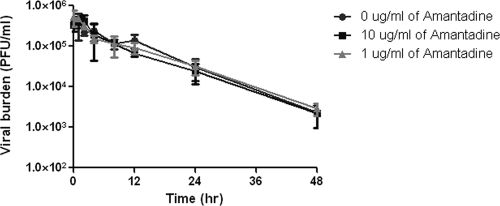
To prove that the decline in the titer of infectious virus at later times during the HF experiment is due, at least in part, to the temperature sensitivity of the virus, 106 PFU of virus was added to 30 ml of VGM without amantadine or with 1 μg/ml or 10 μg/ml of amantadine without any MDCK cells. At various times, each flask was sampled and infectious virus was quantified by plaque assay. The data in Fig. 2 show that the infectivity of the virus was stable in the presence and absence of amantadine for about 4 h at 36°C with 5% CO2 and declined rapidly thereafter. After 48 h of incubation, virus infectivity had declined by greater than 99% under all conditions, suggesting that the presence of amantadine did not influence the heat sensitivity of the virus (as would be expected in the absence of cells). These data confirm that the decline in virus infectivity demonstrated in the HF system is due, at least in part, to the temperature sensitivity of the virus.
FIG. 2.
Effect of temperature on the titer of influenza A virus. Flasks containing approximately 106 PFU of A/Albany/1/98 in 30 ml of VGM with no amantadine, 1 μg/ml amantadine, or 10 μg/ml amantadine were incubated at 36°C with 5% CO2. At various times, the media were sampled and the number of infectious viruses present was determined by plaque assay. Determinations were in triplicate. The mean values are shown, and the error bars represent standard deviations.
Dose range study of amantadine with the A/Albany/1/98 strain of influenza virus.
The EC50 of amantadine for A/Albany/1/98 grown in flasks seeded with MDCK cells is 0.051 ± 0.01 μg/ml (0.337 ± 0.06 μM). The EC50 of amantadine for A/Albany/1/98 was determined in the HFIM system to be 0.06 μg/ml (0.40 μM), as previously described (1). Figure 3 shows the effects of different concentrations of amantadine on the production of A/Albany/1/98 influenza virus. In the absence of drug, viral growth was uninhibited, with a peak titer of 6 × 10⁵ PFU/ml at 48 h postinfection. At later times, the amount of infectious virus declined as demonstrated above (Fig. 1). At 48 h postinfection, virus yield was suppressed in a dose-dependent manner. However, at 72 h and 96 h postinfection, continuous infusion at all concentrations of amantadine delayed the peak of virus production and failed to suppress virus replication in the HFIM system. The decline in the titer of infectious virus between 96 and 144 h postinfection is most likely due to the loss of uninfected target cells and the temperature sensitivity of the virus.
Drug analysis for the dose range study.
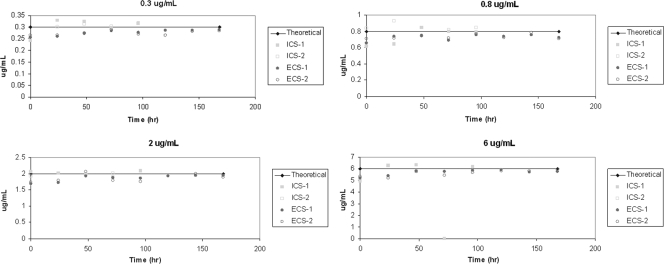
To confirm that the correct doses were continuously delivered to each hollow-fiber cartridge, each unit was sampled at various times throughout the dose range study and the amount of amantadine present was determined by LC/MS/MS. The data in Fig. 4 show that the intended drug concentrations in the four continuous arms were maintained in the intracapillary space (ICS) and the ECS throughout the experiment.
FIG. 4.
Analysis of drug concentrations in the dose range experiment. The medium in the ICS and the ECS of each hollow-fiber unit was sampled at the indicated times and the amount of amantadine was determined by LC/MS/MS.
Genetic analysis of the M2 genes of influenza viruses created under amantadine pressure.
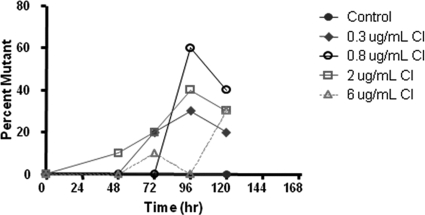
The boxed area in Fig. 3 illustrates the portions of the dose-response curve from where the samples to be analyzed for M2 mutations were derived. The data in Table 1 show that sequencing the M2 gene at selected time points confirmed that resistant mutants were being generated as a function of drug pressure. While no mutations in the M2 gene were identified in the no-drug control arm, mutations in the M2 gene were identified in most of the amantadine treatment arms within 48 to 72 h of drug treatment. Most of the mutations were identical to those that have been previously shown to result in amantadine resistance (e.g., V27A, A30T, and S31N) (5). Interestingly, the resistance mutation location in the M2 gene was strongly affected by the exposure to the drug: at the 0.3-μg/ml dose, 100% of the mutants were S31N; at 0.8 μg/ml, there was a mixture of V27A and A30T; at 2 μg/ml, 100% were I32S; and at 6 μg/ml, 100% were V27A.
TABLE 1.
Effect of amantadine concentration on the percentage and type of M2 mutationa
| Arm | Time point (h) | Percent wild type | Mutant genotype |
|---|---|---|---|
| Control | 48 | 100 | |
| 120 | 100 | ||
| Continuous infusion | |||
| 0.3 μg/ml | 48 | 100 | |
| 72 | 80 | S31N | |
| 96 | 70 | S31N | |
| 120 | 80 | S31N | |
| 0.8 μg/ml | 48 | 100 | |
| 72 | 100 | ||
| 96 | 40 | 20% V27A, 40% A30T | |
| 120 | 60 | 20% V27A, 20% A30T | |
| 2 μg/ml | 48 | 90 | I32S |
| 72 | 80 | I32S | |
| 96 | 60 | I32S | |
| 120 | 70 | I32S | |
| 6 μg/ml | 48 | 100 | |
| 72 | 90 | V27A | |
| 96 | 100 | ||
| 120 | 70 | V27A |
Ten individual plaques were picked from virus samples grown in the presence of each concentration of amantadine administered as a continuous infusion at each time point illustrated in the boxed in area in Fig. 3. Sequencing of the M2 genes of viruses in these plaques yielded the type of mutation and its frequency at each drug concentration.
As shown in Fig. 3, at 96 h, the order in terms of highest to lowest viral load was 0.8 > 2.0 > 0.3 > 6 μg/ml amantadine. The data in Fig. 5 show that this order was also seen in terms of the percentage of mutants in the population at 96 h, with the 0.8-μg/ml arm having the highest (60%) and the 6-μg/ml arm having the lowest (0%). However, this was not the case at 120 h, where each drug concentration was associated with about the same fraction of mutants.
FIG. 5.
Effect of drug concentration on the percentage of mutant viruses isolated from the HFIM system over time. Individual plaques were picked from viruses grown in the presence of each concentration of amantadine at each time point. Sequencing of the M2 gene of plaque purified viruses yielded the mutation frequency at each drug concentration.
Repeat of the dose range study of amantadine with an oral profile of amantadine in the HFIM system.
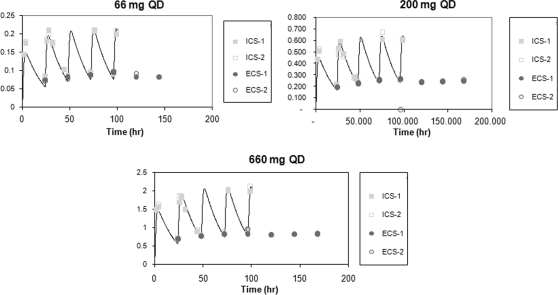
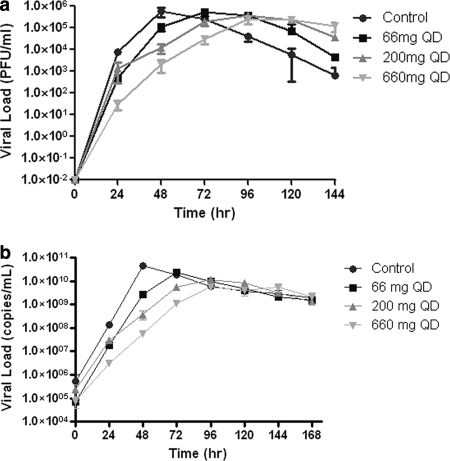
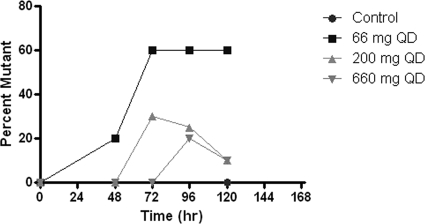
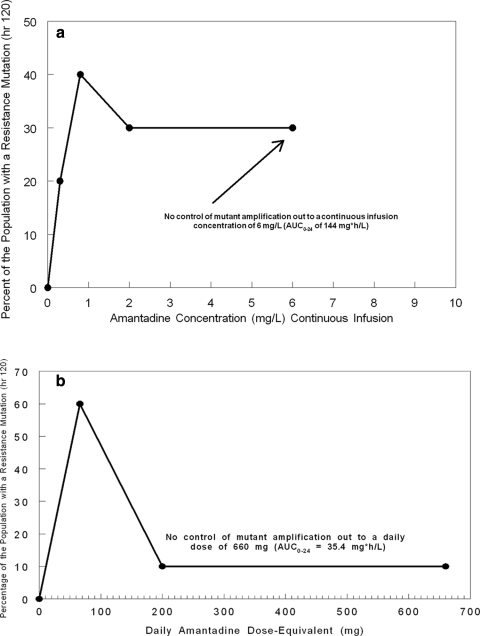
The data from the dose range study demonstrated that amantadine-resistant influenza virus could be generated in the HFIM system and that the resistant virus contained mutations in the M2 gene that were identical to those that arose in the clinic when patients were treated with amantadine or rimantadine (Fig. 3 and Table 1). However, continuous infusion of 0 to 6 μg/ml failed to suppress virus replication and the generation of amantadine-resistant mutants. Therefore, we repeated this experiment at simulated oral doses of 66 mg, 200 mg (the clinical dose), and 660 mg for 6 days. In this case, the drug was given as an infusion over 1 h followed by a no-drug washout period, resulting in a peak concentration/trough concentration profile mimicking that for oral clinical exposure. The effect of the drug on virus replication was determined by plaque assay of infectious virus and qRT-PCR. The data in Fig. 6 show that theoretical concentration-time profiles were achieved in both the central (ICS) and peripheral (ECS) compartments over time. Figure 7 a (PFU/ml) and b (copies/ml) show that amantadine inhibited virus replication in a dose-dependent manner at 24 and 48 h but lost the inhibitory effect at later times, when virus grew as well as or better than the control in the presence of these oral-profile exposures to amantadine. Even at these exposures to amantadine, virus replication was not inhibited at later time points. However, there was an effect on the mutant virus subpopulation, with a delay of the onset of amplification of this subpopulation as well as an effect on the fraction of the total population represented by mutants. The delay in onset and the impact on mutant amplification were related to exposure, as shown in Fig. 8. At a dose equivalent to 66 mg daily (QD), 20% of the population was mutant at 48 h postinfection and 60% of the population was mutant at later times. At a dose equivalent to 200 mg QD, mutants did not appear until 72 h postinfection, and they remained at 30% or less of the population. At a dose equivalent to 660 mg QD, the appearance of mutant viruses was delayed until 96 h after infection, and they were present in fewer than 20% of the population. These results show that higher concentrations of amantadine can delay the emergence of resistance but cannot prevent it. It is also clear that ratio of the amantadine area under the concentration-time curve (AUC) to the viral EC50 for amantadine per se does not suppress resistance, as the delay and decrease in percentage of the population that express resistance mutations were not seen in the continuous-infusion mode until much larger AUC values were developed (Fig. 3 and 4 and Table 1), indicating that the peak concentration/EC50 ratio is more closely linked to resistance suppression. For example, the continuous-infusion arm at 6 mg/liter develops an AUC of 144 mg·h/liter, which is considerably larger than that developed by the oral profile of 660 mg per day (35.4 mg·h/liter), but the percentage of resistant isolates is actually higher with the continuous-infusion profile (Fig. 9a and b).
FIG. 6.
Analysis of amantadine concentrations at higher doses. The medium entering (ICS) each hollow-fiber unit was sampled, as was the concentration external to the capillary fibers (ECS), and the amount of amantadine present was determined by LC/MS/MS.
FIG. 7.
Dose range experiment at higher concentrations of amantadine. The effect of higher concentrations of amantadine on virus yield as measured by viral load (PFU/ml) (a) and qRT-PCR (copies per ml) (b) is shown. Determinations were in duplicate. The mean values are shown, and the error bars represent standard deviations.
FIG. 8.
Effect of amantadine dose on the percent mutant formation in the HFIM system. Amantadine doses of 66 mg, 200 mg, and 660 mg administered daily were simulated in the hollow-fiber system. The percentage of the viral population recovered as mutants is shown as a function of time and also of the selecting pressure of the drug.
FIG. 9.
Percentage of the total population represented by mutant isolates at 120 h. (a) The independent variable is the steady-state amantadine concentration when administered as a continuous infusion. (b) The independent variable is the dose equivalent of amantadine administered once daily.
DISCUSSION
In 2009, the Centers for Disease Control and Prevention declared a new pandemic for the swine-origin influenza A (H1N1) virus. Early deaths in Mexico focused the attention of health care bodies around the world on the therapy of influenza virus. It was the purpose of this investigation to examine the impact of different exposures to amantadine and schedules of dosing on viral suppression and, more importantly, on the ability to suppress amplification of resistant mutant subpopulations.
Over the last several years, work by a number of laboratories has demonstrated the possibility of identifying doses and schedules of administration of antibacterial agents that would suppress resistant mutant amplification for the desired time course of therapy (6, 14, 17, 18, 24, 35-37). This evaluation starts with a classic dose range study, usually in continuous-infusion mode, to identify an optimal range of exposure producing the maximal suppressive effect. With our amantadine dose range study in continuous-infusion mode (Fig. 3), we demonstrated that there was no recognizable standard exposure response curve generated. We had evaluated continuous infusions that were meant to produce steady-state concentrations ranging from 0.3 to 6 μg/ml. In Fig. 4, we demonstrated that the intended concentrations were achieved. All drug concentrations delayed the achievement of maximal viral titers relative to those in the no-treatment control (Fig. 3). However, the intermediate exposure of 0.8 μg/ml allowed the highest viral titers of any of the drug treatment arms. The relative rank order of the other arms changed with time. We hypothesized that this inability to attain a clear exposure response with respect to viral suppression was a function of clones obtaining a resistance mutation and then amplifying under pressure. We tested this hypothesis by having the M2 gene sequenced. The viral isolates sequenced came from the concentrations and time points indicated in Fig. 3 (boxed area). The results of the sequencing explained the lack of a clear exposure response over time (Fig. 3). The regimens of 0.3-, 0.8-, and 2.0-μg/ml continuous infusion all had a peak in the number of resistant mutants as a fraction of the total population at 96 h, with 30%, 60%, and 40% of the population being mutant isolates, respectively. The highest exposure of 6.0 μg/ml had a peak of the proportion of the total population as mutants at 120 h, which, at this time, was 30% of the population. This regimen had a proportion of mutants at the near-zero level at 96 h. If one looks at the 96-h time point, a clear “inverted U” response is demonstrable, with a low pressure (0.3 μg/ml) causing a low proportion of mutants (30%), which peaks at an intermediate exposure (0.8 μg/ml) at 60% and starts going down at higher exposures (gaining control over mutant amplification at this time point), with proportions of 40% at 2.0 μg/ml and near zero at 6.0 μg/ml. It should also be noted that these continuous infusions represent AUC0-24 values (AUC determined over 24 h) of 7.2, 19.2, 48, and 144 mg·h/liter. Given that the average clearance for amantadine is in the range of 15 to 19 liter/h, this means that the equivalent amantadine doses (using a mean clearance value of 18.5 liter/h) were 133.3 to 2,664 mg and that all of these daily doses failed to prevent resistance selection and amplification over the 5-day period of the experiment for which we have sequence data.
One of the interesting findings that came from the sequencing data is that different mutations were selected by different amounts of drug pressure. Table 1 shows that a 0.3-μg/ml continuous infusion selected only S31N, while a 0.8-μg/ml continuous infusion selected either V27A or A30T, a 2.0-μg/ml continuous infusion selected I32S, and the highest exposure, a 6.0-μg/ml continuous infusion, selected only V27A. The obvious initial hypothesis is that differing and increasing amounts of pressure select mutations with differing phenotypes, which increase the EC50 of amantadine for the virus. We are in the process of trying to test this hypothesis. It should also be noted that the mutations recovered have been described clinically.
We also wished to determine whether the peak concentration, AUC, or time > EC50 was the pharmacodynamic index most closely associated with the ability to suppress mutant selection and amplification. To this end, we simulated doses of amantadine of 66 mg, 200 mg (the clinical daily dose), and 660 mg. While amantadine is often given twice daily, because of the prolonged human half-life of 18 h, we administered these doses as a 1-h infusion (time to peak concentration of 1 h), followed by a washout with medium without amantadine that generated an 18-h half-life. Our ability to attain the concentration-time profile intended is documented in Fig. 6. In Fig. 7a and b, we show the exposure-response curves for these doses administered on a once-daily basis by plaque assay (Fig. 7a) and by qRT-PCR (Fig. 7b). The two end points agree quite well. The viral load estimated by qRT-PCR shows that there is a clear-cut exposure response that is demonstrable out to 72 h but seen most clearly at 48 h. At 96 h and beyond, virtually all regimens are the same, likely due to exhaustion of target cells. The better exposure response seen here, relative to that in the continuous-infusion experiment (Fig. 3), is highly likely due to the lesser amplification of resistant mutants seen with this mode of administration. In Fig. 8, the fraction of the total population represented by resistant mutants by dose and over time is shown. At 24 h, no resistant mutants are seen, while at 48 h, only the lowest exposure (equivalent to 66 mg; AUC0-24 of 3.54 mg*h/liter) leads to resistant mutants documented at 20% of the total population level. At 72 h, the two lowest doses (66 and 200 mg) have mutants measured at 60% and 30% of the population, respectively. Mutants were first measured at the highest dose (660 mg) at hour 96. Like in the previous experiment, there is a clear “inverted U” plot. Our laboratory has shown this repeatedly for bacteria (36-38). In Fig. 9, we plotted the fraction of resistant mutants in the total population at 120 h. The data in Fig. 9a are from the continuous-infusion experiment, whereas the data in Fig. 9b are from the intermittent-therapy experiment with doses of 66, 200, and 660 mg. For Fig. 9a, even with a massive AUC0-24 of 144, we were not able to control the resistant mutants. Given that this is equivalent to 2.66 g of amantadine and that the clinical dose is 200 mg per day, we can conclude that there is no tolerable dose of amantadine given as monotherapy that will shut off selection and amplification of resistant mutants. However, examination of Fig. 9b shows that the peak concentration (actually the peak concentration/EC50 ratio) is highly likely to be the pharmacodynamic index that is most closely linked with suppression of resistance selection and amplification, as an oral profile with peaks and troughs (Fig. 6), and not continuous infusion, tends to provide better control of the selection and amplification of resistant mutants at AUC0-24 values considerably lower than those seen in the continuous-infusion experiment.
The overall conclusion is that it is not possible to increase the dose of amantadine sufficiently to suppress selection and amplification of M2 mutants, at least in this isolate. These findings have been repeated with three other strains of influenza A viruses grown in MDCK cells (A. Brown et al., unpublished data), with very similar outcomes. Consequently, one would like to administer combination chemotherapy to suppress resistance selection and amplification in a circumstance such as this, as has been done by others (15, 23, 27, 34). We are currently testing this hypothesis and are actively seeking other compounds to form appropriate drug combinations for viral inhibition and resistance suppression.
Acknowledgments
This work was supported by grant R01-AI079729-01 from NIAID and by grants from Adamas Pharmaceuticals, Inc., Emeryville, CA, and The Charitable Leadership Foundation, Clifton Park, NY, to the Emerging Infections and Pharmacodynamics Laboratory.
The content is solely the responsibility of the authors and does not necessarily represent the official views of the National Institute of Allergy and Infectious Diseases or the National Institutes of Health.
The authors have no conflicts to disclose.
Footnotes
Published ahead of print on 24 May 2010.
REFERENCES
- 1.Beauchemin, C. A. A., J. J. McSharry, G. L. Drusano, J. T. Nguyen, G. T. Went, R. M. Ribeiro, and A. S. Perelson. 2008. Modeling amantadine treatment of influenza A virus in vitro. J. Theor. Biol. 254:439-451. [DOI] [PMC free article] [PubMed] [Google Scholar]
- 2.Bilello, J. A., G. Bauer, M. N. Dudley, G. A. Cole, and G. L. Drusano. 1994. Effect of 2′,3′-dideoxy-2′3′-didehydrothymidine (D4T) in an in vitro hollow fiber pharmacodynamic model system correlates with the results of dose ranging clinical studies. Antimicrob. Agents Chemother. 38:1386-1391. [DOI] [PMC free article] [PubMed] [Google Scholar]
- 3.Bilello, J. A., P. A. Bilello, J. J. Kort, M. N. Dudley, J. Leonard, and G. L. Drusano. 1995. Efficacy of constant infusion of A77003, an inhibitor of the human immunodeficiency virus type 1 (HIV-1) protease, in limiting acute HIV-1 infection in vitro. Antimicrob. Agents Chemother. 39:2523-2527. [DOI] [PMC free article] [PubMed] [Google Scholar]
- 4.Bright, R. A., M. J. Medina, X. Xu, G. Perez-Oronoz, T. R. Wallis, X. M. Davis, L. Povinelli, N. J. Cox, and A. I. Klimov. 2005. Incidence of adamantane resistance among influenza A (H3N2) viruses isolated worldwide from 1994 to 2005: a cause of concern. Lancet 366:1175-1181. [DOI] [PubMed] [Google Scholar]
- 5.Bright, R. A., D. K. Shay, B. Shu, N. J. Cox, and A. I. Klimov. 2006. Adamantane resistance among influenza A viruses isolated early during the 2005-2006 influenza season in the United States. JAMA 295:891-894. [DOI] [PubMed] [Google Scholar]
- 6.Cui, J., Y. Liu, R. Wang, W. Tong, K. Drlica, and X. Zhao. 2006. The mutant selection window in rabbits infected with Staphylococcus aureus. J. Infect. Dis. 194:1601-1608. [DOI] [PubMed] [Google Scholar]
- 7.D'Argenio, D. Z., and A. Schumitzky. 1997. ADAPT II. A program for simulation, identification, and optimal design. User's manual. Biomedical Simulations Resource, University of Southern California, Los Angeles, CA.
- 8.Dawood, F. S., S. Jaim, L. Finelli, M. W. Shaw, S. Lindstrom, R. J. Garten, L. V. Gubareva, X. Xu, C. B. Bridges, and T. Uyeki. 2009. Emergence of a novel swine-origin influenza A (H1N1) virus in humans. N. Engl. J. Med. 360:2605-2615. [DOI] [PubMed] [Google Scholar]
- 9.Deyde, V. M., X. Xu, R. A. Bright, M. Shaw, C. B. Smith, Y. Zhang, Y. Shu, L. V. Gubareva, N. J. Cox, and A. I. Klimov. 2007. Surveillance of resistance to adamantanes among influenza A(H3N2) and A(H1N1) viruses isolated worldwide. J. Infect. Dis. 196:249-257. [DOI] [PubMed] [Google Scholar]
- 10.Douglas, W. R. 1975. Influenza in man, p. 397-446. In E. D. Kilbourne (ed.), Influenza viruses and influenza. Academic Press, New York, NY.
- 11.Drusano, G. L., P. A. Bilello, W. T. Symonds, D. S. Stein, J. McDowell, A. Bye, and J. A. Bilello. 2002. Pharmacodynamics of abacavir in an in vitro hollow fiber model system. Antimicrob. Agents Chemother. 46:464-470. [DOI] [PMC free article] [PubMed] [Google Scholar]
- 12.Drusano, G. L., J. A. Bilello, S. L. Preston, E. Omara, S. Kaul, S. Schnittman, and R. Echols. 2001. Hollow fiber unit evaluation of a new human immunodeficiency virus (HIV)-1 protease inhibitor, BMS232632, for determination of the linked pharmacodynamic variable. J. Infect. Dis. 183:1126-1129. [DOI] [PubMed] [Google Scholar]
- 13.Drusano, G. L., K. H. P. Moore, J. P. Kleim, W. Prince, and A. Bye. 2002. Rational dose selection for a nonnucleoside reverse transcriptase inhibitor through use of population pharmacokinetic modeling and Monte Carlo simulation. Antimicrob. Agents Chemother. 46:913-916. [DOI] [PMC free article] [PubMed] [Google Scholar]
- 14.Firsov, A. A., I. Y. Lubenko, M. V. Smirnova, E. N. Strukova, and S. H. Zinner. 2008. Enrichment of fluoroquinolone-resistant Staphylococcus aureus: oscillating ciprofloxacin concentrations simulated at the upper and lower portions of the mutant selection window. Antimicrob. Agents Chemother. 52:1924-1928. [DOI] [PMC free article] [PubMed] [Google Scholar]
- 15.Govorkova, E. A., H.-B. Fang, M. Tan, and R. G. Webster. 2004. Neuraminidase inhibitor-rimantadine combinations exert additive and synergistic anti-influenza virus effects in MDCK cells. Antimicrob. Agents Chemother. 48:4855-4863. [DOI] [PMC free article] [PubMed] [Google Scholar]
- 16.Gubareva, L. V., and F. G. Hayden. 2006. M2 and neuraminidase inhibitors: anti-influenza activity, mechanisms of resistance, and clinical effectiveness, p. 169-202. In Y. Kawaoka (ed.), Influenza virology current topics. Caister Academic Press, Norfolk, England.
- 17.Gumbo, T., A. Louie, M. R. Deziel, L. M. Parsons, M. Salfinger, and G. L. Drusano. 2004. Selection of a moxifloxacin dose that suppresses Mycobacterium tuberculosis resistance using an in vitro pharmacodynamic infection model and mathematical modeling. J. Infect. Dis. 190:1642-1651. [DOI] [PubMed] [Google Scholar]
- 18.Gumbo, T., A. Louie, W. Liu, P. G. Ambrose, S. M. Bhavnani, D. Brown, and G. L. Drusano. 2007. Isoniazid's bactericidal activity ceases because of the emergence of resistance, not depletion of Mycobacterium tuberculosis in the log phase of growth. J. Infect. Dis. 195:194-201. [DOI] [PubMed] [Google Scholar]
- 19.Hay, A. J. 1996. Amantadine and rimantadine—mechanisms, p. 21-30. In D. D. Richman (ed.), Antiviral drug resistance. John Wiley and Sons Ltd., New York, NY.
- 20.Hayden, F. G. 2006. Antiviral resistance in influenza viruses—implications for management and pandemic response. N. Engl. J. Med. 354:785-788. [DOI] [PubMed] [Google Scholar]
- 21.Hayden, F. G., K. M. Cote, and R. G. Douglas, Jr. 1980. Plaque inhibition assay for drug susceptibility testing of influenza viruses. Antimicrobial. Agents Chemother. 17:865-870. [DOI] [PMC free article] [PubMed] [Google Scholar]
- 22.Hayden, F. G., L. V. Gubareva, A. S. Monto, T. C. Klein, M. J. Elliott, J. M. Hammond, S. J. Sharp, and M. J. Ossi for the Zanamivir Family Study Group. 2000. Inhaled zanamivir for the prevention of influenza in families. N. Engl. J. Med. 343:1282-1289. [DOI] [PubMed] [Google Scholar]
- 23.Ilyushina, N. A., N. V. Bovin, R. G. Webster, and E. A. Govorkova. 2006. Combination chemotherapy, a potential strategy for reducing the emergence of drug-resistant influenza A variants. Antiviral Res. 70:121-131. [DOI] [PubMed] [Google Scholar]
- 24.Jumbe, N., A. Louie, R. Leary, W. Liu, M. R. Deziel, V. H. Tam, R. Bachhawat, C. Freeman, J. B. Kahn, K. Bush, M. N. Dudley, M. H. Miller, and G. L. Drusano. 2003. Application of a mathematical model to prevent in-vivo amplification of antibiotic-resistant bacterial populations during therapy. J. Clin. Invest. 112:275-285. [DOI] [PMC free article] [PubMed] [Google Scholar]
- 25.Kilbourne, E. D. 2006. Influenza pandemics of the 20th century. Emerg. Infect. Dis. 12:9-14. [DOI] [PMC free article] [PubMed] [Google Scholar]
- 26.Laplante, J. M., S. A. Marshall, M. Shudt, T. T. Van, E. S. Reisdorf, L. A. Mingle, P. A. Shudt, and K. St. George. 2009. Influenza antiviral resistance testing in New York and Wisconsin, 2006 to 2008: methodology and surveillance data. J. Clin. Microbiol. 47:1372-1378. [DOI] [PMC free article] [PubMed] [Google Scholar]
- 27.Masihi, K. N., B. Schweiger, T. Finsterbusch, and H. Hengel. 2007. Low dose oral combination chemophropylaxis with oseltamivir and amantadine for human influenza A virus infections in mice. J. Chemother. 19:295-303. [DOI] [PubMed] [Google Scholar]
- 28.McSharry, J. J., A. C. McDonough, B. A. Olson, and G. L. Drusano. 2004. Phenotypic drug susceptibility assay for influenza virus neuraminidase inhibitors. Clin. Diagn. Lab. Immunol. 11:21-28. [DOI] [PMC free article] [PubMed] [Google Scholar]
- 29.McSharry, J. J., Q. Weng, A. Brown, R. Kulawy, and G. L. Drusano. 2009. Prediction of the pharmacodynamically-linked variable of oseltamivir carboxylate for influenza A virus using an in vitro hollow fiber infection model system. Antimicrob. Agents Chemother. 53:2375-2381. [DOI] [PMC free article] [PubMed] [Google Scholar]
- 29a.McSharry, J. J., K. Zager, E. Driebe, D. Engelthaler, P. Keim, P. Spence, D. Chernoff, G. Drusano, and J. Nguyen. 2008. An in vitro system for modeling influenza A virus resistance under drug pressure. Abstr. 2008 Am. Soc. Microbiol. Biodefense Res. Meet., Baltimore, MD, 24 to 27 February 2008.
- 30.Monto, A. S. 2008. Antivirals and influenza: frequency of resistance. Pediatr. Infect. Dis. J. 27:S110-112. [DOI] [PubMed] [Google Scholar]
- 31.Moscona, A. 2005. Neuraminidase inhibitors for influenza. N. Engl. J. Med. 353:1363-1373. [DOI] [PubMed] [Google Scholar]
- 32.Moscona, A. 2009. Global transmission of oseltamivir-resistant influenza. N. Engl. J. Med. 360:953-956. [DOI] [PubMed] [Google Scholar]
- 33.Preston, S. L., P. J. Piliero, J. A. Bilello, D. S. Stein, W. T. Symonds, and G. L. Drusano. 2003. In vitro model for evaluating the antiviral activity of amprenavir in combination with ritonovar administered at 600 and 100 milligrams, respectively, every 12 hours. Antimicrob. Agents Chemother. 47:3393-3399. [DOI] [PMC free article] [PubMed] [Google Scholar]
- 34.Smee, D. F., B. L. Hurst, M-H Wong, K. W. Bailey, and J. D. Morrey. 2009. Effects of double combinations of amantadine, oseltamivir, and ribavirin on influenza A (H5N1) virus infection in cells and in mice. Antimicrob. Agents Chemother. 53:2120-2128. [DOI] [PMC free article] [PubMed] [Google Scholar]
- 35.Tam, V. H., A. Louie, M. R. Deziel, W. Liu, R. Leary, and G. L. Drusano. 2005. Bacterial population responses to drug selective pressure: examination of garenoxacin against Pseudomonas aeruginosa. J. Infect. Dis. 192:420-428. [DOI] [PubMed] [Google Scholar]
- 36.Tam, V. H., A. Louie, M. R. Deziel, W. Liu, and G. L. Drusano. 2007. The relationship between quinolone exposures and resistance amplification is characterized by an inverted U: a new paradigm for optimizing pharmacodynamics to counterselect resistance. Antimicrob. Agents Chemother. 51:744-747. [DOI] [PMC free article] [PubMed] [Google Scholar]
- 37.Tam, V. H., A. Louie, T. R. Fritsche, M. Deziel, W. Liu, D. L. Brown, L. Deshpande, R. Leary, R. N. Jones, and G. L. Drusano. 2007. Drug exposure intensity and duration of therapy's impact on emergence of resistance of Staphylococcus aureus to a quinolone antimicrobial. J. Infect. Dis. 195:1818-1827. [DOI] [PubMed] [Google Scholar]
- 38.Thompson, W. W., D. K. Shay, E. Weintraub, L. Brammer, N. Cox, L. J. Anderson, and K. Fukuda. 2003. Mortality associated with influenza and respiratory syncytial virus in the United States. JAMA 289:179-186. [DOI] [PubMed] [Google Scholar]
- 39.Treanor, J. J., F. G. Hayden, P. S. Vrooman, R. Barbarash, R. Bettis, D. Riff, S. Singh, N. Kinnersley, P. Ward, and R. G. Mills for the U.S. Oral Neuraminidase Study Group. 2000. Efficacy and safety of the oral neuraminidase inhibitor oseltamivir in treating acute influenza: a randomized, controlled trial. JAMA 283:1016-1024. [DOI] [PubMed] [Google Scholar]


