Abstract
To study the adaptation of an intestinal bacterium to its natural environment, germfree mice were associated with commensal Escherichia coli MG1655. Two-dimensional gel electrophoresis was used to identify proteins differentially expressed in E. coli MG1655 collected from either cecal contents or anaerobic in vitro cultures. Fourteen differentially expressed proteins (>3-fold; P < 0.05) were identified, nine of which were upregulated in cecal versus in vitro-grown E. coli. Four of these proteins were investigated further for their role in gut colonization. After deletion of the corresponding genes, the resulting E. coli mutants were tested for their ability to colonize the intestines of gnotobiotic mice in competition with the wild-type strain. A mutant devoid of ydjG, which encodes a putative NADH-dependent methylglyoxal reductase, reached a 1.2-log-lower cecal concentration than the wild type. Deletion of the nanA gene encoding N-acetylneuraminate lyase affected the colonization and persistence of E. coli in the intestines of the gnotobiotic mice only slightly. A mutant devoid of 5′-phosphoribosyl 4-(N-succinocarboxamide)-5-aminoimidazole synthase, a key enzyme of purine synthesis, displayed intestinal cell counts >4 logs lower than those of the wild type. Deletion of the gene encoding aspartate carbamoyltransferase, a key enzyme of pyrimidine synthesis, even resulted in the washout of the corresponding mutant from the mouse intestinal tract. These findings indicate that E. coli needs to synthesize purines and pyrimidines to successfully colonize the mouse intestine.
The human gastrointestinal tract harbors a complex community of approximately 1014 microorganisms (11). Whereas the impact of intestinal bacteria on the host has been studied in detail, knowledge about the impact of host factors on gut microorganisms is still limited. Only a few proteomic studies have investigated the response of bacteria to the intestinal environment. The application of proteome analysis to the infant fecal ecosystem was hampered by the complexity of the microbial community: only 1 of 11 determined peptide sequences could be linked to an enzyme, the bifidobacterial transaldolase (8). In contrast, several metabolic pathways involved in carbon assimilation were demonstrated to be upregulated in Lactococcus lactis when investigated with mice monoassociated with this organism. YwcC, a phosphogluconolactonase probably involved in the pentose phosphate pathway, was found to be essential for the organism's ability to colonize the mouse intestinal tract (15). Bifidobacterium longum was reported to express, after brief exposure to the gastrointestinal environment, several sets of proteins, including adhesion factors and metabolic genes (18). Comparative proteome analysis of Escherichia coli grown in vitro on LB or in the intestines of monoassociated mice indicated that E. coli utilizes a wider range of substrates in the mouse intestine than under in vitro conditions and is exposed to various forms of stress, including starvation (2).
The present study was aimed at the identification of proteins essential for the colonization and persistence of E. coli in the gastrointestinal environment. The well-characterized nonpathogenic E. coli strain MG1655 was grown in vitro and its proteome compared with that of the same strain isolated from the ceca of monoassociated mice. To reduce the differences in nutrient availability between the in vivo and the in vitro situation, the in vitro cultures were grown anaerobically on a broth prepared from the mouse chow. Selected bacterial proteins undergoing the most prominent upregulation in the mouse cecum were identified and tested for their possible role in colonization. For that purpose, targeted deletion mutants were tested in competition with the wild-type (WT) strain with respect to their ability to successfully colonize the germfree mouse intestine. The results suggest that E. coli needs to synthesize purines and pyrimidines to colonize and persist in the mouse intestine.
MATERIALS AND METHODS
Bacterial strain and growth conditions.
E. coli K-12 MG1655 (CGSC 6300) was kindly provided by K. Schnetz, University of Cologne, Germany. E. coli cells were grown anaerobically in MOPS (morpholinepropanesulfonic acid)-buffered Ringer solution (100 mM MOPS, 8.6 g/liter NaCl, 0.3 g/liter KCl, 0.33 g/liter CaCl2, pH 7.0, 0.25 g/liter l-cysteine, and 1 mg/liter resazurin) supplemented with 2.4% (wt/vol) standard mouse chow (Altromin 1310) at 37°C. The bacteria were harvested by a two-step procedure: particles of the mouse chow were removed by low-speed centrifugation (300 × g at 4°C for 3 min), and the bacterial cells were subsequently sedimented at 10,000 × g at 4°C for 3 min. For proteome analysis of in vitro-grown E. coli, bacterial cells were collected in the exponential and stationary phases. To minimize the influence of growth phase-dependent variations, the mean of the in vitro protein expression level in both phases was compared with the protein expression level of E. coli cells from the cecum.
Mouse colonization experiments and sample preparation.
The germfree status of the animals was confirmed before each experiment. Twenty C3H mice (9 to 12 weeks old) were kept in filter top cages under a laminar flow hood for the duration of the experiment. The mice had free access to sterile food and autoclaved water. Each mouse was orogastrically inoculated with 1 × 10⁹ E. coli cells. After 21 days, the mice were killed and the cecum contents were collected, weighed, and diluted 1:10 (wt/vol) with phosphate-buffered saline (PBS) containing a protease inhibitor mix (GE Healthcare) at a 100-fold dilution. After homogenization of intestinal contents by agitation with a Uniprep 24 (speed 2; Uniequip, Martinsried, Germany) in the presence of glass beads (diameter, 2.85 to 3.33 mm), the samples were centrifuged (300 × g at 4°C for 3 min) to remove coarse particles originating from the feed and cell counts were determined from the supernatants by plating on LB-Lennox (9) agar.
Isolation of bacteria from cecal contents and in vitro cultures.
The above-mentioned supernatants were centrifuged (10,000 × g at 4°C for 3 min), and the pelleted cells were resuspended in washing buffer (10 mM Tris, pH 8, 5 mM magnesium acetate, 30 mg/liter chloramphenicol, protease inhibitor mix 1:100 diluted). The cells were subsequently isolated by Nycodenz (Axis-shield PoC; AS, Oslo, Norway) gradient centrifugation as described by Roy et al. (15), with slight modifications. Briefly, 0.5 ml of a Nycodenz solution (40% [wt/vol]) was overlaid with 0.5 ml cell suspension and centrifuged for 15 min at 186,000 × g and 4°C. The E. coli cells at the interface were recovered and washed 5 times with washing buffer at 4°C. Washed cells were stored at −80°C.
Preparation of whole-bacterial-cell protein extracts.
Frozen cells were thawed, resuspended in 0.8 ml lysis buffer (8 M urea, 30 mM Tris, 4% [wt/vol] CHAPS {3-[(3-cholamidopropyl)-dimethylammonio]-1-propanesulfonate}, pH 8.5) and mechanically disrupted with zirconia-silica beads (0.1 mm; Roth, Karlsruhe, Germany) in an FP120 FastPrep cell disruptor (Thermo Scientific, Waltham, MA) by applying three 20-s cycles of homogenization, using a speed of 4.0 m/s, interrupted by 5-min intervals for cooling on ice. Unbroken cells were removed by centrifugation (14.000 × g at 4°C for 20 min). Components interfering with proteomic analysis were removed by selective precipitation of proteins (2-D clean-up kit; GE Healthcare). The concentration of resuspended proteins was determined with the Bradford assay (Bio-Rad, Madrid, Spain). The pH of the protein solution was adjusted to pH 8.5 with non-pH-adjusted lysis buffer (8 M urea, 30 mM Tris, 4% [wt/vol] CHAPS) for an optimal reaction with the CyDye in the following step.
Two-dimensional difference in-gel electrophoresis.
The protein extracts were labeled according to the manufacturer's instructions with CyDyes (GE Healthcare) for difference in-gel electrophoresis (DIGE) and focused on immobilized pH gradient strips (pH range, 4 to 7; 24 cm) in an Ettan IPGphor 3 (GE Healthcare, Uppsala, Sweden). Active rehydration (30 V for 10 h) was followed by isoelectric focusing of the samples for a total of 60.2 kV·h at 20°C. The second dimension was run on 12.5% SDS gels in an Ettan-Dalt II apparatus at 1 W per gel for 45 min, followed by 17 W per gel for 3.5 h. The proteins were visualized with a Typhoon Trio laser scanner, and image analysis was done with DeCyder software version 6.5 (both from GE Healthcare, Uppsala, Sweden).
In-gel protein digestion.
Preparative gels were stained with ruthenium II tris (bathophenanthroline disulfonate) (14). Subsequently, proteins of interest were excised automatically using an Ettan-Dalt spot picker (GE Healthcare, Uppsala, Sweden) and subjected to tryptic digestion. Gel plugs were equilibrated twice with 50 mM NH4HCO3 and 50% methanol (MeOH) for 30 min and dehydrated with 100% acetonitrile using a 96-well plate format. Proteins were digested with 50 ng trypsin (Promega) in 25 mM NH4HCO3 overnight at 37°C. Peptides were extracted from the gel plugs with 50% acetonitrile and 0.1% trifluoroacetic acid for 20 min. The tryptically digested peptides were dried by vacuum centrifugation.
Identification of proteins.
The peptide mixtures were dissolved in 12 μl of 0.1% formic acid and analyzed by nano liquid chromatography-electrospray ionization-tandem mass spectrometry (NanoLC-ESI-MS-MS) (the injection volume was usually 0.5 to 5 μl). Data were acquired using a Waters nanoACQUITY ultraperformance liquid chromatography (UPLC) system (Milford, MA) and a Waters Micromass QTOF Ultima API hybrid quadrupole orthogonal acceleration time-of-flight mass spectrometer (Manchester, United Kingdom) fitted with a NanoLocksprayTM ion source. The nanoACQUITY UPLC system consisted of a binary solvent manager, an auxiliary solvent manager, and a sample manager with a cooled sample tray and was equipped with a 180-μm by 20-mm (5-μm) Waters Symmetry C18 trap column and a 100-μm by 100-mm (1.7-μm) Waters BEH130 C18 analytical column. Samples were loaded from the binary solvent manager and trapped for online desalting with 1% solvent B for 3 min at a flow rate of 5 μl/min (solvent A, aqueous 0.1% formic acid [vol/vol]; solvent B, 0.1% formic acid-acetonitrile [vol/vol]). For elution and separation of the peptides, an increasing organic solvent concentration (1% B solvent to 25% B solvent in 16 min and 25% B solvent to 85% B solvent in 1 min) was applied at a flow rate of 400 nl/min.
ESI-MS and MS-MS analysis, data processing, and protein identification were performed as described previously (1, 2), except that ProteinLynx Global Server software version 2.3 (Waters Corporation) and Swiss-Prot version 57.2 (http://www.expasy.org/sprot/) were used for processing of the MS-MS data and subsequent databank searching. In order to eliminate false-positive results, a second search was performed using the randomized database. Some proteins were in addition identified by the Proteome Factory AG, Berlin, Germany.
Generation of deletion mutants.
Chromosomal sequences comprising the targeted genes were replaced by a kanamycin resistance cassette according to the technique of Datsenko and Wanner (6), using pKD13 as a template for the antibiotic resistance gene. The primers used for construction of the deletion mutants are listed in Table 1. Mutant candidates were tested for the loss of the target gene by PCR with kanamycin (k1 and k2)- and locus-specific primers. In addition, mutants were sequenced for genotype confirmation and tested for their growth phenotype.
TABLE 1.
Details of chromosomal gene and operon disruptionsa
| Gene or operon | Homology extensionsb |
|---|---|
| purC | 50 nt; H1, 2595638C; H2, 2594947 |
| pyrBI | 50 nt; H1, 4470416C; H2, 4469029 |
| nanA | 50 nt; H1, 3371596C; H2, 3370725 |
| nanT | 50 nt; H1, 3370594C; H2, 3369126 |
| ydjLKJIHG | 50 nt; H1, 1859354C; H2, 1852122 |
The template for all mutants was pKD13, and the priming sites for all mutants were P1 and P2. One primer had the H1 extension and the 3′ sequence for priming site P1 (TGTAGGCTGGAGCTGCTTCG), and one had the H2 extension and the 3′ sequence for the complement of priming site P2 (ATTCCGGGGATCCGTCGACC). The nomenclature for extensions and priming sites is based on reference 6.
Extension lengths are given first. Numerals identify the position of the 3′ nucleotide of the extension in the E. coli genome sequence (GenBank accession no. U00096.2). C, complement; H1, homology 1; H2 homology 2.
Complementation of the pyrBI mutant.
The pyrLBI genes were PCR amplified from MG1655 with the primer sequences GGAATTCTTAATTGGCCAGCACCACATTA and GCAAGCTTATAGCGCGCATCCCTGAGCA, and a 1,688-nucleotide (nt) EcoRI-PstI fragment was cloned into the low-copy-number plasmid pSU19 (3), giving ppyrLBI. The insert was verified by sequencing (Eurofins MWG Operon, Ebersberg, Germany). The construct includes the physiologically relevant P2 promoter of the pyr operon and the cis-regulatory pyrL element (10).
Mouse competition experiments.
For each competition experiment, four germfree C3H mice (9 to 12 weeks old) were kept in positive-pressure isolators (Metall+Plastik, Radolfzell-Stahringen, Germany) and housed individually in polycarbonate cages. The mice had free access to sterile food and autoclaved water. Each mouse was orogastrically inoculated with 5 × 10⁸ E. coli MG1655 cells and 5 × 10⁸ cells of the respective E. coli mutant (the purC, pyrBI, nanA, or ydjLKJIHG mutant). Fecal samples were collected starting 1 day after the association and analyzed by plate counting for wild-type and mutant cell numbers. After 21 days, the mice were killed and cecum contents were collected and analyzed as described above.
Determination of nucleosides and nucleobases in luminal gut contents.
The procedure is based on the method of Czarnecka et al. (5), with major modifications. The nucleosides and nucleobases were isolated from cecum contents and from in vitro samples by solid phase extraction with Strata X columns (30 mg/ml; Phenomenex, Aschaffenburg, Germany). The columns were sequentially conditioned with 1 ml 25 mM ethanolamine, pH 8.0, loaded with 0.5 ml of supernatant from resuspended and centrifuged cecum content or an in vitro sample, and washed with 1 ml 50% methanol. The flowthrough and the 50% methanol fractions were lyophilized, resuspended in 50 μl deionized water, and defatted with n-hexane (1:5 [vol/vol]). For high-performance liquid chromatography (HPLC) analysis, 40 μl of the water phase was used.
Nucleosides and nucleobases were separated by reversed-phase, ion pair chromatography on a C18 column (250 by 4 mm [5 μm]; LiChrospher 100 RP-18; Merck, Darmstadt, Germany). The mobile phase was 100 mM potassium acetate, pH 4.5, 2 mM hexane sulfonic acid (solvent A), acetonitrile (solvent B), and deionized water (solvent C) (1 to 4.2% solvent B in 6 min, 4.2 to 4.8% solvent B in 5 min, 4.8 to 7% solvent B in 3 min, 7% solvent B for 2 min, 100% solvent C in 5 min, 100% solvent B in 5 min, 100% solvent C in 5 min, and 1% solvent B for 5 min) at a flow rate of 1 ml/min. The nucleosides and nucleobases were detected at 255 nm. Thymine, thymidine, cytosine, cytidine, uracil, uridine, guanine, guanosine, adenine, and adenosine (Sigma) served as standards for calibration.
Characterization of deletion mutants.
Cells were precultured aerobically overnight in MOPS-minimal medium (12) supplemented with 50 mM glucose and 100 μM adenine (purC) or 100 μM uracil (pyrBI), washed with minimal medium lacking nucleobases, and inoculated at 6.6 × 10⁷ CFU/ml into MOPS-minimal medium containing 50 mM glucose and either 100 μM adenine, guanine, adenosine, or guanosine for the purC mutant or 100 μM uracil, cytosine, thymine, uridine, cytidine, or thymidine for the pyrBI mutant. The cultures were incubated aerobically at 37°C for 24 h, and growth was monitored by measuring the optical density at 600 nm (OD600). Similarly, the nan mutant was tested in MOPS-minimal medium supplemented with either glucose (10 mM) or N-acetylneuraminic acid (Neu5Ac; 10 mM) as the carbon source.
RESULTS AND DISCUSSION
Identification of proteins involved in the adaptation of E. coli to the intestinal environment.
To gain insight into the mechanisms that enable bacteria to adapt to the intestinal environment, mice monoassociated with commensal E. coli MG1655 were used as a simplified model of host-microbiota interactions. Protein expression of E. coli in the ceca of these mice was compared with that of E. coli grown anaerobically in vitro on rodent chow (2.4% [wt/vol]). The comparative analysis of the in vivo versus in vitro conditions revealed 14 differentially expressed proteins (≥3-fold; P < 0.05) (Table 2), with 9 proteins being upregulated and 5 proteins being downregulated in the in vivo-grown cells versus the in vitro-grown cells. Four of the upregulated proteins were selected for more-detailed investigations. The choice was based on the difference in expression and their suspected biological importance. The proteins whose abundance increased maximally under in vivo conditions were the aspartate transcarbamoylase (ATCase; PyrB) and the phosphoribosylaminoimidazole-succinocarboxamide synthetase (SAICAR-synthetase; PurC) (Table 2). The ATCase catalyzes the first committed step of pyrimidine nucleotide synthesis, namely, the conversion of carbamoylphosphate and l-aspartate to N-carbamoyl-l-aspartate. The SAICAR-synthetase catalyzes the eighth step in the biosynthesis of IMP, the precursor of ADP and GMP: 5′-phosphoribosyl-5-aminoimidazole-4-carboxylate + l-aspartic acid + ATP → (5′-phosphoribosyl-4-(N-succinocarboxamide)-5-aminoimidazole + ADP + Pi.
TABLE 2.
Proteins with differential expression factors of ≥3 in cecal samples compared to the level for in vitro cultures
| Protein group and Swiss-Prot accession no. | Gene | Protein description | Fold changea |
|---|---|---|---|
| Proteins upregulated in vivo | |||
| P0A786 | pyrB | Aspartate carbamoyltransferase catalytic chain | 13.3 |
| P0A7D7 | purC | Phosphoribosylaminoimidazole-succinocarboxamide synthase | 7.4 |
| P0AF93 | yjgF | Uncharacterized protein | 5.6 |
| P61889 | mdh | Malate dehydrogenase | 3.8 |
| P77256 | ydjG | Uncharacterized oxidoreductase YdjG | 3.5 |
| Q46856 | yqhD | Alcohol dehydrogenase YqhD | 3.4 |
| P0A6L4 | nanA | N-Acetylneuraminate lyase | 3.0 |
| P0AEX9 | malE | Maltose-binding periplasmic protein | 3.0 |
| P68066 | yfiD | Autonomous glycyl radical cofactor | 3.0 |
| Proteins downregulated in vivo | |||
| P23843 | oppA | Periplasmic oligopeptide-binding protein, spot 1 | 7.0 |
| P23843 | oppA | Periplasmic oligopeptide-binding protein, spot 2 | 4.5 |
| P0AFM2 | proX | Glycine betaine-binding periplasmic protein | 4.2 |
| P0A964 | cheW | Chemotaxis protein cheW | 3.8 |
| P0A9Q9 | asd | Aspartate-semialdehyde dehydrogenase | 3.0 |
Values are averages of results from 3 biological replicates. P was ≤0.05 for all changes.
The uncharacterized protein YdjG, a putative NADH-dependent methylglyoxal reductase (7), was 3.5-fold upregulated in vivo. The corresponding gene, ydjG, is part of an operon which encodes additional proteins with the predicted functions of two oxidoreductases, an aldolase, a kinase, and a transport protein. This led us to hypothesize that YdjG could be part of a new metabolic pathway for the degradation of a so-far-unidentified substrate required for colonization.
Moreover, the N-acetylneuraminate lyase (NanA) was 3-fold upregulated in vivo. This enzyme catalyzes the first step in the degradation of N-acetylneuraminic acid (Neu5Ac). It cleaves off a pyruvate moiety from Neu5Ac, yielding N-acetylmannosamine. An increased level of NanA in the cecum suggests that E. coli utilizes Neu5Ac as an energy and carbon source. This amino-sugar serves as a terminal carbohydrate moiety in the side chains of numerous glycoconjugates present on the surfaces of epithelial cells and in mucus.
The observed upregulation of PyrB, PurC, YdjG, and NanA suggested that E. coli depends on these proteins to colonize and persist in the mouse intestinal tract. To test this hypothesis, each of the corresponding genes was deleted and the resulting deletion mutants were subsequently tested for their ability to colonize the intestinal tracts of mice in competition with the parental E. coli strain.
Deletion of the genes encoding NanA and YdjG affects intestinal colonization by E. coli only slightly.
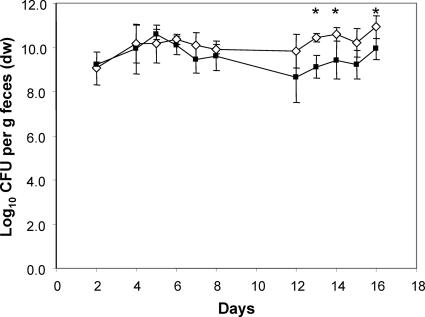
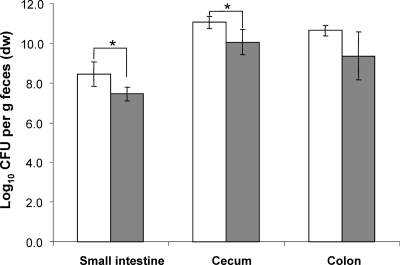
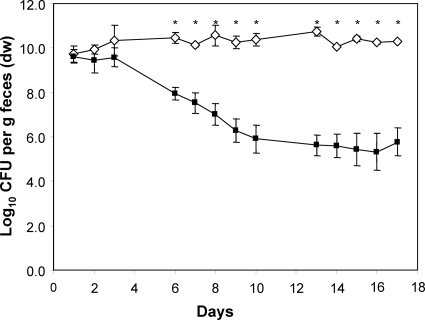
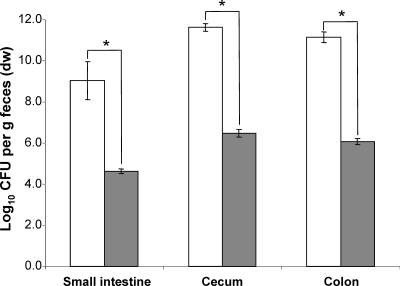
In vitro, the nanA mutant did not grow on Neu5Ac as the sole source of carbon and energy, indicating that the deletion of this gene prevents the utilization of Neu5Ac (data not shown). Following the application of equal cell numbers of the wild type and the nanA mutant strain to germfree mice, the two strains did not differ in their fecal cell concentrations until day 8 (9 to 10 log CFU/g feces), indicating that the nanA mutant colonized the mouse intestine with the same efficiency as the parental strain. However, 12 days after the association, the fecal cell number of the mutant strain was 1 log lower than that of the wild-type strain, but this difference was significant only at some sampling times (Fig. 1). Analysis of different sections of the gastrointestinal tract revealed that the mutant strain displayed cell numbers in the small intestine and cecum that were 1 log lower than those observed for the wild type (P < 0.05). The difference of 1.2 log observed in the colon between the wild type and the nanA mutant was not statistically significant (Fig. 2).
FIG. 1.
Time course of the competition experiment between nanA mutant and wild-type E. coli. Individually housed germfree mice were associated with equal numbers of WT (white diamonds) and mutant (black squares) bacteria. At the indicated time points, fecal samples were collected and analyzed by plate counting for wild-type and mutant cell numbers. Data are expressed as means ± standard deviations for an experiment with 4 mice. The asterisks indicate significant differences, with P values of ≤0.05. dw, dry weight.
FIG. 2.
Analysis of the intestinal cell numbers at the end of the competition experiment between the nanA mutant and wild-type E. coli. White bars, WT; gray bars, nanA mutant. Data are expressed as means ± standard deviations for an experiment with 4 mice. The asterisks indicate significant differences, with P values of ≤0.05.
NanA is required for growth of E. coli on Neu5Ac, the predominant sialic acid found in mammalian cells (16, 17). Neu5Ac is a frequent component of glycoproteins on the surfaces of intestinal cells and of acidic mucopolysaccharides secreted into the intestinal tract. E. coli is capable of utilizing Neu5Ac as the sole source of carbon and energy (4). Chang et al. demonstrated that E. coli must be able to degrade Neu5Ac to permanently colonize the mouse intestinal tract. In contrast to these findings, we observed that deletion of nanA affected the ability of the E. coli to colonize the intestinal tracts of germfree mice in competition with the wild-type E. coli only slightly. This discrepancy could be due to the fact that Chang et al. (4) used the streptomycin-treated mouse model in which only facultative bacteria are eliminated while strict anaerobic bacteria are still present. The latter might keep the concentration of potential alternative substrates in the gut so low that the nanA deletion mutants find no substrates that can replace Neu5Ac. Since in our mouse model only wild-type E. coli competes with the mutant strain, it is conceivable that substrates other than Neu5Ac are still available in sufficient amounts to enable the growth of the mutant.
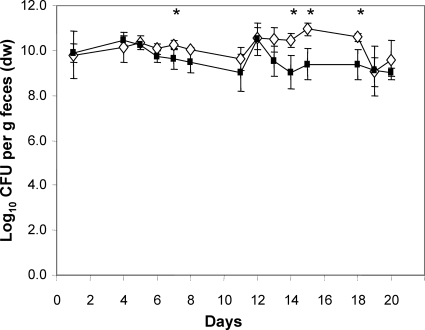
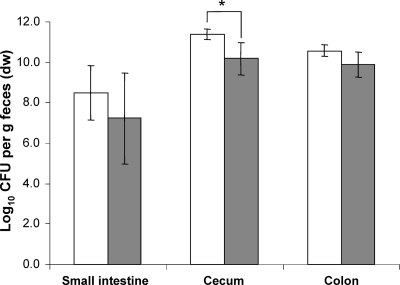
The fecal bacterial cell counts of mice associated with equal numbers of a ydjLKJIHG deletion mutant and wild-type E. coli differed only on a few days between the wild type and the deletion mutant. On these days, the cell numbers of the mutant were always lower than those of the wild type (Fig. 3). The cell numbers in the different sections of the intestine were 1 log lower for the mutant strain than for the wild-type strain, but only the difference observed in the cecum was statistically significant (P < 0.03) (Fig. 4).
FIG. 3.
Time course of the competition experiment between the ydj operon deletion mutant and wild-type E. coli. Individually housed germfree mice were associated with equal numbers of WT (white diamonds) and mutant (black squares) bacteria. At the indicated time points, fecal samples were collected and analyzed by plate counting for wild-type and mutant cell numbers in order to follow the colonization process through time. Data are expressed as means ± standard deviations for an experiment with 4 mice. The asterisks indicate significant differences, with P values of ≤0.05.
FIG. 4.
Analysis of the intestinal cell numbers at the end of the competition experiment between the ydj operon mutant and wild-type E. coli. White bars, WT; gray bars, ydj operon mutant. Data are expressed as means ± standard deviations for an experiment with 4 mice. The asterisk indicates a significant difference, with a P value of ≤0.05.
Since the deletion of the whole operon did not affect the mutant's ability to colonize the intestinal tract in competition with the wild type, it may be concluded that YdjG and its companion proteins are not a prerequisite to colonize the intestinal tract but that they may improve the growth and competitiveness of E. coli in certain sections of the digestive tract, such as the cecum, where the concentration of the wild type was somewhat higher than that of the mutant.
SAICAR-synthetase and aspartate transcarbamoylase support the establishment and persistence of E. coli in the mouse intestine.
The fecal cell number of the purC mutant decreased within 1 week after association by 4 logs, while the cell number of the wild-type strain remained unchanged (Fig. 5). This difference in cell numbers between the wild type and the mutant was also seen in the contents of the small intestine, cecum, and colon (Fig. 6), where the mutant strain exhibited cell counts 5 logs lower than those of the wild type.
FIG. 5.
Time course of the competition experiment between the purC mutant and wild-type E. coli. Individually housed germfree mice were associated with equal numbers of WT (white diamonds) and mutant (black squares) bacteria. At the indicated time points, fecal samples were collected and analyzed by plate counting for wild-type and mutant cell numbers in order to follow the colonization process through time. Data are expressed as means ± standard deviations for an experiment with 4 mice. The asterisks indicate significant differences with P ≤ 0.05.
FIG. 6.
Analysis of the intestinal cell numbers at the end of the competition experiment between the purC mutant and wild-type E. coli. White bars, WT; gray bars, purC mutant. Data are expressed as means ± standard deviations for an experiment with 4 mice. The asterisks indicate significant differences, with P values of ≤0.05.
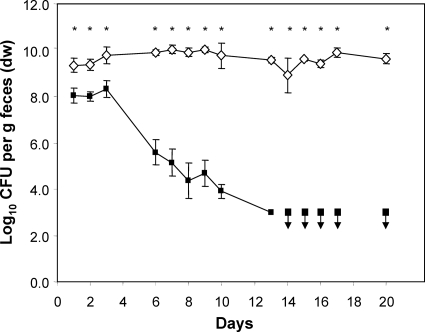
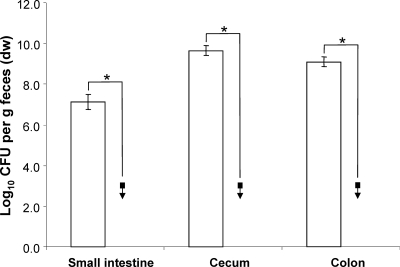
An even stronger reduction of cell numbers was caused by the pyrBI mutation, which deletes both subunits of the aspartate transcarbamoylase. While the fecal concentration of the wild-type strain remained unchanged throughout the experiment (9 to 10 log CFU/g feces), the fecal cell numbers of the pyrBI mutant decreased with time and fell below the detection limit (103 CFU g−1 dry feces) after day 13 (P < 0.002) (Fig. 7). Moreover, the mutant strain was not detectable in the intestinal contents of any of the gut sections (Fig. 8).
FIG. 7.
Time course of the competition experiment between the pyrBI mutant and wild-type E. coli. Individually housed germfree mice were associated with equal numbers of WT (white diamonds) and mutant (black squares) bacteria. At the indicated time points, fecal samples were collected and analyzed by plate counting for wild-type and mutant cell numbers in order to follow the colonization process through time. Black squares with down arrows indicate sampling points with mutant cell numbers below the detection limit of 103 CFU per g dry feces. Data are expressed as means ± standard deviations for an experiment with 4 mice. The asterisks indicate significant differences, with P values of ≤0.05.
FIG. 8.
Analysis of the intestinal cell numbers at the end of the competition experiment between the pyrBI mutant and wild-type E. coli. White bars, WT. Black squares with down arrows indicate mutant cell numbers below the detection limit of 103 CFU per g dry feces. Data are expressed as means ± standard deviations for an experiment with 4 mice. The asterisks indicate significant differences, with P values of ≤0.05.
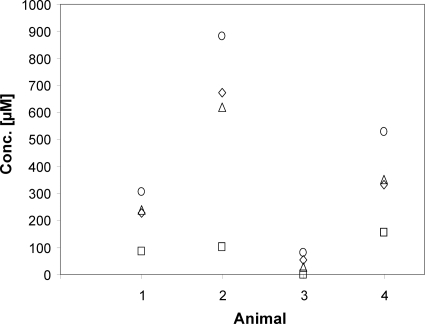
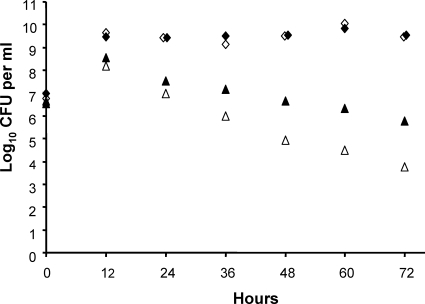
The fact that the purC and pyrBI mutants were diminished or washed out of the mouse intestine suggested that the unavailability of nucleotide precursors, combined with the mutants' inability to synthesize purines and pyrimidines, was responsible for the reduced cell numbers of the mutants in the ecosystem. In support of the first of these assumptions, the concentrations of adenine, adenosine, guanine, cytidine, cytosine, and thymine were under the detection limit (<5 μM) in small intestinal, cecal, and colonic contents. However, while the concentrations of guanosine, thymidine, uracil, and uridine in the cecum and colon were also below the detection limit (<5 μM), they reached considerable concentrations in the small intestine, arguing at first glance against the idea that the unavailability of precursors is the cause for the washout of the pyrBI mutant and the reduction of the purC mutant. A closer look at the precursor concentrations in the small intestine revealed a high level of variability between individual animals for uracil, uridine, and guanosine (Fig. 9). This indicates that the E. coli mutants may encounter periods in which the concentrations of the required precursors become limiting so that their growth is hampered. In support of this notion, the volume of the small intestinal contents of 19 mice was observed to vary between 0.122 and 0.860 ml (all animals were killed in the morning). This is probably caused by individual differences in the time of the last feed intake. On the basis of these observations, it is reasonable to assume that during a fasting period, the growth conditions in the small intestine deteriorate because the volume of the intestinal contents and the concentrations of the nucleotide precursors are diminished due to absorption. The ability of the wild type to synthesize these nucleotide precursors is probably the reason why the wild type outcompetes the mutants. It should also be noted that it takes several days for the mutants to be washed out or reach their minimal concentration. This interpretation of the data is also supported by a competition experiment (Fig. 10). Minimal media supplemented with 25 and 50 μM uracil, respectively, were inoculated with equal cell numbers of both the wild type and the pyrBI mutant. Every 12 h, the cell number was determined and 0.5% of the cell culture was transferred to fresh medium. Five such transfers resulted in reductions of the mutant strain by >3 and >5 log with supplementations of 50 and 25 μM uracil, respectively (Fig. 10).
FIG. 9.
Concentrations of uracil (diamonds), uridine (squares), thymidine (circles), and guanosine (triangles) in the small intestines of monoassociated mice.
FIG. 10.
Development of cell titers in a competition experiment between E. coli MG1655 (diamonds) and MG1655ΔpyrBI (triangles). Minimal media supplemented with 25 μM (open symbols) and 50 μM uracil (closed symbols) were inoculated with equal cell numbers of the two strains. Every 12 h, the cell numbers were determined and 0.5% of the cell culture was transferred to fresh medium.
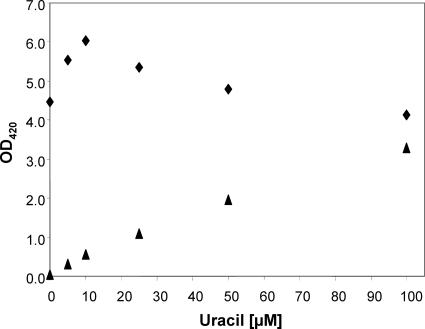
In support of the second of the above-mentioned assumptions, the purC and pyrBI mutants did not grow in minimal medium in the absence of nucleobases or nucleosides (data not shown). However, the purC mutant grew well on media supplemented with adenine, adenosine, guanine, and guanosine, which confirms previous findings obtained with purine auxotrophic mutants (19). Similarly, the pyrBI mutant grew on minimal medium when supplemented with uracil or uridine but not when supplemented with thymine or thymidine (data not shown). It is well known that thymine and thymidine cannot serve as pyrimidine sources for pyrimidine-requiring E. coli mutants if deoxy-ribose-1-phosphate is missing (13). Growth experiments with the pyrBI mutant on media supplemented with 5 to 100 μM uracil showed that the wild type and the mutant did not differ in their growth rates but differed in their final ODs (data not shown). At uracil concentrations of 100, 50, 25, 10, and 5 μM, the ODs reached by the mutant within 24 h were 3.3, 2.0, 1.1, 0.6, and 0.3. The unsupplemented wild type reached almost the same OD as the mutant supplemented with 100 μM uracil. Interestingly, uracil also stimulated the growth of the wild type, in particular at lower concentrations (Fig. 11). The higher maximal OD reached by the wild type at any of the tested uracil concentrations may be another reason why the mutant was outcompeted by the wild type.
FIG. 11.
Optical densities (OD420) of pure cultures as determined after 24 h of growth in minimal media supplemented with the indicated concentrations of uracil. Diamonds, MG1655; triangles, MG1655ΔpyrBI.
The OD observed for the pyrBI mutant after 24 h was similar to that observed for the mutant when it was supplemented with sufficient uracil or when the mutation was genetically complemented (data not shown).
Conclusion.
The lack of purines and pyrimidines in the cecum and colon and their unsteady supply in the small intestine impede the establishment of E. coli in the mouse intestine when the genes for their synthesis are deleted. Hence, the ability to synthesize nucleotides appears to be a prerequisite for colonization of the mouse intestine by E. coli.
Acknowledgments
We thank K. Schnetz for providing E. coli MG1655, I. Grüner and U. Lehmann for taking care of the animals, and B. Gruhl, S. Frenzel, and P. Albrecht for skillful technical assistance.
The project was supported by grant BL 257/7-1 from Deutsche Forschungsgemeinschaft.
Footnotes
Published ahead of print on 18 June 2010.
REFERENCES
- 1.Alpert, C., W. Engst, A. Guehler, T. Oelschlaeger, and M. Blaut. 2005. Bacterial response to eukaryotic cells: Analysis of differentially expressed proteins using nano liquid chromatography-electrospray ionization tandem mass spectrometry. J. Chromatogr. A 1082:25-32. [DOI] [PubMed] [Google Scholar]
- 2.Alpert, C., J. Scheel, W. Engst, G. Loh, and M. Blaut. 2009. Adaptation of protein expression by Escherichia coli in the gastrointestinal tract of gnotobiotic mice. Environ. Microbiol. 11:751-761. [DOI] [PubMed] [Google Scholar]
- 3.Bartolomé, B., Y. Jubete, E. Martínez, and F. de la Cruz. 1991. Construction and properties of a family of pACYC184-derived cloning vectors compatible with pBR322 and its derivatives. Gene 102:75-78. [DOI] [PubMed] [Google Scholar]
- 4.Chang, D. E., D. J. Smalley, D. L. Tucker, M. P. Leatham, W. E. Norris, S. J. Stevenson, A. B. Anderson, J. E. Grissom, D. C. Laux, P. S. Cohen, and T. Conway. 2004. Carbon nutrition of Escherichia coli in the mouse intestine. Proc. Natl. Acad. Sci. U. S. A. 101:7427-7432. [DOI] [PMC free article] [PubMed] [Google Scholar]
- 5.Czarnecka, J., M. Cieslak, and K. Michal. 2005. Application of solid phase extraction and high-performance liquid chromatography to qualitative and quantitative analysis of nucleotides and nucleosides in human cerebrospinal fluid. J. Chromatogr. B Analyt. Technol. Biomed. Life Sci. 822:85-90. [DOI] [PubMed] [Google Scholar]
- 6.Datsenko, K. A., and B. L. Wanner. 2000. One-step inactivation of chromosomal genes in Escherichia coli K-12 using PCR products. Proc. Natl. Acad. Sci. U. S. A. 97:6640-6645. [DOI] [PMC free article] [PubMed] [Google Scholar]
- 7.Di Luccio, E., R. A. Elling, and D. K. Wilson. 2006. Identification of a novel NADH-specific aldo-keto reductase using sequence and structural homologies. Biochem. J. 400:105-114. [DOI] [PMC free article] [PubMed] [Google Scholar]
- 8.Klaassens, E. S., W. M. de Vos, and E. E. Vaughan. 2007. A metaproteomics approach to study the functionality of the microbiota in the human infant gastrointestinal tract. Appl. Environ. Microbiol. 73:1388-1392. [DOI] [PMC free article] [PubMed] [Google Scholar]
- 9.Lennox, E. S. 1955. Transduction of linked genetic characters of the host by bacteriophage P1. Virology 1:190-206. [DOI] [PubMed] [Google Scholar]
- 10.Liu, C., J. P. Donahue, L. S. Heath, and C. L. Turnbough, Jr. 1993. Genetic evidence that promoter P2 is the physiologically significant promoter for the pyrBI operon of Escherichia coli K-12. J. Bacteriol. 175:2363-2369. [DOI] [PMC free article] [PubMed] [Google Scholar]
- 11.Luckey, T. D. 1972. Introduction to intestinal microecology. Am. J. Clin. Nutr. 25:1292-1294. [DOI] [PubMed] [Google Scholar]
- 12.Neidhardt, F. C., P. L. Bloch, and D. F. Smith. 1974. Culture medium for enterobacteria. J. Bacteriol. 119:736-747. [DOI] [PMC free article] [PubMed] [Google Scholar]
- 13.Neuhard, J. 1980. Utilization of preformed pyrimidine bases and nucleosides, p. 95-148. In A. Munch-Petersen (ed.), Metabolism of nucleotides, nucleosides and nucleobases in microorganisms. Academic Press, London, United Kingdom.
- 14.Rabilloud, T., J. M. Strub, S. Luche, A. van Dorsselaer, and J. Lunardi. 2001. A comparison between Sypro Ruby and ruthenium II tris (bathophenanthroline disulfonate) as fluorescent stains for protein detection in gels. Proteomics 1:699-704. [DOI] [PubMed] [Google Scholar]
- 15.Roy, K., M. Meyrand, G. Corthier, V. Monnet, and M. Y. Mistou. 2008. Proteomic investigation of the adaptation of Lactococcus lactis to the mouse digestive tract. Proteomics 8:1661-1676. [DOI] [PubMed] [Google Scholar]
- 16.Vimr, E. R., K. A. Kalivoda, E. L. Deszo, and S. M. Steenbergen. 2004. Diversity of microbial sialic acid metabolism. Microbiol. Mol. Biol. Rev. 68:132-153. [DOI] [PMC free article] [PubMed] [Google Scholar]
- 17.Vimr, E. R., and F. A. Troy. 1985. Identification of an inducible catabolic system for sialic acids (nan) in Escherichia coli. J. Bacteriol. 164:845-853. [DOI] [PMC free article] [PubMed] [Google Scholar]
- 18.Yuan, J., B. Wang, Z. Sun, X. Bo, X. Yuan, X. He, H. Zhao, X. Du, F. Wang, Z. Jiang, L. Zhang, L. Jia, Y. Wang, K. Wei, J. Wang, X. Zhang, Y. Sun, L. Huang, and M. Zeng. 2008. Analysis of host-inducing proteome changes in Bifidobacterium longum NCC2705 grown in vivo. J. Proteome Res. 7:375-385. [DOI] [PubMed] [Google Scholar]
- 19.Zalkin, H., and P. Nygaard. 1996. Biosynthesis of purine nucleotides, p. 561-579. In F. C. Neidhardt (ed.), Escherichia coli and Salmonella, vol. 1. ASM Press, Washington, DC. [Google Scholar]


