Abstract
Dynamic cardiac metrics, including myocardial strains and displacements, provide a quantitative approach to evaluate cardiac function. However, in current clinical diagnosis, largely 2D strain measures are used despite the fact that cardiac motions are complex 3D volumes over time. Recent advances in 4D ultrasound enable the capability to capture such complex motion in a single image data set. In our previous work, a 4D optical flow based motion tracking algorithm was developed to extract fully 4D dynamic cardiac metrics from such 4D ultrasound data. In order to quantitatively evaluate our tracking method, in-vivo coronary artery occlusion experiments at various locations were performed on three canine hearts. Each dog was screened with 4D ultrasound and sonomicrometry data was acquired during each occlusion study. The 4D ultrasound data from these experiments was then analyzed with our tracking method and estimated principal strain measures were directly compared to those recorded by sonomicrometry, and showed strong agreement. This is the first validation study of optical flow based strain estimation for 4D ultrasound with direct comparison with sonomicrometry using in-vivo data.
Keywords: cardiac strain, optical flow, speckle tracking, sonomicrometry, 4D ultrasound
1. INTRODUCTION
Quantification of global and regional myocardial function has long been a central issue in the evaluation of patients with and at risk for cardiovascular disease. Traditionally, measurement of left ventricular (LV) ejection fraction with echocardiography or angiography has been employed to evaluate global cardiac function. Myocardial strain analysis with echocardiography provides a more accurate and localized way to evaluate regional myocardial functions. It has been, and continues to be, an active area of research. Doppler ultrasound has become widespread for imaging flow and quantifying blood and tissue velocities. However, this method is limited by angular dependency, since it can only quantify motion along the direction of the transmitted acoustic wave. Speckle tracking methods [1-4] overcome this limitation by directly tracking the speckle patterns produced by the ultrasonic scatterers in blood and tissues. Tracking can be performed either in the image domain [2-4] or directly in the radio-frequency (RF) domain [1]. Although in theory this can be done on 1D, 2D, and 3D images, clinical applications are limited to 1D and 2D modalities, due to the lack of proper imaging methods for analyzing 3D and 4D ultrasound.
Development of real-time 3D (RT3D) echocardiography started in the late 1990s [5] based on matrix phased array transducers. Recently, a new generation of RT3D transducers was introduced by Philips Medical Systems (Andover, MA) in the SONOS 7500, followed by the iE33 model, which can acquire a fully sampled cardiac volume in four cardiac cycles and capture complex 4D cardiac motions. However, full exploitation of three-dimensional ultrasound data for qualitative and quantitative evaluation of cardiac function remains sub-optimal due to the lack of proper 4D analysis tools. To this date, there is no commercial real-time 3D ultrasound machine or software that can provide direct quantitative motion and strain measurements analogous to tissue Doppler or strain imaging. This has limited the application of RT3D echocardiography to anatomical measurements and gross visual inspection of cardiac motion.
For this reason, several image tracking based methods for motion and strain estimation using 3D ultrasound have been proposed. Meunier [3] analyzed the performance of 3D speckle tracking using simulated ultrasound images. Our group [6, 7] has shown that using a correlation-based optical flow method, myocardial motion fields can be estimated, from which directional displacements and strains can be reliably computed. In order to further evaluate the potential of this method, in this study, strain values estimated by our tracking method on ischemic regions were directly compared to “gold standard” strain measures acquired via sonomicrometry at the same locations, and recorded simultaneously during the ultrasound acquisition.
2. METHODOLOGY
In order to validate optical flow (OF) based strain measurements, three healthy mongrel dogs were studied in accordance with federal and institutional guidelines. Piezoelectric sonomicrometry crystals were inserted in the myocardium. The displacements and strains measured by sonomicrometry were recorded and computed. Real-time three-dimensional ultrasound data was acquired simultaneously. Segmental average values were derived from the ultrasound data by OF tracking and quantitatively compared to the corresponding values acquired by sonomicrometry.
2.1. Sonomicrometry Experiments
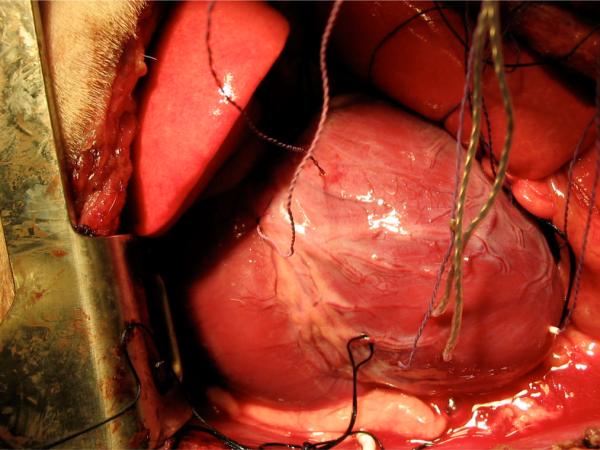
To measure the average values for myocardial deformation in the region of interest, three piezoelectric sonomicrometry crystals were placed in the midwall of the myocardium to form a triangle in the circumferential-longitudinal plane so that average values of the circumferential and longitudinal displacements and corresponding strain components could be accurately recorded through time. We selected the mid-anterior wall (supplied by the left anterior descending artery, LAD) as the region of interest. Besides these crystals, additional crystals were placed at the base and apex, as well as on the lateral, septal, posterior, and anterior walls for calculation of global cardiac function. Figure 1 shows the sonomicrometer placements for one experiment.
Figure 1.
Sonomicrometry set-up from one canine experiment.
Myocardial ischemia was induced by occluding the proximal LAD coronary artery with suture. Sonomicrometry data were recorded about 2 minutes after occlusion, along with 4D ultrasound acquisition. Longitudinal and circumferential strains were derived from measurements of segment shortening between each of the three crystals using the equation ds2 - dS2 = 2XTEX, where X represents marker location in the undeformed (end-diastole) state, E is the strain tensor, and dS and ds are the undeformed and deformed distances between crystal pairs. These strains were used as ground truth values to validate any strain measures computed from optical flow based tracking with the 4D ultrasound data.
2.2. Optical-flow based strain estimation from 4D ultrasound
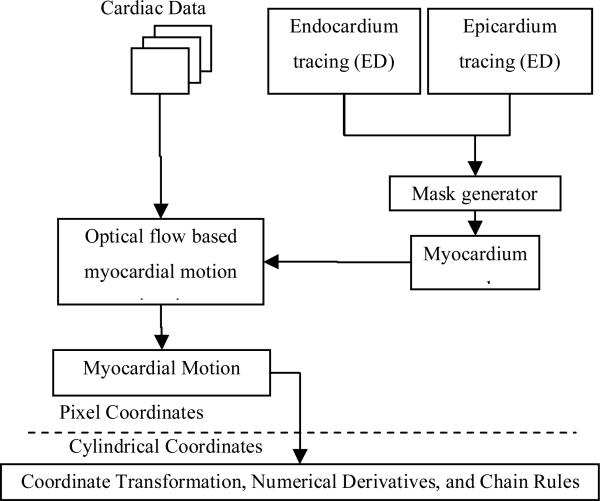
Our correlation-based optical flow (OF) computational framework has been successfully applied in the past for endocardium and epicardium tracking with solid agreement when compared to manual tracing [8, 9]. We want to demonstrate in this study that we can extend ventricular surface tracking to myocardium tracking, given that the myocardial boundary can be correctly tracked. Moreover, the dense myocardial motion field can be further derived based on tracking results. Several dynamic cardiac metrics including displacements and strains were computed based on the estimated motion field for the whole cardiac cycle. A flowchart of the computational framework is provided in Figure 2 below.
Figure 2.
Flow chart of computational framework for processing of 4D echocardiography data for measures of strain.
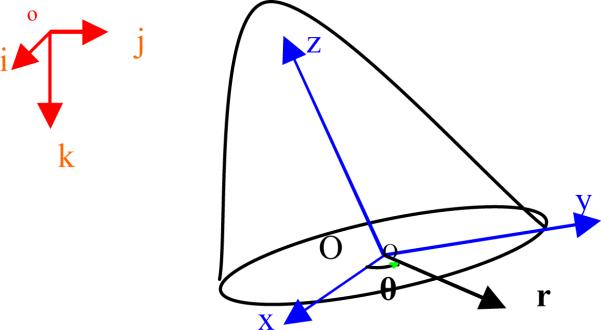
The three coordinate systems shown in Figure 3 are involved in the computational framework: pixel coordinates (i, j, k), Cartesian coordinates (x, y, z), and cylindrical coordinates (r, θ, z). The OF estimation was performed in pixel coordinates. For the computation of dynamic information, displacements in pixel coordinates were converted into Cartesian coordinates and centered inside the ventricular cavity so that the z-axis was aligned with the long axis of the left ventricle. This coordinate transform is performed via rigid transformation. The ventricular axis was defined as the axis connecting the center of the mitral orifice and the endocardial apex. Based on the Cartesian coordinate system, a corresponding cylindrical coordinate system was established with the r-θ plane corresponding to the x-y plane and with the x-axis used as the reference for θ.
Figure 3.
Coordinate systems for data acquisition and strain computation.
Besides displacement (ux,uy,uz) in Cartesian coordinates, we computed the following dynamic measurements:
Flow magnitude |u| (mm),
Radial displacement ur (mm),
Circumferential displacement uθ (mm),
Strain Tensor E = (∇u + ∇uT + ∇uT∇u)/ 2 , where the diagonal values of E encode thickening, circumferential strain, and longitudinal strain,
Twist ¶uq / ¶z and cardiac torsion.
Spatial displacement gradients were computed directly in pixel coordinates and converted into the cylindrical coordinate system via the chain rule. Derivatives in pixel coordinates were approximated by central difference operators.
2.3. Quantitative comparison of strains measures
Optical flow based method provided pixel-wise dense 4D (3D + time) strain measures within the myocardium. In order to fairly compare with the sonomicrometry results, the left ventricle was sub-divided into 40 to 72 segments (depending on the heart size and the size of the segment defined by the sonomicrometers). Only the displacement and strain values from the segments overlapping with the sonomicrometry crystals were used in the comparison. Given the potential discrepancy of the definition of the axial and circumferencial displacement directions between the two methods, only principal strain values were used for the comparison, being independent of axis orientations.
Since sonomicrometry data has a much higher temporal resolution (5 ms per frame) than optical flow data (about 40ms per frame), strain values from optical flow were interpolated with a cubic spline for intermediate time points. Correlation between the temporal profiles as well as absolute differences between sonomicrometry and optical flow measures were then computed.
3. RESULTS
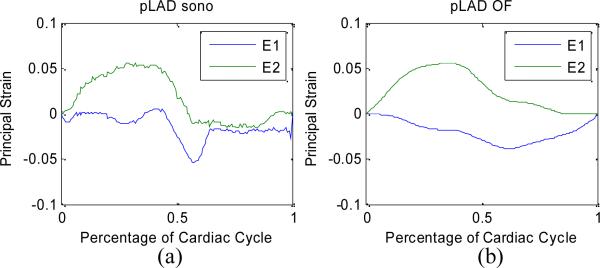
Examples of principal strain temporal profiles measured from sonomicrometry and corresponding with the optical flow tracking on 4D ultrasound are shown in Figure 4. Overall, results from both methods showed good agreement, regarding general trends as well as maximal and minimal values. However, due to the lower temporal resolution of the 4D ultrasound data, optical flow results missed some fast changing patterns, like the E1 strain value near the middle of the cardiac cycle, or the E2 strain value near the end of cardiac cycle.
Figure 4.
Temporal profiles of principal strains measures by sonomicrometry (a) and optical flow tracking on 4D ultrasound (b).
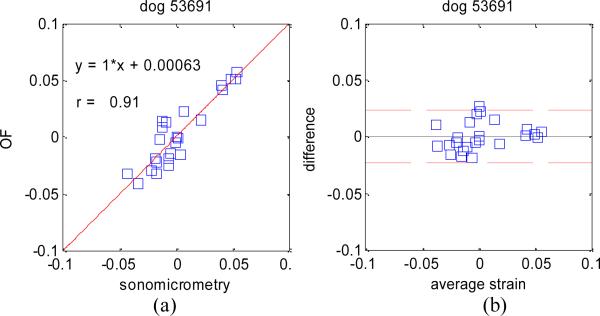
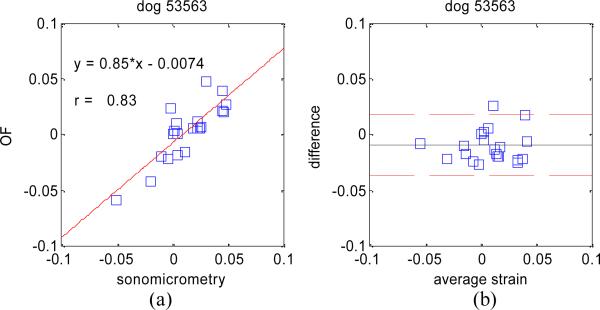
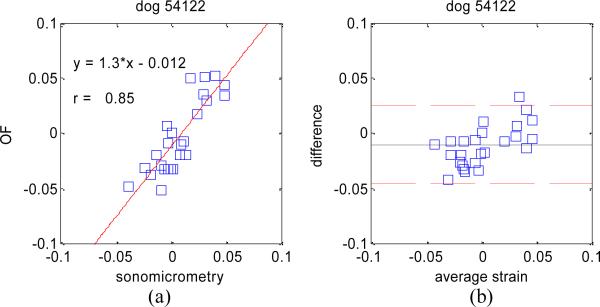
The absolute difference in estimating principal strain values on all three dog data sets was 1.8% with a standard deviation of 1.8%. Linear regression analyses as well as Bland-Altman plots for each dog experiment are shown in Figure 5, Figure 6, and Figure 7.
Figure 5.
Dog experiment #1: (a) Plot showing the relation between principal strains measured with sonomicrometry and optical flow. (B) Bland-Altman plot showing the mean difference (middle line) and the 95% limits of agreement (dashed lines).
Figure 6.
Same as Figure 5 for dog experiment #2.
Figure 7.
Same as Figure 5 for dog experiment # 3.
These results confirm the very high accuracy of our OF tracking method on 4D ultrasound data, and compare well, if not better, to similar studies comparing 2D speckle tracking to sonomicrometry [10] where linear regression analysis yielded y = 0.69*x – 0.024 and r = 0.79.
4. CONCLUSIONS
In this work, a 4D cardiac strain estimation method based on correlation optical flow for 4D ultrasound was quantitatively validated with comparison to sonomicrometry data. Preliminary results showed strong correlation of strain values derived from optical flow tracking with strains measured by sonomicrometry, used as the gold standard. This is the first study in the field that validates 4D image-based strain estimation for 4D ultrasound with a direct comparison to in-vivo sonomicrometry. Linear regression results yielded similar, if not better, results when compared to 2D speckle tracking. These results suggest that the proposed tracking computational framework is suitable for detecting regional ischemia with 4D ultrasound.
5. ACKNOWLEDGMENT
This work was partially funded by the American Heart Association grant #0640005N, National Institutes of Health (NIH) grant no. 1R01HL08516-01A2, and NIH/NHLBI 1R01HL086578-01A2.
REFERENCES
- 1.Lubinski MA, Emelianov SY, O'Donnell M. Speckle Tracking Methods for Ultrasonic Elasticity Imaging Using Short-Time Correlation. IEEE Transactions on Ultrasonics, Ferroelectrics, and Frequency Control. 1999;46:82–96. doi: 10.1109/58.741427. [DOI] [PubMed] [Google Scholar]
- 2.Kaluzynski K, Chen X, Emelianov SY, et al. Strain Rate Imaging Using Two-Dimensional Speckle Tracking. IEEE Transactions on Ultrasonics, Ferroelectrics, and Frequency Control. 2001;48 doi: 10.1109/58.935730. [DOI] [PubMed] [Google Scholar]
- 3.Meunier J. Tissue Motion Assessment From 3D Echographic Speckle Tracking. Physics in Medicine and biology. 1998;43:1241–1254. doi: 10.1088/0031-9155/43/5/014. [DOI] [PubMed] [Google Scholar]
- 4.Bohs LN, Geiman BJ, Anderson ME, et al. Speckle tracking for multi-dimensional flow estimation. Ultrasonics. 2000;38:369–375. doi: 10.1016/s0041-624x(99)00182-1. [DOI] [PubMed] [Google Scholar]
- 5.Ramm OTV, Smith SW. Real time volumetric ultrasound imaging system. Journal of Digital Imaging. 1990;3:261–266. doi: 10.1007/BF03168124. [DOI] [PubMed] [Google Scholar]
- 6.Duan Q, Angelini E, Gerard O, et al. Comparing optical-flow based methods for quantification of myocardial deformations on RT3D ultrasound. IEEE International Symposium on Biomedical Imaging (ISBI); 2006. pp. 173–176. [Google Scholar]
- 7.Duan Q, Angelini E, Herz SL, et al. Dynamic Cardiac Information From Optical Flow Using Four Dimensional Ultrasound. 27th Annual International Conference IEEE Engineering in Medicine and Biology Society (EMBS); Shanghai, China. 2005; [DOI] [PubMed] [Google Scholar]
- 8.Duan Q, Angelini ED, Herz SL, et al. Tracking of LV Endocardial Surface on Real-Time Three-Dimensional Ultrasound with Optical Flow. Third International Conference on Functional Imaging and Modeling of the Heart 2005; Barcelona, Spain. 2005; pp. 434–445. LNCS 3504. [Google Scholar]
- 9.Duan Q, Angelini ED, Herz SL, et al. Evaluation of optical flow algorithms for tracking endocardial surfaces on three-dimensional ultrasound data. SPIE Medical Imaging; San Diego, CA, USA. 2005; pp. 159–169. 5750 (Ultrasonic Imaging and Signal Processing) [Google Scholar]
- 10.Amundsen BH, Helle-Valle T, Edvardsen T, et al. Noninvasive myocardial strain measurement by speckle tracking echocardiography. Journal of the American College of Cardiology. 2006;47:789–793. doi: 10.1016/j.jacc.2005.10.040. [DOI] [PubMed] [Google Scholar]


