Abstract
Fluorescence light microscopy allows multicolor visualization of cellular components with high specificity, but its utility has until recently been constrained by the intrinsic limit of spatial resolution. We applied three-dimensional structured illumination microscopy (3D-SIM) to circumvent this limit and to study the mammalian nucleus. By simultaneously imaging chromatin, nuclear lamina, and the nuclear pore complex (NPC), we observed several features that escape detection by conventional microscopy. We could resolve single NPCs that colocalized with channels in the lamin network and peripheral heterochromatin. We could differentially localize distinct NPC components and detect double-layered invaginations of the nuclear envelope in prophase as previously seen only by electron microscopy. Multicolor 3D-SIM opens new and facile possibilities to analyze subcellular structures beyond the diffraction limit of the emitted light.
Light microscopy is a key technology in modern cell biology and, in combination with immunofluorescence, fluorescent protein fusions, or in situ hybridization, allows the specific localization of nearly all cellular components. A fundamental limitation of optical microscopy is its low resolution relative to the scale of subcellular structures. This limitation occurs because light traveling through a lens cannot be focused to a point but only to an Airy disk (1) with a diameter of about half the wavelength of the emitted light (2, 3). Because the wavelengths of visible light range from 400 to 700 nm, objects closer than 200 to 350 nm apart cannot be resolved but appear merged into one.
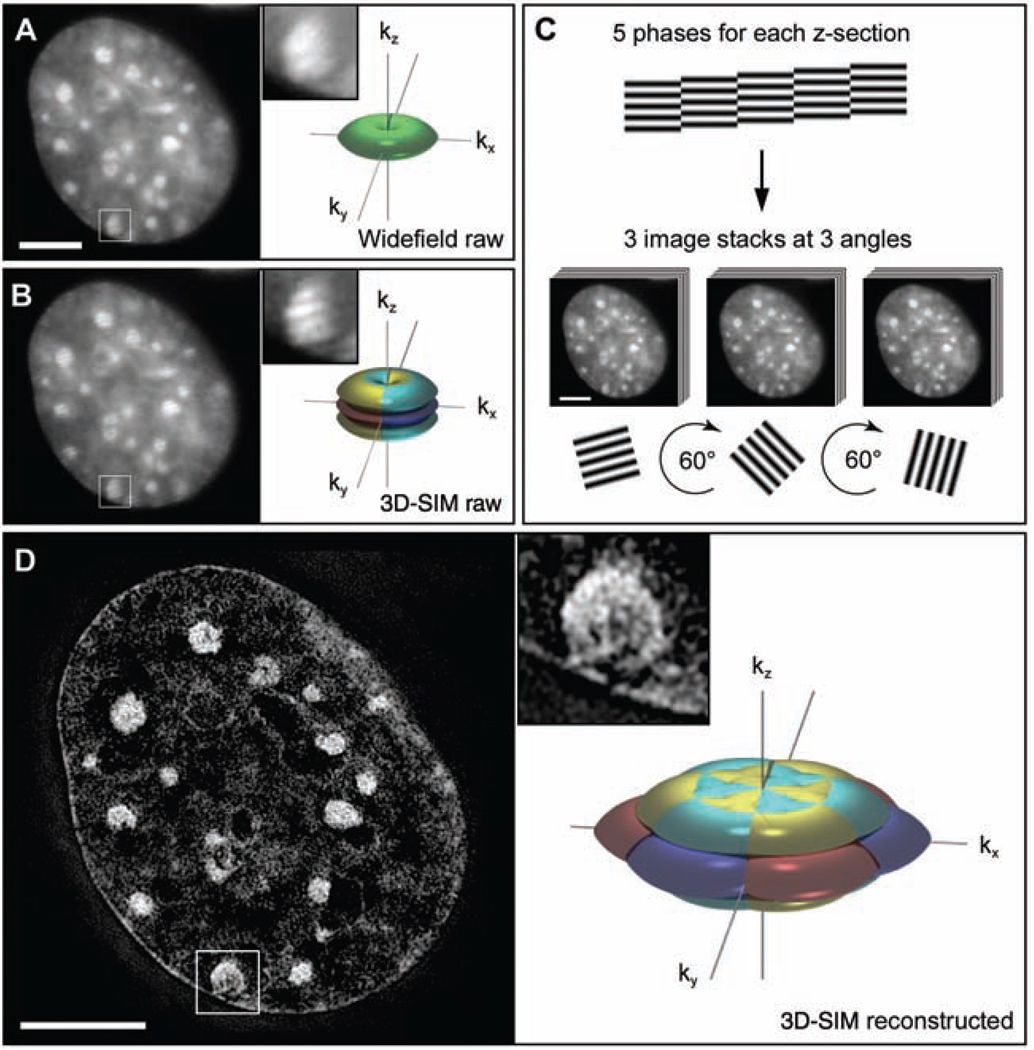
Improving resolution beyond the 200-nm diffraction limit while retaining the advantages of light microscopy and the specificity of molecular imaging has been a long-standing goal. Here, we present results demonstrating that this goal can be achieved with the use of a microscope system that implements three-dimensional structured illumination microscopy (3D-SIM) (4) in an easy-to-use system that makes no extra demands on experimental procedures. Structured illumination microscopy (SIM) resolves objects beyond the diffraction limit by illuminating with multiple interfering beams of light (5). The emitted light then contains higher-resolution image information, encoded by a shift in reciprocal (Fourier, or frequency) space into observable modulations of the image, in a manner similar to the formation of Moiré patterns (fig. S1). This extra information can be decoded to reconstruct fine details, resulting in an image with twice the resolution of a conventional image taken on the same microscope (Fig. 1 and fig. S2). The 3D-SIM method extends previous 2D SIM methods by using three beams of interfering light, which generate a pattern along the axial (z) direction as well as the lateral (x and y) directions. We implemented 3D-SIM in a custom-built microscope designed for ease of use so that slides prepared for conventional microscopes can be imaged without any further treatment, and operation of the microscope is similar to any modern commercial system. Although several subdiffraction-resolution optical microscopy methods have been developed in the past decade (6–8) and have been used to address specific biological questions (9, 10), they still present limitations, such as the restriction of the resolution enhancement to either the lateral or the axial direction or to the near or evanescent field, limited multicolor and 3D sectioning abilities, and the requirement of unusual dyes. 3D-SIM is currently the only subdiffraction-resolution imaging technique that allows detection of three (and potentially more) wavelengths in the same sample, using standard fluorescent dyes, with 3D optical sectioning and enhancement of resolution in both lateral (x and y) and axial (z) directions.
Fig. 1.
Subdiffraction resolution imaging with 3D-SIM. (A and B) Cross section through a DAPI-stained C2C12 cell nucleus acquired with conventional wide-field illumination (A) and with structured illumination (B), showing the striped interference pattern (inset). The renderings to the right illustrate the respective support of detection in frequency space. The axes kx, ky, and kz indicate spatial frequencies along the x, y, and z directions. The surfaces of the renderings represent the corresponding resolution limit. The depression of the frequency support (“missing cone”) in z direction in (A) indicates the restriction in axial resolution of conventional wide-field microscopy. With 3D-SIM, the axial support is extended but remains within the resolution limit. (C) Five phases of the sine wave pattern are recorded at each z position, allowing the shifted components to be separated and returned to their proper location in frequency space. Three image stacks are recorded with the diffraction grating sequentially rotated into three positions 60° apart, resulting in nearly rotationally symmetric support over a larger region of frequency space. (D) The same cross section of the reconstructed 3D-SIM image shows enhanced image details compared with the original image (insets). The increase in resolution is shown in frequency space on the right, with the coverage extending two times farther from the origin. Scale bars indicate 5 µm.
We used 3D-SIM to probe higher-order chromatin structure and the relative localization of nuclear pores, the nuclear lamina, and chromatin at the nuclear periphery in mammalian tissue culture cells (11). The vertebrate nuclear pore complex (NPC) is a ~120 MD protein complex (12) that mediates communication and selective exchange between the nucleoplasm and cytoplasm. The relation between chromatin, the NPC, and other components of the nuclear envelope, such as the nuclear lamina, has been extensively studied (13, 14). Electron microscopy (EM) has been instrumental in determining the fine structure of the NPC (12, 15–17), but it cannot provide a global 3D view of the entire nucleus with specific labeling of the molecular components. 3D-SIM can bridge this technology gap and shed light on the nuclear periphery.
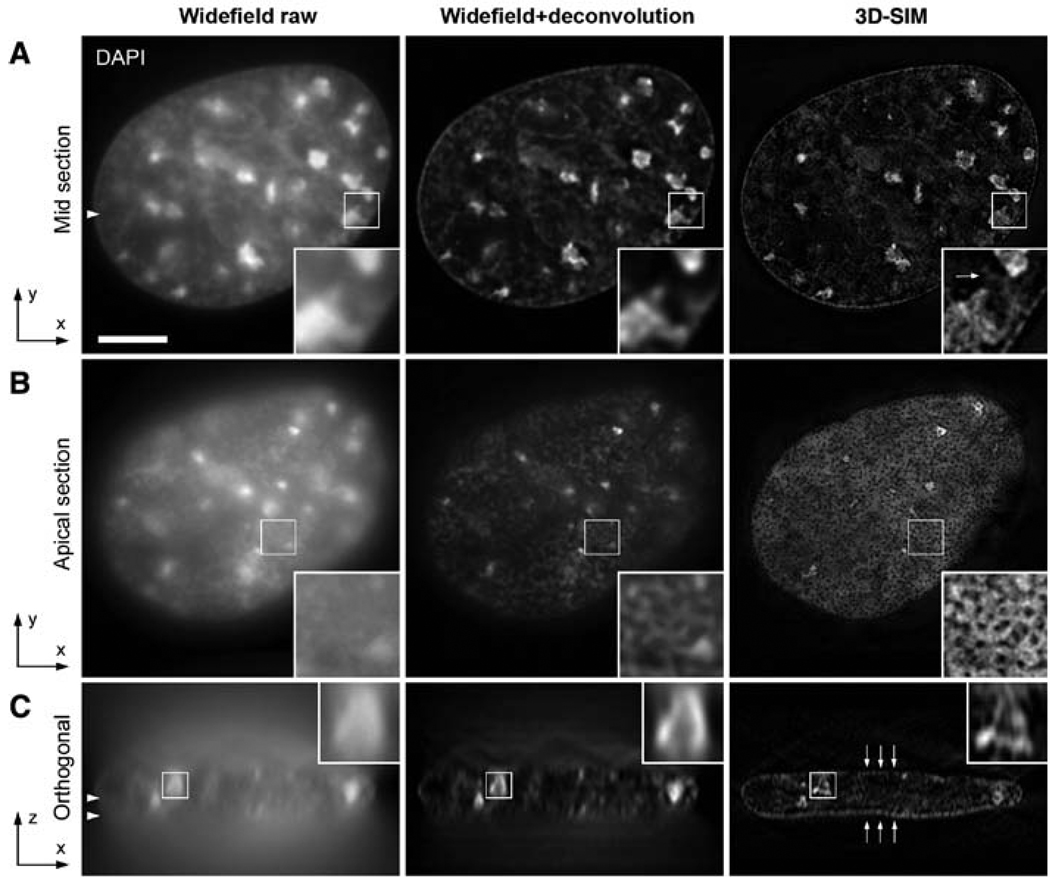
We first tested the ability of 3D-SIM to resolve the fine structure of interphase chromatin in three-dimensionally preserved formaldehyde-fixed mouse C2C12 myoblast cells stained with 4′,6-diamidino-2-phenylindole (DAPI). For comparison we recorded a reference image stack with conventional wide-field epifluorescence microscopy and applied constrained iterative deconvolution (18) to reduce out-of-focus blur (Fig. 2). In the 3D-SIM image, chromatin shows a more evidently fibrous substructure, and a brighter rim of heterochromatin staining is visible near the nuclear envelope as observed by EM. These chromatin-dense regions are surrounded by chromatin-poor regions, consistent with the interchromatin compartment observed by combined fluorescence and electron microscopic studies (19).
Fig. 2.
Comparison of wide-field imaging and 3D-SIM in resolving interphase chromatin fine structure. 3D image stacks of the same DAPI-stained C2C12 cell nucleus were recorded with conventional wide-field illumination (left) and with 3D-SIM (right). Deconvolution was applied to the wide-field data set (middle). Scale bar, 5 µm. Arrowheads indicate the position of the respective cutting planes. (A) Mid cross section shows brightly stained chromocenters of clustered (peri-)centromeric heterochromatin. (Insets) Higher-detail information of chromatin substructures when recorded with 3D-SIM. Arrow points to a less-bright chromatin structure that has been spuriously eroded by the deconvolution procedure. (B) Projection of four apical sections (corresponding to a thickness of 0.5 µm) taken from the surface of the nuclear envelope closest to the coverslip. Whereas the raw image shows diffuse DAPI staining, the deconvolved image shows more pronounced variations in fluorescence intensities. Image data with 3D-SIM extended-resolution information reveal a punctuated pattern of regions devoid of DAPI staining. (C) Orthogonal cross-section through the entire 3D image stack demonstrates the low sectioning capability of conventional wide-field microscopy, which cannot be mitigated solely by deconvolution. In contrast, clear layers of peripheral heterochromatin can be resolved with 3D-SIM (arrows).
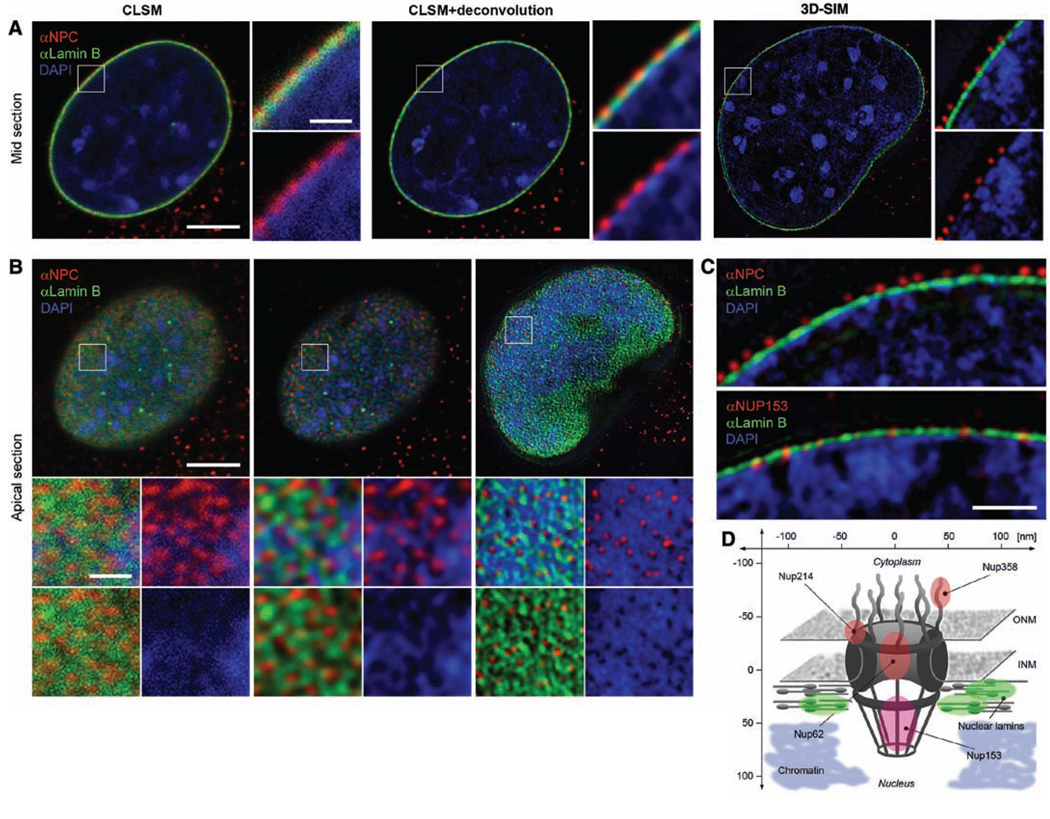
Unexpectedly, in 3D-SIM images of the nuclear periphery, we observed thousands of well-defined holes in DAPI staining, which could not be observed in the corresponding wide-field epifluorescence images (Fig. 2B). The size, number, and position of these holes suggested that they represented the exclusion of DNA from NPCs. To test this hypothesis and the potential of 3D-SIM for simultaneous multicolor 3D imaging of various nuclear structures, we co-immunostained these cells with NPC-specific antibodies and antibodies against lamin B. For comparison we recorded 3D image stacks of cells from the same sample with state-of-the-art confocal laser scanning microscopy (CLSM) and applied deconvolution (Fig. 3, A and B). The intermediate filament protein lamin B is a major component of the nuclear lamina that lines and stabilizes the nuclear envelope (20). The NPC antibodies used here (referred to as αNPC) are directed against the FG-repeat domain common to several nuclear pore proteins and mainly detect Nup62, Nup214, and Nup358, which are located in the center and at the cytoplasmic side of the NPC (21) with a minor signal from Nup153. In lateral cross sections of 3D-SIM image stacks, we consistently observed the peripheral heterochromatin rim outlined by a fine heterogeneous layer of the nuclear lamina and nuclear pore signals further above the lamina. This clear triple-layered organization was not resolvable with CLSM (Fig. 3A). For comparison, we also used a monoclonal antibody specific for Nup153, which is located on the nucleoplasmic side of the NPC (21) and obtained a pore signal in the same plane as the lamin B signal, demonstrating the potential of 3D-SIM to resolve subtle differences of epitope locations within the NPC (Fig. 3C). In apical cross sections, we found that NPC foci strictly localize within DAPI voids (Fig. 3B and movie S1). With very few exceptions, every DAPI void contained a focus of NPC staining and vice versa, suggesting that most if not all NPCs exclude chromatin from their immediate vicinity.
Fig. 3.
Simultaneous imaging of DNA, nuclear lamina, and NPC epitopes by 3D-SIM. C2C12 cells are immunostained with antibodies against lamin B (green) and antibodies that recognize different NPC epitopes (red). DNA is counterstained with DAPI (blue). (A) Central cross sections. (B) Projections of four apical sections (corresponding to a thickness of 0.5 µm). Boxed regions are shown below at 4× magnification; scale bars indicate 5 µm and 1 µm, respectively. (A) CLSM and deconvolution still show partially overlapping signals. In contrast, with 3D-SIM the spatial separation of NPC, lamina, and chromatin and chromatin-free channels underneath nuclear pores are clearly visible. (B) Top view on the nuclear envelope. Whereas CLSM fails to resolve close nuclear pores, 3D-SIM shows clearly separated NPC signals at voids of peripheral chromatin and surrounded by an irregular network of nuclear lamina. (C) Mid sections comparing stainings with an antibody that mainly reacts with Nup214, Nup358, and Nup62 (αNPC) and one specifically recognizing Nup153 (αNup153). The αNPC signal is above the lamina (140 ± 8 nm), whereas the αNup153 pore signal is at the same level as the lamina (−15 ± 20 nm). Scale bars 1 µm. (D) Schematic outline of the NPC, showing the relative position of Nup proteins and surrounding structures. ONM, outer nuclear membrane; INM, inner nuclear membrane.
We calculated the density of NPC foci in 3D-SIM and confocal images (Fig. 3 and fig. S3) by using automatic detection with identical criteria. The 3D-SIM image showed an average (±SD) of 5.6 ± 3.3 foci per µm2, whereas only 2.8 ± 1.1 foci per µm2 were detected in the confocal image. By comparison, 12 ± 1.8 NPCs per µm2 have been observed in mouse liver nuclei by freeze-fracture EM (22). Although the numbers cannot be directly compared because of cell type and cell cycle–dependent variations (23), they still indicate that 3D-SIM detects and resolves most NPCs and outperforms CLSM.
Although the discrete chromatin voids at NPCs are not visible in confocal or standard wide-field images, the intensity of DAPI staining should still show fluctuations that anticorrelate with NPC foci. We also reasoned that, even though the lamina does not show a striking one-to-one exclusion from NPCs under any of our methods, it should still be anticorrelated with the NPCs. To pursue these questions, we examined the average environment of an NPC focus in our images (fig. S4). Sub-images were cropped from the data set centered on the peak intensities of NPC foci, which were automatically detected in 3D. Intensity profiles through the center of each sub-image show a drop in intensity in DAPI staining, centered on the NPC focus, in all confocal and 3D-SIM images. A similar drop in intensity of the lamin signal is seen only in the case of 3D-SIM. In composites of the sub-images, a central hole can be seen in the DAPI channel. This indicates that the expected intensity fluctuations are present in all cases. The composite lamina image recorded by 3D-SIM also shows a hole, which was not detected by confocal microscopy. The width of the NPC signal was determined from intensity profiles by measuring the full width at half maximum. With CLSM this width was ~200 nm (192 ± 17 and 192 ± 11 nm before and after deconvolution, respectively), which essentially reflects the point spread function (PSF) of CLSM. In contrast, the measured width of NPC signal recorded with 3D-SIM was 120 ± 3 nm, which is in good agreement with EM measurements (15).
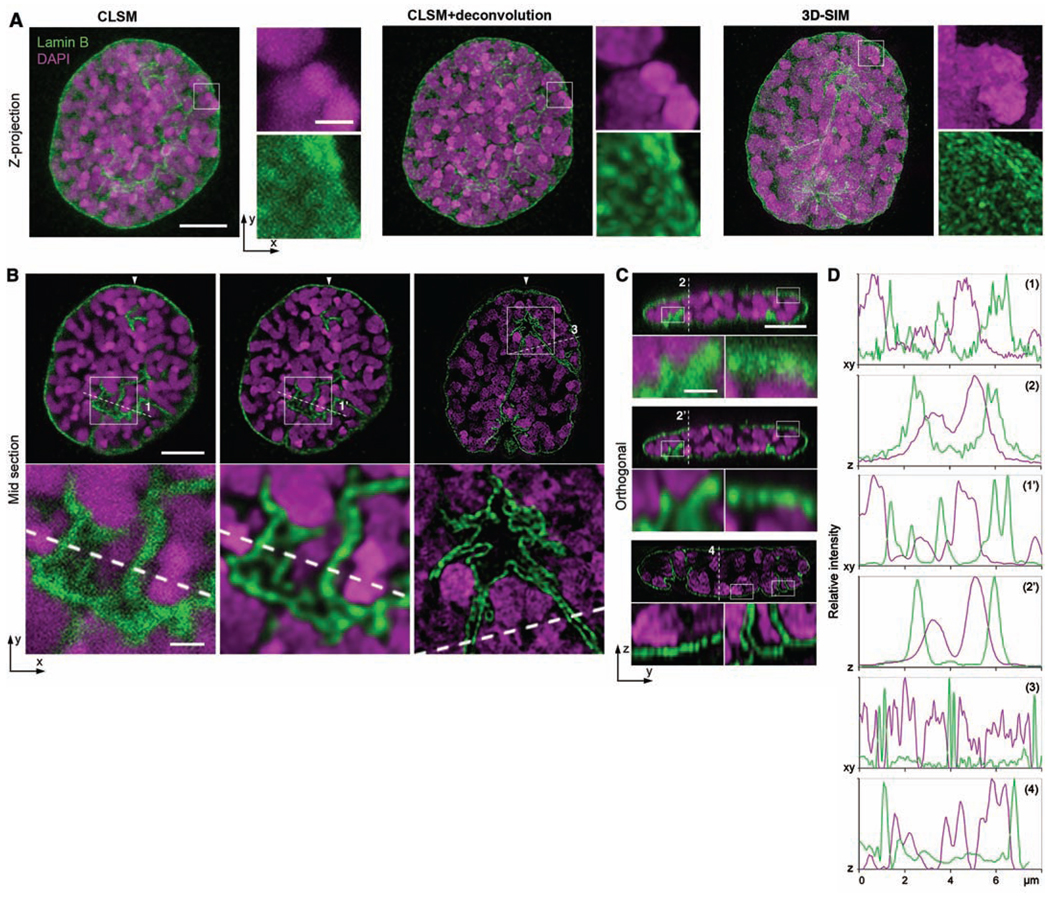
Many of the nuclei we imaged contained invaginations of the nuclear envelope that are especially prominent near the centrosome during prophase. These invaginations have been shown by EM studies to be tubular extensions of both nuclear envelopes (24), but because their width is generally smaller than the diffraction limit they appear as a single line by conventional microscopy. We investigated these nuclear invaginations in prophase nuclei by CLSM and 3D-SIM (Fig. 4) and could resolve the bilaminar structure of these invagination only with 3D-SIM (movie S2). This detailed substructure of nuclear invaginations has so far only been detected by transmission electron microscopy (TEM) (fig. S5). We also quantified the width of the lamin B signal in interphase nuclei in lateral and axial directions by fitting Gaussian curves to the measured intensities. Because the thickness of the lamina is in the range of 20 to 50 nm, the obtained values should reflect the resolution limit of either of the applied methods. With 3D-SIM we determined a width of threads in the lamin network with an upper limit of 98 ± 12 nm laterally and 299 ± 22 nm axially, whereas confocal images showed more than twofold higher values (243 ± 30 nm laterally and 736 ± 225 nm axially). Subsequent deconvolution of CLSM data/images did not improve the lateral (231 ± 28 nm) but did improve the axial (418 ± 26 nm) resolution, which is mostly due to an increased signal-to-noise ratio by removing out-of-focus blur and suppression of background (2). This 3D imaging of complex biological structures demonstrates about twofold enhanced resolution of 3D-SIM over conventional fluorescence imaging techniques in lateral and axial directions.
Fig. 4.
Invaginations of the nuclear envelope in mitotic prophase. C2C12 cells are immunostained with antibodies against lamin B (green), and the DNA is counterstained with DAPI (magenta). (A) Maximum intensity projections, (B) lateral, and (C) orthogonal cross sections. Scale bars, 5 µm. Inset boxes are shown below at 4× magnification (scale bars, 1 µm). 3D-SIM reveals the globular substructure of condensed chromosomes and the fine-structured fibrillar network of the nuclear lamina (movie S2). (D) Lateral and axial line profiles of dashed lines in (B) and (C), respectively. Whereas the lateral peak widths are only slightly decreased in the lateral direction (1 versus 1′), the axial profiles show clearly decreased peak widths after deconvolution, indicating a substantial improvement of axial resolution (2 versus 2′). With 3D-SIM, the peak widths of the lamin B signal are about halved with respect to the deconvolved confocal image in lateral and axial directions, and double peaks are resolved where only single peaks are seen in the confocal profiles. Similarly, DAPI staining shows multiple small peaks, which again reflects the increase of image details in 3D-SIM.
Many cellular structures and macromolecular complexes, including the nuclear envelope and its pores, fall just below the diffraction limit of conventional light microscopy, preventing quantitative analysis. In doubling the resolution of conventional microscopy in three dimensions, 3D-SIM was able to resolve individual nuclear pores, detect and measure the exclusion of chromatin and the nuclear lamina from nuclear pores, and accurately image invaginations of the nuclear envelope caused by the formation of the mitotic spindle. We have demonstrated both an increase in quantitative precision of measurement and the detection of novel cytological features, by imaging to a resolution approaching 100 nm. Although this level of resolution is less than that afforded by other techniques such as stimulated emission depletion (STED), photoactivated localization (PALM), or stochastic optical reconstruction (STORM) microscopy (25–29), 3D-SIM is currently the only subdiffraction-resolution imaging technique that can produce multicolor 3D images of whole cells with enhancement of resolution in both lateral and axial directions. Notably, these results were obtained with standard cytological methods, without the need for unconventional fluorescent dyes or coverslips, and on a microscope platform designed to be no more difficult to use than a conventional commercial microscope. The possibility of using 3D-SIM with well-established standard labeling techniques and to simultaneously locate different molecules or structures in the 3D cellular context opens interesting new perspectives for molecular cell biology.
Supplementary Material
Footnotes
Supporting Online Material
www.sciencemag.org/cgi/content/full/320/5881/1332/DC1
Materials and Methods
Figs. S1 to S6
References and Notes
Movies S1 and S2
References and Notes
- 1.Born M, Wolf E, editors. Principle of Optics. Cambridge: Cambridge Univ. Press; 1998. [Google Scholar]
- 2.Pawley JB, editor. Handbook of Biological Confocal Microscopy. ed. 3. New York: Springer; 2006. [Google Scholar]
- 3.Abbe E. Arch. Mikrosk. Anat. 1873;9:413. [Google Scholar]
- 4.Gustafsson MG, et al. Biophys. J. in press; published online 7 March 2008 (10.1529/biophysj.107.120345) [Google Scholar]
- 5.Gustafsson MG. J. Microsc. 2000;198:82. doi: 10.1046/j.1365-2818.2000.00710.x. [DOI] [PubMed] [Google Scholar]
- 6.Heintzmann R, Ficz G. Brief. Funct. Genomics Proteomics. 2006;5:289. doi: 10.1093/bfgp/ell036. [DOI] [PubMed] [Google Scholar]
- 7.Hell SW. Nat. Biotechnol. 2003;21:1347. doi: 10.1038/nbt895. [DOI] [PubMed] [Google Scholar]
- 8.Hell SW. Science. 2007;316:1153. doi: 10.1126/science.1137395. [DOI] [PubMed] [Google Scholar]
- 9.Kittel RJ, et al. Science. 2006;312:1051. doi: 10.1126/science.1126308. published online 13 April 2006 (10.1126/science.1126308) [DOI] [PubMed] [Google Scholar]
- 10.Willig KI, Rizzoli SO, Westphal V, Jahn R, Hell SW. Nature. 2006;440:935. doi: 10.1038/nature04592. [DOI] [PubMed] [Google Scholar]
- 11.Material and methods are available on Science Online.
- 12.Reichelt R, et al. J. Cell Biol. 1990;110:883. doi: 10.1083/jcb.110.4.883. [DOI] [PMC free article] [PubMed] [Google Scholar]
- 13.Burke B, Stewart CL. Nat. Rev. Mol. Cell Biol. 2002;3:575. doi: 10.1038/nrm879. [DOI] [PubMed] [Google Scholar]
- 14.Paddy MR, Belmont AS, Saumweber H, Agard DA, Sedat JW. Cell. 1990;62:89. doi: 10.1016/0092-8674(90)90243-8. [DOI] [PubMed] [Google Scholar]
- 15.Beck M, et al. Science. 2004;306:1387. doi: 10.1126/science.1104808. published online 28 October 2004 (10.1126/science.1104808) [DOI] [PubMed] [Google Scholar]
- 16.Beck M, Lucic V, Forster F, Baumeister W, Medalia O. Nature. 2007;449:611. doi: 10.1038/nature06170. [DOI] [PubMed] [Google Scholar]
- 17.Stoffler D, et al. J. Mol. Biol. 2003;328:119. doi: 10.1016/s0022-2836(03)00266-3. [DOI] [PubMed] [Google Scholar]
- 18.Agard DA, Hiraoka Y, Shaw P, Sedat JW. Methods Cell Biol. 1989;30:353. doi: 10.1016/s0091-679x(08)60986-3. [DOI] [PubMed] [Google Scholar]
- 19.Albiez H, et al. Chromosome Res. 2006;14:707. doi: 10.1007/s10577-006-1086-x. [DOI] [PubMed] [Google Scholar]
- 20.Gerace L, Blum A, Blobel G. J. Cell Biol. 1978;79:546. doi: 10.1083/jcb.79.2.546. [DOI] [PMC free article] [PubMed] [Google Scholar]
- 21.Fahrenkrog B, et al. J. Struct. Biol. 2002;140:254. doi: 10.1016/s1047-8477(02)00524-5. [DOI] [PubMed] [Google Scholar]
- 22.Tonini R, Grohovaz F, Laporta CA, Mazzanti M. FASEB J. 1999;13:1395. doi: 10.1096/fasebj.13.11.1395. [DOI] [PubMed] [Google Scholar]
- 23.Winey M, Yarar D, Giddings TH, Jr, Mastronarde DN. Mol. Biol. Cell. 1997;8:2119. doi: 10.1091/mbc.8.11.2119. [DOI] [PMC free article] [PubMed] [Google Scholar]
- 24.Fricker M, Hollinshead M, White N, Vaux D. J. Cell Biol. 1997;136:531. doi: 10.1083/jcb.136.3.531. [DOI] [PMC free article] [PubMed] [Google Scholar]
- 25.Bates M, Huang B, Dempsey GT, Zhuang X. Science. 2007;317:1749. doi: 10.1126/science.1146598. published online 15 August 2007 (10.1126/science.1146598) [DOI] [PMC free article] [PubMed] [Google Scholar]
- 26.Betzig E, et al. Science. 2006;313:1642. doi: 10.1126/science.1127344. published online 9 August 2006 (10.1126/science.1127344) [DOI] [PubMed] [Google Scholar]
- 27.Donnert G, et al. Proc. Natl. Acad. Sci. U.S.A. 2006;103:11440. doi: 10.1073/pnas.0604965103. [DOI] [PMC free article] [PubMed] [Google Scholar]
- 28.Huang B, Wang W, Bates M, Zhuang X. Science. 2008;319:810. doi: 10.1126/science.1153529. published online 2 January 2008 (10.1126/science.1153529) [DOI] [PMC free article] [PubMed] [Google Scholar]
- 29.Rust MJ, Bates M, Zhuang X. Nat. Methods. 2006;3:793. doi: 10.1038/nmeth929. [DOI] [PMC free article] [PubMed] [Google Scholar]
- 30.This work was supported by grants from the Bavaria California Technology Center, the Center for NanoScience, the Nanosystems Initiative Munich, and the Deutsche Forschungsgemeinschaft to L. Schermelleh, M.C.C., and H.L.; by NIH grant GM-2501–25 to J.W.S.; by the David and Lucile Packard Foundation; and by NSF through the Center for Biophotonics, an NSF Science and Technology Center managed by the University of California, Davis, under cooperative agreement no. PHY 0120999. P.M.C. is partially supported by the Keck Laboratory for Advanced Microscopy at the University of California, San Francisco. We thank A. Čopïč, K. Weis, and F. Spada for comments on the manuscript and helpful discussions. P.M.C., L. Shao, L.W., and P.K. have performed limited paid consulting for Applied Precision, which is planning a commercial microscope system using three-dimensional structured illumination. The University of California holds patents for structured illumination microscopy.
Associated Data
This section collects any data citations, data availability statements, or supplementary materials included in this article.


