Abstract
Motivation: Transmembrane β-barrels (TMBBs) belong to a special structural class of proteins predominately found in the outer membranes of Gram-negative bacteria, mitochondria and chloroplasts. TMBBs are surface-exposed proteins that perform a variety of functions ranging from nutrient acquisition to osmotic regulation. These properties suggest that TMBBs have great potential for use in vaccine or drug therapy development. However, membrane proteins, such as TMBBs, are notoriously difficult to identify and characterize using traditional experimental approaches and current prediction methods are still unreliable.
Results: A prediction method based on the physicochemical properties of experimentally characterized TMBB structures was developed to predict TMBB-encoding genes from genomic databases. The Freeman–Wimley prediction algorithm developed in this study has an accuracy of 99% and MCC of 0.748 when using the most efficient prediction criteria, which is better than any previously published algorithm.
Availability: The MS Windows-compatible application is available for download at http://www.tulane.edu/∼biochem/WW/apps.html
Contact: wwimley@tulane.edu
Supplementary information: Supplementary data are available at Bioinformatics online.
1 INTRODUCTION
The transmembrane β-barrel (TMBB) is one of two major structural classes of membrane-spanning proteins; TM helical bundles are the other. TMBBs are found in the outer membranes of Gram-negative bacteria, mitochondria and chloroplasts, while TM helical bundles are found in the cytoplasmic membranes of all living organisms. Although genes that encode TMBBs are estimated to represent at least 3% of all protein-coding genes in Gram-negative bacteria, TMBBs represent only 1% of the solved protein structures from Gram-negative organisms. As a rapidly expanding number of genomic sequences become available, using in silico methods to identify previously unknown TMBBs is an appealing alternative to more difficult and time-consuming experimental methods such as crystallography. Computational TMBB prediction methods can identify candidate genes in order to perform experimental validation or structural proteomics on a more focused population. These methods also provide the opportunity to identify and characterize TMBBs that may not be expressed under standard culturing conditions and thus, would go unobserved using traditional screening methods such as proteomic analysis.
Computational prediction methods have been used to predict TM helices with an accuracy of 99% for nearly a decade. TM helices are simple stretches of 19–25 hydrophobic residues, which can be predicted with near-perfect accuracy using experimentally determined hydrophobicity scales; an example of such a program is MPEX (Jayasinghe et al., 2001; Snider et al., 2009). However, the prediction of TMBBs presents a more difficult challenge due to the cryptic nature of the TMBB structure (Wimley, 2002). The TMBB structure is a series of anti-parallel β-strands that are arranged in a cylindrical geometry forming a structure that resembles a barrel (Schulz, 2000). The TM β-strands of TMBBs consist of ∼10 amino acids arranged in an alternating, dyad repeat pattern of hydrophobic and hydrophilic residues, where the hydrophobic side-chains face the lipid environment and the hydrophilic side-chains face the interior of the β-barrel. The β-hairpin, which is the major structural unit of the TMBB, is a pair of anti-parallel TM β-strands connected by a short loop of 3–7 residues (i.e., hairpin turn). The β-hairpins are connected to each other by loops of varying length. The complexities and irregularities in the structure including the variations in loop length and composition, deviations from the pattern of hydrophobicity in some β-strands, and the low information content (e.g., only five hydrophobic residues in a TM strand) make the identification of TMBBs especially problematic (Wimley, 2003).
There are a wide variety of TMBB prediction algorithms that utilize machine learning methods ranging from Bayesian networks to k-nearest neighbor methods. Machine learning methods are designed to identify the common features of the TMBBs in a training dataset as well as features that distinguish TMBBs from other types of proteins. The distinguishing variables, as interpreted by the algorithm, are used as rules to classify a test sequence (Gromiha and Suwa, 2006). Although these methods can yield reasonable TMBB prediction accuracies (64–97%), their predictions are still less reliable than those made for TM helical bundles (Gromiha and Suwa, 2006; Hu and Yan, 2008). Besides achieving less than ideal prediction accuracy, a major disadvantage of using a machine learning method is that it cannot be used for hypothesis testing because the variables used to make the predictions are either hidden or arbitrary, thus there is no discernable link between the variables and the physicochemical properties of the experimentally solved TMBB structures.
A TMBB prediction algorithm based on the physicochemical properties of TMBBs was developed in this lab (Wimley, 2002). This algorithm is based on an analysis of the structure and composition of known TMBBs. The algorithm identifies the positions of TM β-strands using a simple pattern-recognition scheme, which utilizes the statistical amino acid abundance data derived from known structures. The observed amino acid abundances from the TM β-strands are compared to the expected genomic abundance, and the difference between the two abundances yields information about patterns and composition unique to the TM segments of TMBBs. The algorithm uses the resulting abundance values to identify 10-residue-long β-strands with dyad repeat patterns. Next, adjacent β-strands are scored for β-hairpin-forming potential, and the β-hairpin score data is used in a function to give a protein sequence a single β-barrel score. The β-barrel score is a rating of the overall propensity of the sequence to fold into a TMBB.
The initial goal of this work was to rigorously evaluate the performance of this algorithm since it was intended to make predictions for genomic sequences, which will be listed in an annotated database. The performance of the original algorithm was evaluated using a non-redundant protein database (NRPDB) with 14 238 proteins of known structure from the Protein Data Bank (PDB; Berman et al., 2000). Each sequence was given a β-barrel score, which was used as a threshold-dependent binomial classifier to identify each sequence as either a TMBB or non-TMBB. Using the NRPDB as a stringent test set, the performances of the original prediction algorithm, as well as other prediction algorithms, were unsatisfactory because they had very large rates of false positive predictions.
The algorithm described in this work was developed to address the specific weaknesses in the ability of the original algorithm to discriminate against non-TMBBs. The modified algorithm, which we call the Freeman–Wimley algorithm, showed a substantial improvement, from 87% to 99% when analyzing the NRPDB. The accuracy of the Freeman–Wimley algorithm is comparable to the accuracy of TM helix prediction and exceeds the accuracy of other TMBB prediction methods. Furthermore, an analysis of the Escherichia coli genome has revealed that the Freeman–Wimley algorithm is more efficient at distinguishing TMBBs from non-TMBBs in genomic databases compared to the NRPDB. This work represents significant progress in the computational identification of genomic TMBB sequences.
2 METHODS
2.1 Database construction
An NRPDB was constructed from the seqres text file available on the ftp site of the PDB (ftp://snapshots.rcsb.org/20080107/pub/pdb/derived_data/). The corresponding 50% clustering file (ftp://snapshots.rcsb.org/20080107/pub/pdb/derived_data/NR/) was used to select a set of protein sequences that were 50% or less identical to all other proteins. The database was further refined by the exclusion of proteins outside the chain length constraints of the prediction algorithm, i.e. between 60 and 4000 residues long, limiting the total number of members in the database to 14 238.
2.2 TMBB structural analysis and amino acid abundance values
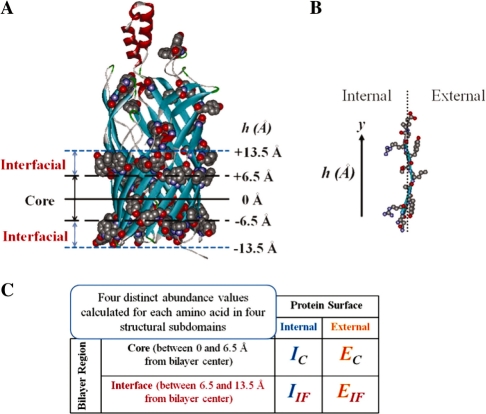
A total of 22 non-redundant (≤40% identical) TMBBs were analyzed for structural bioinformatic data (listed in Supplementary Table S1) as was previously done by Wimley (2002). Briefly, transformation of PDB coordinates to a bilayer plane was performed essentially as done by Wimley except the software used was the Accelerys DS Viewer available as a free download. The hydrophobicity profile used to center the TM section of each TMBB was performed by calculating the average hydrophobicity of the external residues using the Wimley–White hydrophobicity scale (White and Wimley, 1998). The average hydrophobicity within a 5-Å sliding window was calculated along the Y-axis using the structural Y-coordinates of the β-carbons (except for glycine where the α-carbon was used). The midpoint of the hydrophobic surface was used to transform the XYZ coordinates of a structure to a bilayer plane centered at 0 Å; the distance of the residues from that center was used to determine if they were located in the core region (0–6.5 Å) or in the interfacial region (>6.5–13.5 Å) (see Fig. 1). The resulting raw abundance values were normalized by comparison to the expected genome-wide abundance values (Supplementary Table S2). The abundances determined in this analysis were averaged with those generated by Wimley, weighting each group by the respective number of amino acids that contributed to the value calculation.
Fig. 1.
Analysis of TMBB structures. (A) The 3D coordinates of the structures were transformed to a bilayer plane as described in methods. The aromatic residues, shown in space-filling modeling, were used among other cues to identify the TM domain. (B) The internal- and external-facing residues were identified in each TM strand along with the respective distance from the bilayer mid-plane. (C) The abundance values of all 20 natural amino acids were calculated in 4 structural subdomains.
2.3 TMBB prediction algorithm
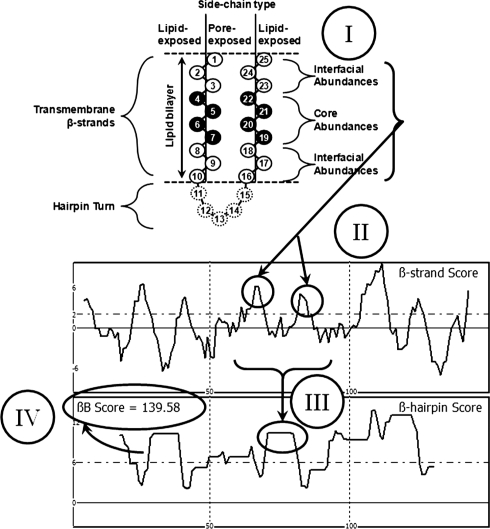
The TMBB prediction algorithm used was based on the method previously published by this lab (Wimley, 2002) with some modifications. Sequences shorter than 60 and longer than 4000 residues were excluded; these limits were set because sequences with fewer than 60 residues most likely cannot fold into TMBBs, which must have at least eight β-strands, and sequences longer than 4000 residues are uncommon and unlikely to be TMBBs (all of the known TMBBs are shorter than 1000 residues). Sequences were assigned abundance values (Fig. 1) in an alternating (dyad repeat) pattern of internal/external and external/internal using the core and interfacial values for the respective surfaces resulting in two separate abundance assignments (see Fig. 2 and Supplementary Fig. S1). The β-strand scores were calculated with a 10-residue-long sliding window that steps through the sequence one position at a time. Within the sliding window, the three anterior and posterior residues were assigned interfacial abundances while the four middle positions were assigned core abundances. This differs from the original algorithm that used an average of the core and interfacial values known as the whole or average bilayer value. The values within the two windows were summed and the greater sum was taken as the β-strand score of the median residue in the window, i.e. the 5.5th residue in the window. Next, the β-strand score was analyzed for β-hairpins using two 10-residue sliding windows separated by 5 fixed residues, which represents the hairpin turn. The maximum β-strand score was identified in each 10-residue window, stepping through one value in the data at a time. The β-hairpin score for the median residue in the window is the sum of the maxima in each 10-residue window. The β-barrel score is calculated as the sum of all β-hairpin score points whose value is greater than six divided by the natural log of the length of the sequence. The original algorithm used just the length of the sequence as the divisor; however, the natural log of the length is more appropriate as discussed in the results and discussion.
Fig. 2.
Sequence analysis by the Freeman–Wimley algorithm. The schematic shows the typical amino acid side-chain orientations in a TM β-hairpin, where half of the membrane-spanning side-chains are lipid-exposed (external) and the other half face the pore (internal). The sequence analysis is performed as follows: (i) the amino acid abundances are assigned to each residue within a 10-residue sliding window, with the terminal residues assigned as bilayer interfacial residues, and the remainder as bilayer core residues; (ii) the sum within the window is taken as the β-strand score for the median residue, thus peaks indicate the middle of predicted β-strands; (iii) a 25-residue sliding window analysis of the β-strand score is used to identify β-hairpins, where two β-strand peaks are separated by a five-residue gap (representing the hairpin turn); and (iv) the topology prediction shown in the β-hairpin score is simplified to a single value called the β-barrel score as described in methods and Supplementary Figure S1.
2.4 Definitions and equations for algorithm performance
True positive (TP) prediction—a TMBB whose β-barrel score is at least equal to the test threshold
True negative (TN) prediction—a non-TMBB whose β-barrel score is less than the test threshold
False positive (FP) prediction—a non-TMBB whose β-barrel score is at least equal to the test threshold
False negative (FN) prediction—a TMBB whose β-barrel score is less than the test threshold
- Sensitivity—proportion of TMBBs positively identified by test out of known TMBBs in the dataset

- Specificity—proportion of non-TMBBs eliminated by test out of know non-TMBBs in the dataset

- Positive predictive value (PPV)—a number from 0 to 1 that indicates the likelihood that a positive prediction is correct, 1 being most likely

- Accuracy—all correct positive and negative predictions out of the whole dataset

- Matthews correlation coefficient (MCC)—a metric of overall efficiency of a prediction algorithm ranging from 0 to 1 (Matthews, 1975). An MCC of 0 means the predictions are completely random and 1 means the predictions are perfect.

2.5 Randomized sequence analysis
It was observed that many of the false positive predictions (i.e. non-TMBBs with high β-barrel scores) had a considerable abundance of amino acids that are typically more abundant in TMBBs, such as Tyr, which could lead to an artificially high β-barrel score. In an extreme example, a 100-residue-long sequence consisting only of Tyr residues receives a β-barrel score near 300, which is exceptionally high and would always be predicted to be a β-barrel. This observation led to the hypothesis that a gene whose composition is rich in high-scoring amino acids would receive a similarly high β-barrel score using either the native sequence or a randomized one. Therefore, a method was developed to test this hypothesis for TMBBs and non-TMBBs. Each protein sequence was randomly scrambled 1000 times and each scrambled version was analyzed using the Freeman–Wimley algorithm. All of the scores were averaged to obtain the mean randomized score (MRS). The MRS and SD (σ) were compared to the β-barrel score of the native sequence for statistical significance. A probability of 5% or less was considered to be significant thus, the β-barrel score for a protein must be at least 1.96 * σ greater than the MRS in order to pass the test.
2.6 Programming
All of the prediction and analysis programs used to perform this work were written in Delphi, which is an object-oriented version of the Pascal programming language. The programs were written and compiled using the freely available Turbo Delphi 2006 from Borland/Codegear and are provided at http://www.tulane.edu/∼biochem/WW/apps.html.
3 RESULTS
3.1 NRPDB construction and testing
An NRPDB with a 50% similarity cutoff was constructed to test the prediction accuracy of the TMBB prediction algorithm developed in this lab (Wimley, 2002). The prediction accuracy was tested because this algorithm was developed to predict TMBBs in the genomes of Gram-negative bacteria and it was imperative to validate the accuracy of such predictions. Protein sequences were obtained from the PDB website, www.pdb.org, thus each structure was known for each sequence. The number of sequences in the database totaled 14 238, where there were 48 true TMBBs and 14 190 non-TMBBs covering the full range of protein fold classes, including all β, all α, α/β and α + β supersecondary structures. This dataset is a stringent test case for estimating how well the TMBB prediction algorithm would perform against a genomic database whose sequences fold into a wide variety of supersecondary structures.
To test the performance of the original TMBB prediction algorithm, each sequence in the NRPDB was given a β-barrel score. The β-barrel score was used to rank predictions (i.e., greater β-barrel scores indicate stronger positive predictions) where positive predictions were determined by a prediction threshold of 0.41, which selected 46 of 48 known TMBBs. The two highest-scoring TMBBs were OmpX (1orm; β-barrel score = 4.98) and OmpA (1bxw; β-barrel score = 4.49) (Fernandez et al., 2001; Pautsch and Schulz, 1998). The selected threshold also positively predicted 1824 non-TMBB sequences (false positives). A closer inspection of the false positive predictions revealed that the two highest scoring proteins were endo-β-1,4-glucanase (1h8v; β-barrel score = 5.13) and xylanase D (1bcx; β-barrel score = 5.08) (Sandgren et al., 2001; Wakarchuk et al., 1994). Although the original TMBB prediction algorithm accurately identified known TMBBs, the rate of false positive predictions was unacceptably high.
3.2 Algorithm modifications
The major reasons for the high rate of false positive predictions were investigated in order to make the algorithm more accurate, thus improving the efficacy of the algorithm as a tool for identifying genomic TMBBs. There were three major modifications to the algorithm that were prompted by the initial screening of the NRPDB: (i) the amino acid abundance values were updated to include the latest structural information; (ii) the β-strand prediction algorithm was modified to increase specificity for the recognition of TM β-strands; and (iii) an adjustment was made to the β-barrel score calculation to eliminate an intrinsic bias for shorter sequences.
3.2.1 Updated abundance values
The abundance values used to identify β-strands, which subsequently lead to the β-barrel scores used to rank TMBB predictions, were updated with the most recent structural information. The original abundance values used in the prediction algorithm were derived from the analysis of only 15 unique TMBB structures (Wimley, 2002). Over 20 new, unique structures have been solved since then, thus the amount of data from which amino acid abundances could be derived was increased more than 2-fold. Only TMBB structures with sequences that were <40% identical to any other sequences in the PDB were analyzed (see Supplementary Table S1) using the structural analysis method of Wimley (see Fig. 1). This analysis produced four raw abundance values for each natural amino acid, with the exception of cysteine, which was absent from all TM regions. The observed raw abundances were converted to relative abundances, which is a comparison of observed and expected abundances, and then were combined with Wimley's relative abundance values as weighted averages (see Supplementary Table S2). The updated relative abundances were derived from a total of 4667 amino acids from 37 protein structures.
3.2.2 β-strand prediction modification
The TMBB prediction algorithm was modified to utilize all of the available abundance information more comprehensively. The whole bilayer abundances, which are averages of the interfacial and hydrophobic core abundances for each residue, were used in the original prediction algorithm. However, some residues are distinctly more abundant in one subdomain than the other on a given surface. For example, leucine is nearly twice as abundant in the hydrophobic core as it is in the interface of the external surface; tyrosine is nearly twice as abundant in the interface as it is in the core of the external surface; and tryptophan is nearly five times more abundant in the interface than in the hydrophobic core of the external surface. Instead of assigning the average bilayer abundance to each residue in the window as was done previously, the interfacial abundances (internal or external) are assigned to the first and last three residues in the window, and core abundances (internal or external) are assigned to the four middle residues in the window. The new abundance value assignment method was termed the core-interfacial specific abundance assignment (CISA).
3.2.3 Modification of the β-barrel score calculation
The β-barrel score calculation was modified to address an intrinsic bias for short sequences found in the NRPDB. The structures of TMBBs were inspected to gain insight as to why shorter sequences had a tendency to receive greater β-barrel scores than longer sequences (Fig. 3). The available structures showed that larger TMBBs often have substantial percentages of the protein structure dedicated to non-TMBB domains or subdomains, unlike the smaller TMBBs such as OmpX and OmpT (Vandeputte-Rutten et al., 2001; Vogt and Schulz, 1999). Many of the larger TMBBs, such as the dimeric PapC and BtuB, have a large N-terminal plug domain that occludes the lumen of the pore, and/or extensive protein–protein interaction domains that account for nearly a quarter of the sequence (Chimento et al., 2003; Remaut et al., 2008). The non-TM domains effectively dilute the β-hairpin density, which is reflected in the β-barrel score. It was observed that smaller proteins with only modest β-hairpin scores received exceedingly high β-barrel scores, leading to false positive predictions. It is apparent that β-hairpin density is relatively reduced in longer sequences, thus various modulations of the length were tested, such as truncating sequences longer than 500 residues and mathematically modifying the length (e.g. calculating the square root, cubed root, natural log, etc.). Taking the natural logarithm of the length outperformed all of the other models (data not shown) and was, therefore, used in the improved algorithm.
Fig. 3.
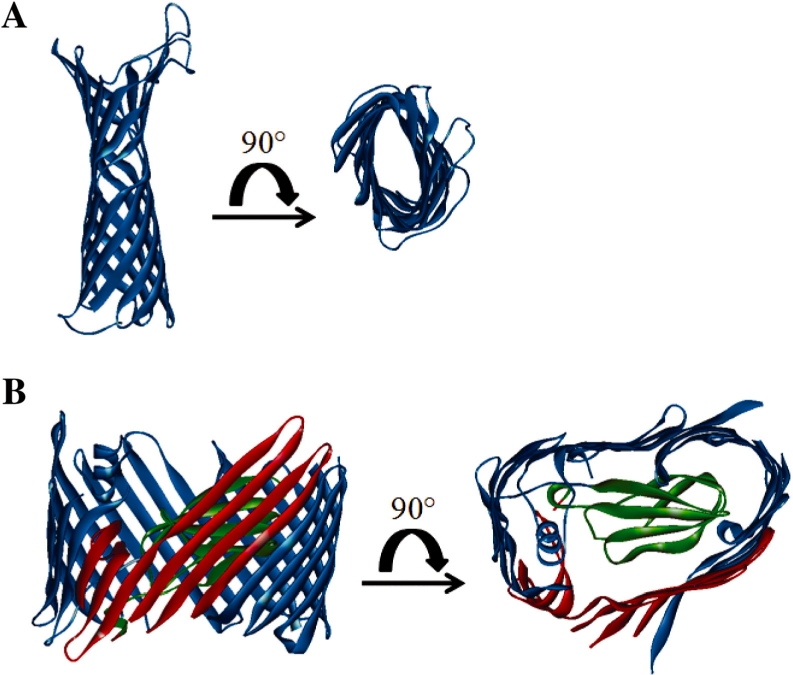
Structural differences between large and small TMBBs. Here is an example of the additional structural features often found in the larger known TMBBs, which are absent in their smaller counterparts. The protein subdomains that are not in contact with the bilayer tend to receive lower β-hairpin scores, thus lowering the overall β-barrel score when calculated by the original scoring method. The surfaces that contact the bilayer are shown in blue; the protein–protein interaction domains are shown in red; the ‘plug’ domain, which occludes the lumen of the pore is shown in green. (A) Structure of Protease VII/OmpT (1i78; Vandeputte-Rutten et al., 2001). (B) Structure of pilin usher protein PapC (2vqi; Remaut et al., 2008).
3.2.4 Evaluation of algorithm modifications
The sequences of the NRPDB were analyzed with each of the aforementioned algorithm modifications and given a new β-barrel score, which effectively distinguishes TMBBs from non-TMBBs (Supplementary Fig. S2).
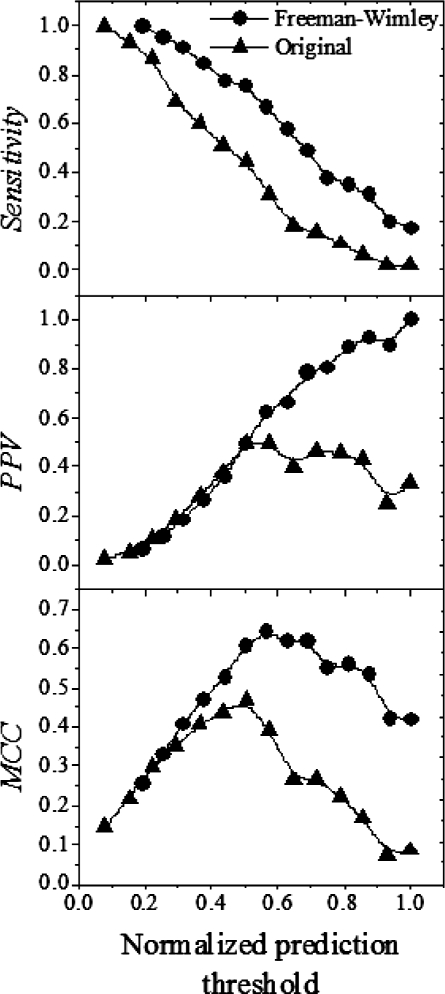
A set of testing parameters were established in order to compare the effects of the various algorithm modifications on TMBB prediction performance (see Table 1). The prediction threshold, which is the minimum β-barrel score to be considered a positive prediction, was chosen for each modification so that 46 of 48 true TMBBs were considered positive predictions. The updated abundances resulted in a 2-fold reduction in the number of false positive predictions. The CISA β-strand prediction made a modest 3% decrease in the number of false positives. The modified β-barrel score calculation yielded the most substantial improvement with a nearly 3-fold reduction in the number of false positives. When all of these modifications were combined into a single algorithm (the Freeman–Wimley algorithm) the reduction in false positives was more than 3-fold. This vast improvement is attributable to improved statistics for abundance values, which allowed the CISA assignment to have a greater impact, and the alternate β-barrel score calculation. A more in-depth comparison between the original algorithm and the Freeman–Wimley algorithm is shown in Figure 4. The sensitivity, PPV and MCC are compared between both algorithms over a range of prediction thresholds. The rate of decrease in sensitivity is similar in both algorithms as the prediction threshold is increased. However, the PPV and MCC changes reveal that the Freeman–Wimley algorithm is superior at eliminating false positives, a capability that improves greatly as the threshold becomes higher.
Table 1.
Algorithm improvements
| Algorithma | TPb | FPc | TNd | FNe |
|---|---|---|---|---|
| Original | 46 | 1823 | 12 367 | 2 |
| Updated abundance values | 46 | 895 | 13 295 | 2 |
| Core/interfacial-specific (CISA) β-strand prediction | 46 | 1772 | 12 418 | 2 |
| Modified β-Barrel Score | 46 | 625 | 13 565 | 2 |
| All modifications combined (Freeman-Wimley algorithm) | 46 | 599 | 13 591 | 2 |
| Freeman-Wimley algorithm with MRS Screen | 37 | 161 | 14 029 | 11 |
aDescribes which version of the algorithm was used to make predictions in the NRPDB (Non-redundant PDB).
bTrue Positive predictions (correctly identified TMBBs).
cFalse Positive predictions (incorrectly identified non-TMBBs).
dTrue Negative predictions (correctly excluded non-TMBBs).
eFalse Negative predictions (incorrectly excluded TMBBs).
Fig. 4.
Comparison of prediction efficiency. The original algorithm (triangles) was compared to the Freeman–Wimley algorithm (circles) using three measures of performance: sensitivity, PPV and MCC.
3.3 Randomized sequence analysis
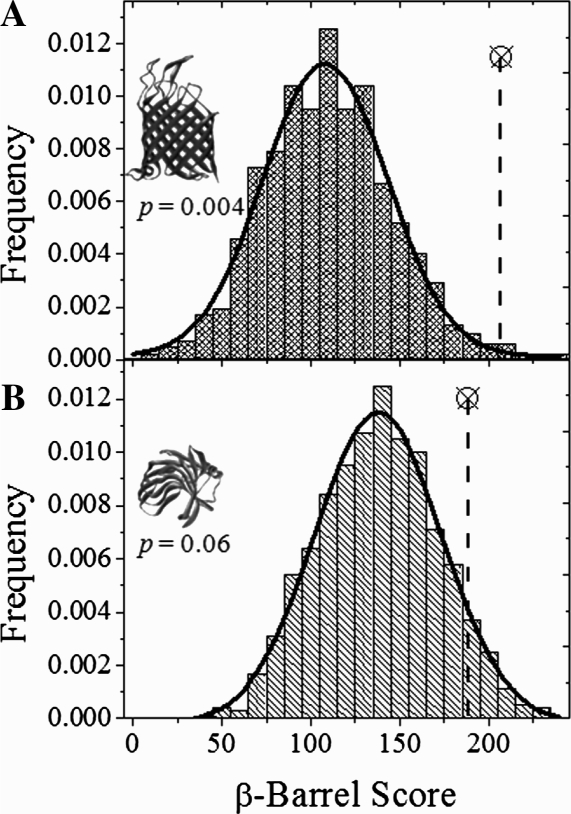
The structures of some of the higher-scoring false positives were examined to better understand why their β-barrel scores were similar to known TMBBs. A review of the false positive structures revealed that they were β-sheet-rich with a varied number of anti-parallel β-strands similar in length to known TMBBs. Besides the observed structural similarities, some non-TMBBs have amino acid compositions, which are rich in favorable amino acids such as Tyr, thus the β-barrel score for such a sequence could be inflated because of composition. To test whether sequence or composition played a more prominent role in determining the β-barrel score, a randomized sequence analysis was performed on each sequence in the NRPDB as described in Section 2. Example distributions of β-barrel scores from the random sequence analysis are shown for one TMBB (Tsx) and one soluble non-TMBB (xylanase) in Figure 5. The β-barrel score of the native sequence is shown on each distribution for comparison with the MRS. The two-tailed probability (P) that a randomized sequence of the same composition would score as high as the native sequence is also shown. Although the β-barrel scores of the native sequences are similar among the two examples, the difference between the β-barrel score of the native sequence and the MRS is significant for the TMBB but not for the non-TMBB. This suggests that the sequences that correspond to TMBB structure are rare arrangements of a particular composition.
Fig. 5.
Randomized sequence scoring analysis. Here are example β-barrel score distributions for sequences that had been randomized and scored by the Freeman–Wimley algorithm. Two positively predicted sequences from the analysis of the NRPDB (one true positive and one false positive) are shown. The β-barrel score for the native sequence is shown as a circled X. The β-barrel score of the native sequence was compared to the mean score of the randomized sequences. (A) Analysis of nucleoside transporter, Tsx (1tlw; Ye and van den Berg, 2004), a TMBB. (B) Analysis of xylanse (1bcx; Wakarchuk et al., 1994), a soluble protein.
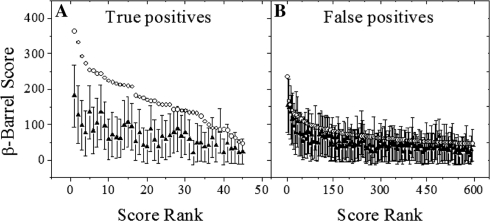
Figure 6 shows the randomized sequence analysis results for true and false positive predictions from the NRPDB where positives were predicted using a prediction threshold β-barrel score of 46. The plots for known TMBBs and false positives show the β-barrel scores of native sequences compared to the MRS ±1.96σ for all of the sequences tested. The β-barrel scores of the predicted true positives (N = 46) are all greater than their MRS where 80% of which are significantly greater than their MRS (P ≤ 0.05); this represents 77% of all known TMBBs in the NRPDB. However, the β-barrel scores of the false positives from the NRPDB (N = 599) were less different from their MRS where only 27% were significantly greater than their MRS (P ≤ 0.05). This result suggests that the β-barrel scores of most TMBBs are more strongly influenced by their sequences than their compositions and the opposite is true for the majority of false positives.
Fig. 6.
Mean-randomized score. Sequences that were positively identified (β-barrel score >45) were randomized to generate the MRS. The MRS ±1.96σ is shown as solid triangles and the β-barrel score of the native sequence is shown as open circles. (A) True TMBBs; N = 46. (B) Non-TMBBs; N = 599.
The sequences in the NRPDB belong to a wide range of structural classes. The number of positive predictions made by the Freeman–Wimley algorithm is compared to the additional screening using the MRS test and categorized by structural class in Supplementary Table S4. These results show that the most common type of false positive belongs to the all β-sheet class. The MRS test broadly reduced the total number of false positives by 73% and most effectively improved discrimination against all α-helix, coiled-coil and α/β folds.
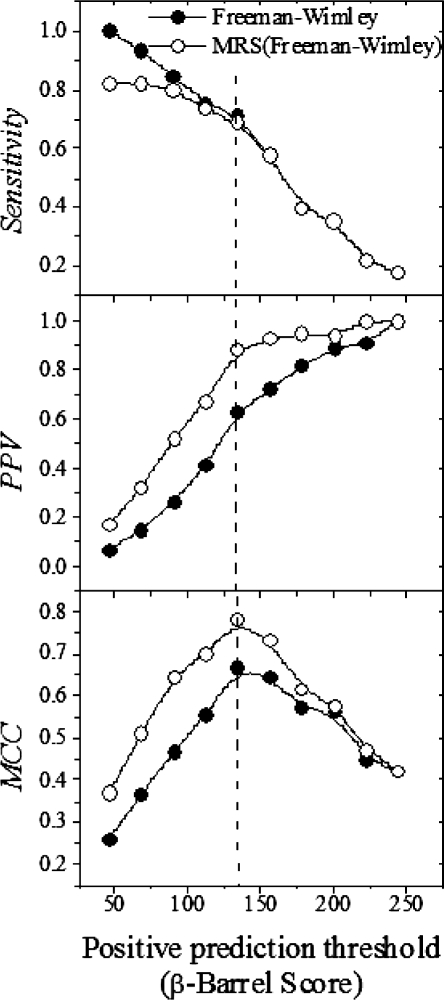
The prediction efficiency was compared between the Freeman–Wimley algorithm with and without the MRS test in Figure 7. At comparable sensitivity levels, the MRS test decreased the rate of false positive predictions by as much as 50% and the overall efficiency increased by as much as 25%. This shows that the MRS test is a powerful tool that enhances the discriminatory power of the Freeman–Wimley algorithm.
Fig. 7.
MRS improves prediction efficiency of Freeman–Wimley algorithm. Screening the NRPDB using the MRS test (open circles) reduced the number of false positives while still selecting similar numbers of true positives compared to the Freeman–Wimley algorithm alone (closed circles). The most efficient prediction threshold, 135, is indicated by the dashed line.
3.4 Comparison to other prediction methods
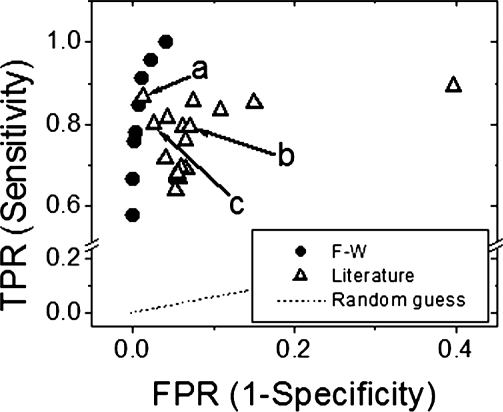
Several examples of other prediction methods were collected from the literature to compare their performances to the performance of the Freeman–Wimley method (Gromiha and Suwa, 2006; Hu and Yan, 2008; Liu et al., 2003). The various selected methods included a variety of machine learning methods. The Freeman–Wimley algorithm was plotted in a receiver operating characteristic (ROC) curve and the ROC values of each method were plotted in Figure 8 (also see Supplementary Table S3 for more detailed data). These data show that the algorithm developed in this work clearly outperformed almost all other previously published methods.
Fig. 8.
ROC curve comparing published prediction algorithms. The ROC values of several previously published prediction algorithms were plotted for comparison to the Freeman–Wimley analysis of the NRPDB. Three of the algorithms were used in a direct comparison to the Freeman-Wimley (F–W) algorithm (Table 2) and are labeled (a) k-NN (Hu and Yan, 2008), (b) RBF (Ou et al., 2008) and (c) βOMP (Berven et al., 2004). Names, data and references of all algorithms are listed in Supplementary Table S3.
A more statistically stringent comparison test was performed with algorithms that were publicly available and able to analyze the NRPDB. The prediction results from each algorithm are listed in Table 2. In each case, the Freeman–Wimley algorithm made nearly half as many false positive predictions as the other algorithms. The conclusion drawn from this data is that the Freeman–Wimley algorithm is the most accurate predictor of TMBBs currently available.
Table 2.
Multi-algorithm comparison of NRPDB prediction resultsa
3.5 Genomic analysis
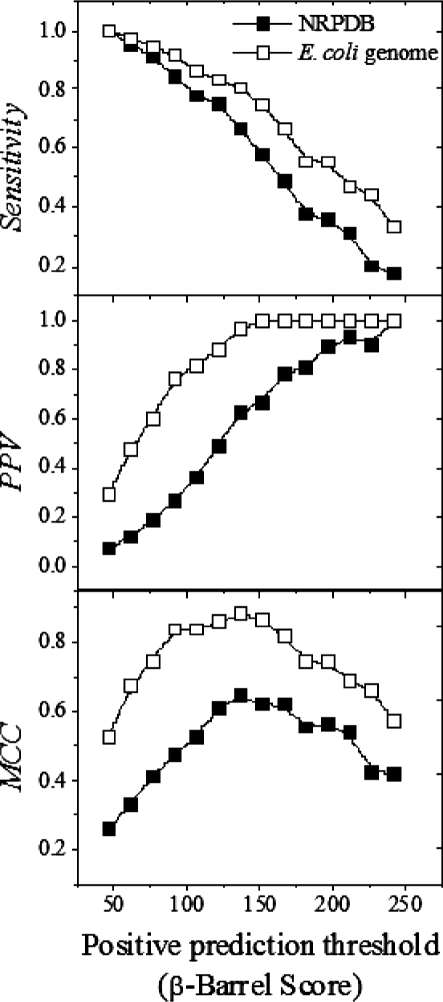
As previously mentioned, the purpose of improving the original TMBB prediction algorithm was to create a tool that could effectively identify TMBBs in genomic databases. The genome of E.coli, which is the most comprehensively annotated genome available, was analyzed and the results were compared to the analysis of the NRPDB in Figure 9.
Fig. 9.
Comparison of prediction efficiency in NRPDB and E. coli genome. The NRPDB contained 48 true TMBBs and 14 190 non-TMBBs. The E.coli genome has 36 known confirmed TMBBs and 2385 non-TMBBs; the remaining 2718 are unknown (114 were eliminated for being either too short or too long). This analysis only compared the prediction efficiency results for those E.coli genes, which were readily classifiable to the results of the NRPDB analysis. The PPV and MCC show that the Freeman–Wimley algorithm is much more efficient at distinguishing TMBB sequences from non-TMBB sequences in a genomic database than in the NRPDB.
The results for those E.coli genes, which were readily identifiable as being either TMBBs or non-TMBBs were included in this analysis. There were 36 TMBBs and 2385 non-TMBBs; the remaining 2718 hypothetical and putative proteins were ignored as well as 114 that were not analyzed because they were either shorter than 60 or longer than 4000 residues. The analysis results show that the algorithm is much more efficient at analyzing the known genes of E.coli than the NRPDB, which has sequences from a more phylogenetically diverse population. Furthermore, the results show that the NRPDB is a very stringent test case and suggests that genomic prediction results will be better.
4 DISCUSSION
4.1 NRPDB
An NRPDB was constructed to measure the prediction accuracy of the Freeman–Wimley algorithm. Since the structural identity of each sequence was known, correct and incorrect predictions were identified with greater certainty than the annotations made in other databases, such as SwissProt, which rely on presumed structural classifications for some of their entries. The conclusions drawn from analyzing the NRPDB are more reliable than using SCOP or Psort database annotations, which are more reliant on homology, because the structures of NRPDB sequences have all been manually verified rather than verified by computer algorithms (Murzin et al., 1995; Rey et al., 2005). Moreover, the non-TMBB proteins come from every kingdom of life, offering a diverse sampling of structures that may not be found in the genomes of Gram-negative bacteria. An advantage of such diversity is that it makes the NRPDB a very stringent test case for assessing the predictive power of an algorithm.
A total of 37 TMBBs were used for calculation of the abundance values. The 50% NRPDB test set included 35 members of the abundance value set and 13 unique TMBB sequences that were not in the abundance set (48 total). Between/among the positive training and testing sets there was no homology (median BLAST similarity <30%, median BLAST E-value = 1) except self-identity. To determine by another means if the presence of homologs was affecting the results presented above, a 20% NRPDB was constructed and tested as shown in Supplementary Figure S2. The results showed there was no difference in the prediction efficiency, thus the results reported from analyzing the 50% NRPDB were not influenced by the presence of homologous sequences.
All relevant sequence datasets are available as FASTA files in rich text format at http://www.tulane.edu/∼biochem/WW/apps.html. Four sequence files are given each for the 50% NRPDB and for the 20% NRPDB. The four files are: (i) the whole NRPDB; (ii) the NRPDB without the known TMBBs; (iii) all of the TMBBs in the test set that were not part of the training (abundance calculation) set; and (iv) the TMBBs in each NRPDB that were part of the training set. A separate file containing the entire abundance calculation set is also available.
4.2 Cross-validation
Although the NRPDB includes sequences that were used to generate abundance values, bias is not a concern because this statistical approach is not readily subject to overfitting. The absence of bias was verified in the following ways.
First, the abundance values were not determined in the hidden layer of a machine learning method, where the parameters may be subject to inadvertent overfitting to the training set, and where cross-validation is essential to prove the robustness of the fit. Instead, abundance values were simply measured from structural data and compiled in overall average values. Traditional cross-validation is unnecessary as long as individual members, families or groups in the dataset do not have compositional data that are statistically different from the overall average. We compared the amino acid abundances from the new set of proteins (which contains several novel families) to the expected counts, which were based on previously published results using pairwise comparisons. It was found that the two sets of abundance values were not statistically different, indicating that the various families in the two datasets have the same inherent abundance values.
Second, we analyzed the entire NRPDB, which contains 48 TMBBs, with composition data generated from only the previously published abundance values (only 15 proteins), and only the new abundance values (only 22 different proteins). ROC curves were generated for each analysis. The area under the curve for each ROC was 0.975 for each of the two independent sets of abundance values. This result further illustrates that all abundance values appear to have been sampled from a single parent population without bias.
Third, 13 of the 48 TMBBs in the non-redundant test database were not part of the training/abundance set in any way. The prediction accuracy when the training set contains only the non-training set TMBBs is nearly the same as when all 48 of the TMBB proteins are in the training set (see Supplementary Table S5). Using a β-barrel score threshold of 90, the algorithm predicts 32/37 members of the training set, and predicts 9/13 of the unique positives in the test set. This performance is especially good because many of the 13 remaining sequences are non-canonical examples of TMBBs as discussed below in Section 4.5. This provides an additional cross-validation.
Fourth, we compared abundance values from a subset of individual proteins in the training set to the overall abundance and found no significant statistical differences suggesting, again, that the abundance values are derived from a single parent population which we sample by our statistical methods. In this statistical method, bias can only arise if the composition of a family of proteins in the training set is different enough from the average to influence the results. This is not the case.
Fifth, it should be noted that we did not use the 14 238 protein NRPDB dataset as a training set. Instead we used only 37 known β-barrel membrane proteins. The NRPDB contains 35 of those 37 proteins as well as 13 additional TMBBs not included in the abundance dataset. All together, the test database includes 14 203 proteins (out of 14 238 in the database, i.e. 99.75%) that were not used in any way to calculate statistical data used by the algorithm. Thus, the fractional overlap between the training set and the test database is only 0.0025. The NRPDB is, therefore, already an almost entirely independent test set for assessing and comparing the performance of the algorithm.
4.3 A novel way to use the TMBB prediction algorithm
The MRS test was shown to be a powerful new way to reject false positives that received high scores because their compositions may have included unusually high numbers of favorable residues such as tyrosine. However, a major technical impediment to using the MRS test is that it increases the processing time for a dataset by three orders of magnitude, which can be cumbersome for very large genomic datasets. Thus, performing the MRS test is less practical on such large datasets. Nevertheless, the MRS test adds great strength to the discriminatory power of the β-barrel score while having a minimal impact on the sensitivity. This test also further supports the well-known hypothesis that a structure is encoded by the specific sequence, and depends less on the composition (Anfinsen and Scheraga, 1975).
4.4 High-scoring false positives
In spite of making the best efforts to eliminate all false positive predictions, certain proteins always received β-barrel scores comparable to the highest scoring TMBBs. A number of non-TMBB sequences are still predicted to be positive after the various improvements made to the algorithm. The supersecondary structures of most of these proteins were mostly β, α/β or α+β. The structures reveal the presence of amphipathic β-sheets with similar compositions to TMBB β-sheets, which explains the prediction results. It appears that the various amphipathic helices, turns and side-chain interactions between β-strands are structural factors that allow the same type of β-sheets found in TMBBs to exist in a soluble form. Most of the false positives designated the all α classification belong to the six-[α-]hairpin glycosidase superfamily such as 1f9d (Parsiegla et al., 2000). Interestingly, nearly one-third of the structure of 1f9d contains β-sheet, which was identified as the high-scoring section of the sequence (data not shown), thus 1f9d should be classified as having α+β supersecondary structure. Another protein classified as all α, 1sp3 (a putative cytochrome C), also has a significant portion of the sequence folded into β-sheets (Mowat et al., 2004). This protein is also the only ‘all α’ false positive that passed the MRS test, which was not particularly surprising given that there is a well-ordered β-sheet in the structure and the residues in many of the short helices have an alternating pattern of hydrophobicity. Although it is difficult for the current TMBB prediction algorithm to distinguish these types of soluble proteins from TMBBs, their overall occurrence in a proteobacterial genome is presumably less frequent than in the more stringent NRPDB. This explains the much higher PPVs observed in the analysis of the E.coli genome compared to the NRPDB.
4.5 Low-scoring true positives
There were three porin-like TMBBs that scored poorly and did not pass the MRS test. The structures of sucrose porin (1a0s), NalP (1uyn) and the lipopolysaccharide (LPS)-O-deacylase, PagL (2erv), were examined to understand why they did not fit the prediction model used by the algorithm (Oomen et al., 2004; Rutten et al., 2006; Wang et al., 1997). The reason these protein sequences scored worse than the other porins is that the sequences in some of the β-strands deviate from the dyad repeat pattern expected by the prediction model. In each case, there were multiple β-strands with hydrophobic side chains facing the interior surface of the pore. The significance of this is that two to three consecutive hydrophobic residues in a β-strand is inconsistent with the dyad repeat pattern of alternating hydrophobicity seen more commonly in TM β-strands. In the prediction model of the Freeman–Wimley algorithm, β-strands with deviations from the canonical pattern receive lower β-strand scores, which subsequently result in reduced local β-hairpin scores and consequently, lower β-barrel scores. The impact this has on a β-barrel score is significant because any regions of the sequence that receive β-hairpin scores less than six do not count toward the β-barrel score; so if one or two β-strands each have one deviation from the dyad repeat pattern, then the β-barrel score could be reduced substantially.
Another group of TMBBs that includes low-scoring members is the multimeric single-pore-formers (i.e. the sequences of individual protomers that assemble to form a single TM pore such as OprM, TolC and α-hemolysin; Akama et al., 2004; Koronakis et al., 2000; Song et al., 1996). There are three classes of proteins that form multimeric single pores in the NRPDB: the multi-drug efflux pumps, the cytolysins, and a trimeric autotransporter. The multi-drug efflux pumps received low scores, ranging from 46 to 69 and they all failed the MRS test. The proteins in this class have very little β-sheet content, have extensive helical content, which dilutes the β-hairpin density, and were, therefore, expected to receive low β-barrel scores. The cytolysins have more β-sheet content than the multi-drug efflux pumps and received β-barrel scores ranging from 64 to 183. Interestingly, the only part of proteins in this class that actually contribute to membrane insertion is a single β-hairpin, which contributes 15–40 points to the β-barrel score. Lastly, a monomer of the homotrimeric autotransporter, Hia (2gr7; Meng et al., 2006), was the only TMBB to receive a β-barrel score of 0. The short sequence (129 residues) is dominated by an α-helix that constitutes a third of the sequence. Although the two β-hairpins are not readily discerned by the prediction algorithm, concatenating the sequence (i.e. consecutively pasting more than one copy of the sequence) allows for the detection of both β-hairpins in the penultimate copy of the monomeric sequence. This illustrates the need to address the loss of information content at the termini of sequences caused by the algorithm. Together, these observations imply that this algorithm is not as useful for the prediction of multimeric single barrels as it is for the single-molecule TMBBs. This, however, is not especially problematic since multimeric single barrels represent a small proportion of TMBBs.
4.6 Comparison to other prediction methods
Machine learning methods are a reasonable choice for decoding the enigmatic sequences of TMBBs and can produce high prediction accuracies. However, this work shows that a good statistical approach with solid hypothesis testing can surpass the accuracy of machine learning methods and carries the added advantage of advancing the understanding of the underlying physical principles that govern TMBB structure. Furthermore, most machine-learning methods do not reveal the specific properties of TMBBs used to make their predictions. Indeed, there is little attention given to elucidating the quintessential features of a sequence that lead to a certain fold and much less attention given to exploring the details that lead to false results.
4.7 Toward genomic prediction
In this study, an algorithm developed to predict TMBBs from genomic sequences, first developed in this lab, was modified to improve the accuracy of the algorithm. The lab's original algorithm works well at identifying known TMBBs, but has a limited capacity to discriminate against non-TMBBs in the NRPDB. Various weaknesses were improved, which led to a dramatic enhancement in overall prediction efficiency. The Freeman–Wimley algorithm distinguishes TMBBs from other proteins with very high accuracy in the NRPDB, which was a very stringent test case, and outperformed any previously published algorithm. The most important aspect of this prediction algorithm is that it is based on an explicit understanding of the physicochemical properties involved in the structure of known TMBBs. With regard to identifying the optimal user-selected threshold, it was observed that protein sequences that score less than 45 can be accurately classified as non-TMBBs, while a threshold between 90 and 135 is optimal for achieving the greatest sensitivity and highest confidence that positive predictions are true TMBBs. Additionally, a positive result from the MRS test combined with a high β-barrel score makes a prediction substantially stronger. All of the evidence presented in this work validates the basic principles established in the development of the original algorithm and has culminated in a highly refined algorithm which is the most accurate TMBB prediction method to date. Furthermore, the analysis of the E.coli genome showed that this algorithm can satisfactorily perform the task of identifying TMBB-encoding genes in genomic databases. The work presented here showcases the development of a powerful tool that will be used to identify TMBBs from the genomes of Gram-negative bacteria. The predictions will be stored in a database, which may facilitate a much more rapid expansion in the study of this fascinating structural class of membrane proteins.
Supplementary Material
ACKNOWLEDGEMENTS
We would like to acknowledge Aram Krauson and Jessica Marks for their critical reading of this manuscript.
Funding: National Institutes of Health (NIH) (grant GM060000) and Louisiana Board of Regents (LA BOR) Research Commercialization and Educational Enhancement Program RC/EEP-05(2007-10).
Conflict of Interest: none declared.
REFERENCES
- Akama H, et al. Crystal structure of the drug discharge outer membrane protein, OprM, of Pseudomonas aeruginosa: dual modes of membrane anchoring and occluded cavity end. J. Biol. Chem. 2004;279:52816–52819. doi: 10.1074/jbc.C400445200. [DOI] [PubMed] [Google Scholar]
- Anfinsen CB, Scheraga HA. Experimental and theoretical aspects of protein folding. Adv. Protein Chem. 1975;29:205–300. doi: 10.1016/s0065-3233(08)60413-1. [DOI] [PubMed] [Google Scholar]
- Berman HM, et al. The Protein Data Bank. Nucleic Acids Res. 2000;28:235–242. doi: 10.1093/nar/28.1.235. [DOI] [PMC free article] [PubMed] [Google Scholar]
- Berven FS, et al. BOMP: a program to predict integral β-barrel outer membrane proteins encoded within genomes of Gram-negative bacteria. Nucleic Acids Res. 2004;32:W394–W399. doi: 10.1093/nar/gkh351. [DOI] [PMC free article] [PubMed] [Google Scholar]
- Chimento DP, et al. Substrate-induced transmembrane signaling in the cobalamin transporter BtuB. Nat. Struct. Biol. 2003;10:394–401. doi: 10.1038/nsb914. [DOI] [PubMed] [Google Scholar]
- Fernandez C, et al. Transverse relaxation-optimized NMR spectroscopy with the outer membrane protein OmpX in dihexanoyl phosphatidylcholine micelles. Proc. Natl Acad. Sci. USA. 2001;98:2358–2363. doi: 10.1073/pnas.051629298. [DOI] [PMC free article] [PubMed] [Google Scholar]
- Gromiha MM, Suwa M. Discrimination of outer membrane proteins using machine learning algorithms. Proteins. 2006;63:1031–1037. doi: 10.1002/prot.20929. [DOI] [PubMed] [Google Scholar]
- Hu J, Yan C. A method for discovering transmembrane β-barrel proteins in Gram-negative bacterial proteomes. Comput. Biol. Chem. 2008;32:298–301. doi: 10.1016/j.compbiolchem.2008.03.010. [DOI] [PubMed] [Google Scholar]
- Jayasinghe S, et al. Energetics, stability, and prediction of transmembrane helices. J. Mol. Biol. 2001;312:927–934. doi: 10.1006/jmbi.2001.5008. [DOI] [PubMed] [Google Scholar]
- Koronakis V, et al. Crystal structure of the bacterial membrane protein TolC central to multidrug efflux and protein export. Nature. 2000;405:914–919. doi: 10.1038/35016007. [DOI] [PubMed] [Google Scholar]
- Liu Q, et al. Identification of β-barrel membrane proteins based on amino acid composition properties and predicted secondary structure. Comput. Biol. Chem. 2003;27:355–361. doi: 10.1016/s1476-9271(02)00085-3. [DOI] [PubMed] [Google Scholar]
- Matthews BW. Comparison of the predicted and observed secondary structure of T4 phage lysozyme. Biochim. Biophys. Acta. 1975;405:442–451. doi: 10.1016/0005-2795(75)90109-9. [DOI] [PubMed] [Google Scholar]
- Meng G, et al. Structure of the outer membrane translocator domain of the Haemophilus influenzae Hia trimeric autotransporter. EMBO J. 2006;25:2297–2304. doi: 10.1038/sj.emboj.7601132. [DOI] [PMC free article] [PubMed] [Google Scholar]
- Mowat CG, et al. Octaheme tetrathionate reductase is a respiratory enzyme with novel heme ligation. Nat. Struct. Mol. Biol. 2004;11:1023–1024. doi: 10.1038/nsmb827. [DOI] [PubMed] [Google Scholar]
- Murzin AG, et al. SCOP: a structural classification of proteins database for the investigation of sequences and structures. J. Mol. Biol. 1995;247:536–540. doi: 10.1006/jmbi.1995.0159. [DOI] [PubMed] [Google Scholar]
- Oomen CJ, et al. Structure of the translocator domain of a bacterial autotransporter. EMBO J. 2004;23:1257–1266. doi: 10.1038/sj.emboj.7600148. [DOI] [PMC free article] [PubMed] [Google Scholar]
- Ou YY, et al. TMBETADISC-RBF: discrimination of β-barrel membrane proteins using RBF networks and PSSM profiles. Comput. Biol. Chem. 2008;32:227–231. doi: 10.1016/j.compbiolchem.2008.03.002. [DOI] [PubMed] [Google Scholar]
- Parsiegla G, et al. Crystal structures of the cellulase Cel48F in complex with inhibitors and substrates give insights into its processive action. Biochemistry. 2000;39:11238–11246. doi: 10.1021/bi001139p. [DOI] [PubMed] [Google Scholar]
- Pautsch A, Schulz GE. Structure of the outer membrane protein A transmembrane domain. Nat. Struct. Biol. 1998;5:1013–1017. doi: 10.1038/2983. [DOI] [PubMed] [Google Scholar]
- Remaut H, et al. Fiber formation across the bacterial outer membrane by the chaperone/usher pathway. Cell. 2008;133:640–652. doi: 10.1016/j.cell.2008.03.033. [DOI] [PMC free article] [PubMed] [Google Scholar]
- Rey S, et al. PSORTdb: a protein subcellular localization database for bacteria. Nucleic Acids Res. 2005;33:D164–D168. doi: 10.1093/nar/gki027. [DOI] [PMC free article] [PubMed] [Google Scholar]
- Rutten L, et al. Crystal structure and catalytic mechanism of the LPS 3-O-deacylase PagL from Pseudomonas aeruginosa. Proc. Natl Acad. Sci. USA. 2006;103:7071–7076. doi: 10.1073/pnas.0509392103. [DOI] [PMC free article] [PubMed] [Google Scholar]
- Sandgren M, et al. The X-ray crystal structure of the Trichoderma reesei family 12 endoglucanase 3, Cel12A, at 1.9 A resolution. J. Mol. Biol. 2001;308:295–310. doi: 10.1006/jmbi.2001.4583. [DOI] [PubMed] [Google Scholar]
- Schulz GE. β-Barrel membrane proteins. Curr. Opin. Struct. Biol. 2000;10:443–447. doi: 10.1016/s0959-440x(00)00120-2. [DOI] [PubMed] [Google Scholar]
- Snider C, et al. MPEx: a tool for exploring membrane proteins. Protein Sci. 2009;18:2624–2628. doi: 10.1002/pro.256. [DOI] [PMC free article] [PubMed] [Google Scholar]
- Song L, et al. Structure of staphylococcal α-hemolysin, a heptameric transmembrane pore. Science. 1996;274:1859–1866. doi: 10.1126/science.274.5294.1859. [DOI] [PubMed] [Google Scholar]
- Vandeputte-Rutten L, et al. Crystal structure of the outer membrane protease OmpT from Escherichia coli suggests a novel catalytic site. EMBO J. 2001;20:5033–5039. doi: 10.1093/emboj/20.18.5033. [DOI] [PMC free article] [PubMed] [Google Scholar]
- Vogt J, Schulz GE. The structure of the outer membrane protein OmpX from Escherichia coli reveals possible mechanisms of virulence. Structure. 1999;7:1301–1309. doi: 10.1016/s0969-2126(00)80063-5. [DOI] [PubMed] [Google Scholar]
- Wakarchuk WW, et al. Mutational and crystallographic analyses of the active site residues of the Bacillus circulans xylanase. Protein Sci. 1994;3:467–475. doi: 10.1002/pro.5560030312. [DOI] [PMC free article] [PubMed] [Google Scholar]
- Wang YF, et al. Channel specificity: structural basis for sugar discrimination and differential flux rates in maltoporin. J. Mol. Biol. 1997;272:56–63. doi: 10.1006/jmbi.1997.1224. [DOI] [PubMed] [Google Scholar]
- White SH, Wimley WC. Hydrophobic interactions of peptides with membrane interfaces. Biochim. Biophys. Acta. 1998;1376:339–352. doi: 10.1016/s0304-4157(98)00021-5. [DOI] [PubMed] [Google Scholar]
- Wimley WC. Toward genomic identification of β-barrel membrane proteins: composition and architecture of known structures. Protein Sci. 2002;11:301–312. doi: 10.1110/ps.29402. [DOI] [PMC free article] [PubMed] [Google Scholar]
- Wimley WC. The versatile β-barrel membrane protein. Curr. Opin. Struct. Biol. 2003;13:404–411. doi: 10.1016/s0959-440x(03)00099-x. [DOI] [PubMed] [Google Scholar]
- Ye J, van den Berg B. Crystal structure of the bacterial nucleoside transporter Tsx. EMBO J. 2004;23:3187–3195. doi: 10.1038/sj.emboj.7600330. [DOI] [PMC free article] [PubMed] [Google Scholar]
Associated Data
This section collects any data citations, data availability statements, or supplementary materials included in this article.


