

Abstract
An optical window model for the rodent dorsum was used to perform chronic and quantitative intravital microscopy and laser Doppler flowmetry of microvascular networks adjacent to functional and non-functional glucose sensors. The one-sided configuration afforded direct, real-time observation of the tissue response to bare (unmodified, smooth surface) sensors and sensors coated with porous poly-L-lactic acid (PLLA). Microvessel length density and red blood cell flux (blood perfusion) within 1mm of the sensors were measured bi-weekly over two weeks. When non-functional sensors were fully implanted beneath the windows the porous coated sensors had twofold more vasculature and significantly higher blood perfusion than bare sensors on Day 14. When functional sensors were implanted percutaneously, as in clinical use, no differences in baseline current, neovascularization or tissue perfusion were observed between bare and porous coated sensors. However, percutaneously implanted bare sensors had two-fold more vascularity than fully implanted bare sensors by Day 14, indicating other factors, such as micromotion, might be stimulating angiogenesis. Despite increased angiogenesis adjacent to percutaneous sensors, modest sensor current attenuation occurred over 14 days, suggesting that factors other than angiogenesis may play a dominant role in determining sensor function.
INTRODUCTION
Previously we reported that porous poly-L-lactic acid (PLLA) coatings were an effective means of increasing the vascularity of tissue that surrounds subcutaneous implanted glucose sensors 1. That study relied on post-implantation histological analysis to quantify microvessel density.
Window chamber models have long been used to visualize in situ cellular phenomena in living tissue 2-4. Window chambers can be used for days to months in an animal, permitting long-term, serial investigations of microcirculation, wound healing and cellular interactions5. The two-sided dorsal skin-fold window chamber 6-8 has been employed in hamsters, mice, rats and rabbits 9-13 and have been used to monitor tumour growth 10, 11, biomaterial interactions 12, 14, 15 and tissue remodelling around implantable sensors 5, 8, 9. A limitation of the dorsal skin-fold window chamber is the small separation distance (typically 200μm or less) between the two transparent plates, making the observed tissues essentially two dimensional. One-sided windows have been used less frequently 11, 16, 17.
The use of window chambers for glucose sensor research was pioneered by Gough 5, 8, 9 who used dorsal skin fold window chambers primarily in hamsters to serially monitor changes in tissue surrounding implantable oxygen, glucose and/or temperature sensors and correlate how these changes impact sensor function. Sensor fluctuations were attributed to heterogeneous mass transfer in tissue from physiological changes in local microvascular perfusion, metabolite concentration, and variable oxygen distribution in tissue. The Gough group has also developed numerous preparations of the dorsal skin fold model to permit different tissue types in contact with the sensor arrays.
Recently, we described a one-sided dorsal window chamber modeled after the work of Shan 11 for direct observation of the tissue that surrounds glucose sensors inserted in dorsal rat subcutis18. The one-sided acrylic window exposes the sensor to a larger subcutaneous area, allowing a more realistic sensor-tissue interaction than that afforded by traditional window chamber models that sandwich the sensor between a window and thin piece of tissue 7, 10. While both Gough 5, 8, 9 and the work described here incorporated intravital microscopy to visualize microvascular development, we also added laser Doppler flowmetry to glean information about blood perfusion in the tissue surrounding the implanted sensor.
In the current study, two experimental configurations employing the one-sided window chamber were used to directly image the vascularity surrounding (1) fully implanted nonfunctional sensor strips devoid of glucose oxidase and plastic hub connectors (Figure 1A,C), and (2) percutaneously implanted functional sensors capable of continuous interstitial glucose monitoring (Figure 1B,D). In the first configuration, non-functional sensor strips were fully implanted without and with porous PLLA coatings beneath the dorsal one-sided window to observe changes in the microvascular development and perfusion adjacent to the sensor surfaces over 14 days. In the second configuration, percutaneous, functional sensors without and with porous coatings were implanted beneath the dorsal one-sided window to correlate microvessel imaging with real-time interstitial glucose monitoring over 14 days. The goal of the current study was to provide direct observation of how sensor placement and sensor coating may influence tissue remodelling and sensor performance.
Figure 1.
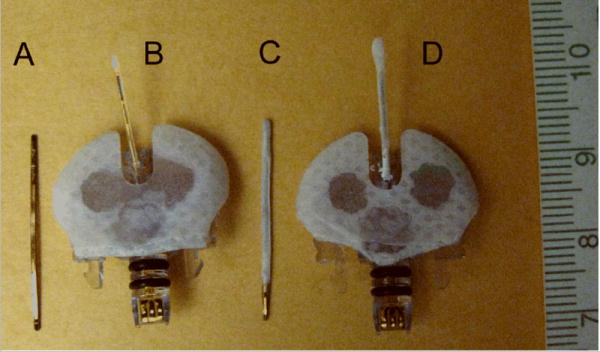
(A) non-functional bare sensor strip, (B) functional bare glucose sensor, (C) non-functional porous coated sensor strip, (D) functional porous coated glucose sensor. Non-functional sensor strips were devoid of glucose oxidase and plastic hub connectors.
MATERIALS AND METHOD
Rats
All National Institutes of Health guidelines for the care and use of laboratory animals (NIH Publication #85-23 Rev. 1985) were observed. Approval for these studies was granted by the Institutional Animal Care and Use Committee prior to initiation of the studies prior to their initiation. Thirty six male Sprague-Dawley type (CD) rats (150-200g, Charles River Laboratories, Inc., Wilmington, MA) were used for the dorsal window chamber studies: nineteen rats for the fully implanted non-functional sensor strips (n=6 bare sensors, n=5 porous coated sensors, n=8 sham windows) (Figure 1A,C), and seventeen rats for the percutaneously implanted functional sensors (Figure 1B,C) combined with real-time glucose measurements (n=9 bare sensors, n=8 porous coated sensors). “Bare” refers to untreated non-functional sensor strips or untreated functional sensors.
Sensors and associated hardware and software
Medtronic MiniMed SOF-SENSOR ™ glucose sensors, sensor strips, CGMS® system gold ™ monitors, MiniLink™ transmitters, MiniLink™ chargers, MiniMed Com-Station™, and related software were generously supplied by Medtronic MiniMed (Northridge, CA).
Sensor preparation
Non-cytotoxic, porous poly-L-lactic acid (PLLA) coatings with ∼ 30 μm pores were constructed using the ammonium bicarbonate salt leaching/gas foaming technique of Nam et al 19. Details of the porous coating fabrication and non-functional sensor strip preparation have been previously described 1. Non-functional sensors (plastic hub connector and glucose oxidase removed) were used to investigate the effects of porous PLLA coating on tissue response. Percutaneous Medtronic MiniMed sensors, with or without a porous PLLA coating were used in the functional sensor studies to monitor interstitial glucose concentrations.
Window Chamber and Inactive Sensor Implantation
Details of the acrylic window implantation procedure have been described previously 18. Acrylic windows were generously donated by Dr Siqing Shan, Duke University. In brief, a 10mm diameter circular full-thickness cutaneous excision down to fascia was performed approximately 2-3 cm below the scapular region in isoflurane-anesthetized rats to accommodate the 15mm diameter acrylic window (0.75mm thick). For nonfunctional sensor studies, a single sensor strip with or without a porous coating was sutured to the underlying muscle beneath the window. A “sham window” lacking an implanted sensor served as the control for the tissue reaction to the implanted window. Rats were monitored daily for infection and to ensure sutures were not removed. Additionally, antibiotic ointment was applied daily to the incised skin and rats were allowed access to rat chow and water ad libitum.
Laser Doppler Flowmetry (LFD)
Details of these procedures have been described previously 18. In brief, following window implantation, and on Days 3, 7, 10, 14, capillary blood perfusion was non-invasively measured via laser Doppler flowmetry using the LaserFlo® BPM2 Blood Perfusion Monitor and a P-203 probe (Vasamedics, Inc., St Paul, MN). The rat was anesthetized with 1-5-2.0% isoflurane prior to LDF measurements. The needle-like fiber optic probe was positioned directly above the lateral edge of the sensor strip and lowered until the probe tip gently contacted the window with no observable compression. A total of six locations adjacent to the sensor strips were sampled for blood perfusion.
Intravital Microscopy
Intravital microscopy was performed immediately following LDF measurements while the rat was anesthetized. The rat was positioned on the microscope stage and epi-illumination was used to focus the sensor beneath the window. For non-functional sensor strips, a bolus of 10mg of sodium fluorescein (Sigma-Aldrich, St Louis, MO) in 0.1ml sterile saline was injected into the tail vein. Microvessels around the sensor strips were imaged immediately following injection using a Leitz Laborlux 12 ME ST fluorescence microscope (Leica, Inc. Rockleigh, NJ), a 6.3x objective (Carl Zeiss, Inc., Thornwood, NY), a 75 W xenon arc lamp (Osram GmbH, Augsburg, Germany), a fluorescein filter set (excitation 450-490 nm, emission ≥515nm) and a Nikon CoolPix 5400 digital camera. When possible, images were also captured during injection to observe vessel patency as the fluorescein perfused the microvascular network beneath the window. The rat was imaged for approximately 10 minutes.
Microvessel Length Density
Details of image analysis have been previously described 18. In brief, intravital microscopic digital images were opened using Image J 1.37a software (National Institutes of Health, Bethesda, MD). Three or four 1×1mm2 digital boxes were digitally drawn immediately adjacent to the sensor-tissue interface. Using the MeasureCumulativeDistances macro from Image J, each vessel within a digital 1mm2 box was traced, followed by recording the sum of the accumulated lengths measured per box in Microsoft Excel. The total cumulative microvessel length (mm) was tabulated for each sensor group, as well as for each sham window. The two primary criteria for defining a blood microvessel were: (1) length of structure greater than diameter (to minimize counting dark areas as vessels), and (2) good contrast between the dark vessel structure and the green fluorescent tissue. The presence of branches stemming from the structure of interest, or if the structure of interest was a branch stemming from a structure that met the vessel criteria, were also a defining criteria. Microvessel length density (mm/mm2) was calculated by dividing the total microvessel length for each image by the known area of the image.
Functional Sensor Implantation and Experimentation
Windows were implanted as described above. Either a bare sensor or porous coated sensor was inserted percutaneously beneath the window, while the plastic hub was sutured to the rat skin to allow connection with the MiniLink™ Transmitter on test days. MiniLink™ transmitters were activated for less than 6 hours on Days 3, 7, 10, 14 to minimize tension on the sutures, and also reduce mechanical irritation along the sensor-tissue interface. While anaesthetized, blood was sampled via tail vein sticks to measure baseline glucose concentrations. Cumulative microvessel length, LDF blood flow, and sensor response to glucose challenge were recorded for bare and porous coated sensors at Days 3, 7, 10, 14.
Blood perfusion and intravital microscopic measurements were performed as described above with the following modifications. Once focused for imaging, 0.5ml of 50% D-glucose (Sigma, St. Louis, MO) with 20mg/mL fluorescein (Sigma, St. Louis, MO) was injected into the tail vein at 0.5mL/minute. The glucose and fluorescein mixture permitted correlation of microvessel length with sensor response to a glucose challenge. Interstitial glucose concentrations at the sensor surface were downloaded from the MiniLink™ as electrical current (nA). The downloaded data were plotted in GraphPad Prism software to evaluate sensor baseline current, maximum sensor current in response to the bolus injection and lag time between injection and peak sensor current. One to two hours post bolus injection, the MiniLink™ transmitter and jacket were removed, the e-collar replaced and antibiotic ointment applied to the window area.
Explanted Sensor Analysis
Following animal sacrifice, the functional sensors were carefully removed from beneath the window and stored at -4°C. The post-implantation sensor sensitivity and response time were determined in vitro by connecting explanted sensors to CGMS® system gold ™ monitors, soaking the sensors in unstirred PBS (0mg/dL glucose) overnight at 37°C, and then recording nA responses to step increases in glucose concentration ranging from 0 to 400mg/dL at 1 hour intervals. Sensitivity was defined as the slope of the regression line of sensor current (nA) against known glucose concentrations (mg/dL) 20. Ninety percent response time (t90) was defined as the time required for the sensor to reach 90% of peak sensor current following a step increase in glucose concentration.
Statistical Analysis
Comparison of cumulative vessel lengths and laser Doppler Flowmetry measurements were performed by two-factor ANOVAs with Bonferroni post-hoc tests. To measure intra-group differences, a single-factor ANOVA with Tukey’s multiple comparison post-hoc test was employed.
To compare intra-group differences in sensor response, baseline, magnitude of sensor response and time to reach maximum sensor current following a glucose bolus injection, single-factor ANOVAs with Tukey’s Multiple Comparison Tests were used. To compare inter-group differences in baseline and times to reach maximum sensor current following a glucose bolus injection between porous coated and bare sensors for each time point, two-factor ANOVAs with Bonferroni post-hoc tests were used, while unpaired (two-tailed) t-tests were used to compare inter-group differences in sensor response between porous coated and bare sensors at each time point. To compare differences between new and explanted sensors in (1) sensor current and (2) time to reach 90% maximum sensor current following step changes in glucose concentration, a two-factor ANOVA with a Bonferroni post-hoc test, and an unpaired two-tailed test were used, respectively. All data with n=3 or greater is presented as ±SEM.
RESULTS
Non-functional Sensors
For all treatment groups, minimal to moderate exudate, minimal tissue debris, and minimal red blood cell extravasation persisted to Day 7, at which point new vessel growth was observed that persisted to Day 14. Only two incidences of infection occurred by Day 14.
Figure 2A and B show images typical of Day 14 vessel growth associated with bare and porous coated sensor strips, respectively, beneath the acrylic window. These figures illustrate the difference in tissue response between a bare sensor strip with a smooth surface and a sensor strip with a porous coating. Figure 2C shows the more random vessel growth typical of Day 14 tissue beneath a sham window.
Figure 2.
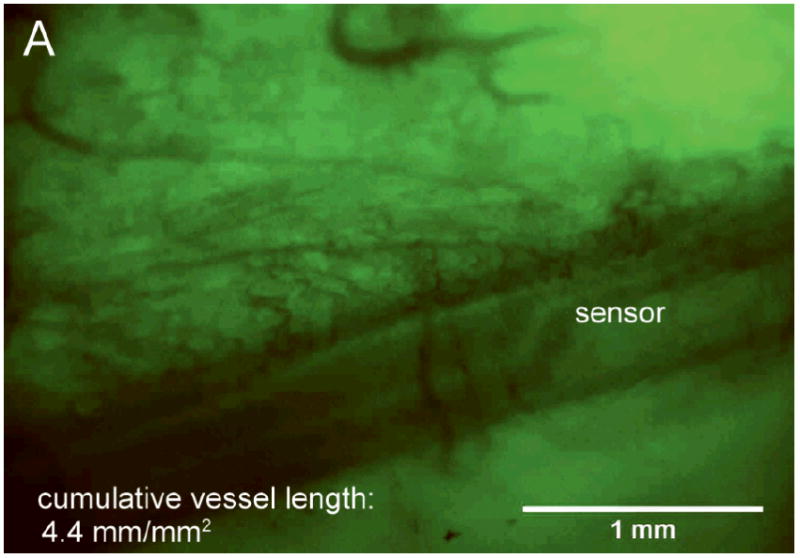
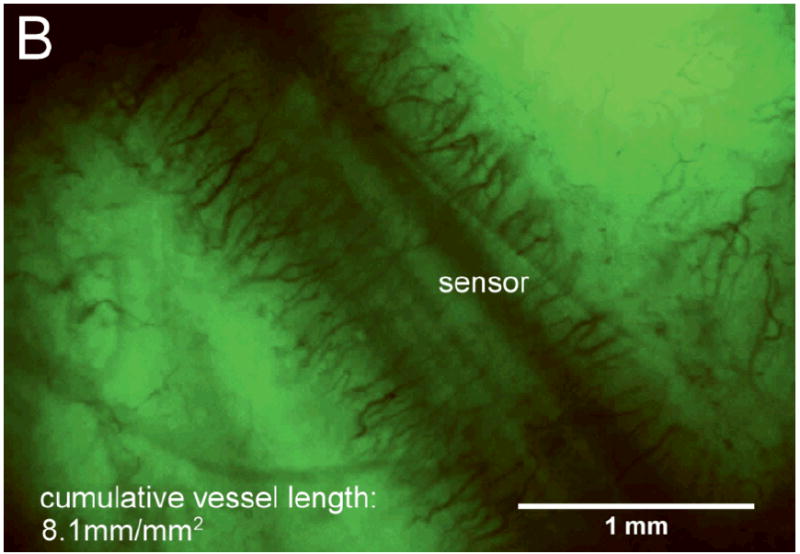
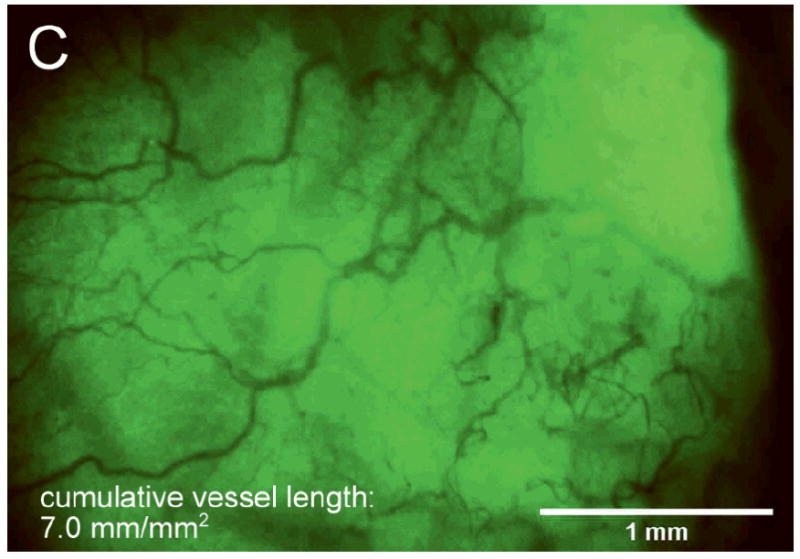
After 14 days fully implanted in the rat subcutis (A) minimal vascularization around the bare sensor strip; (B) directed vascularization around the porous coated sensor strip; (C) randomly branched vessels visible beneath sham window.
Figure 3 shows the trend in average cumulative vessel length within 1mm2 of the bare and porous coated sensor strips and in the tissue beneath the sham window. By Day 7 the microvessel lengths for all three cases were small and statistically indistinguishable. By Day 10 the microvessel lengths adjacent to the bare sensor strips were one-third the microvessel lengths of the porous coated sensor strip, but still not statistically different than the sham control. By Day 14 the microvessel lengths adjacent to the bare sensor strips were significantly lower that the sham control and still only half the microvessel length of the porous coated sensor strips.
Figure 3.
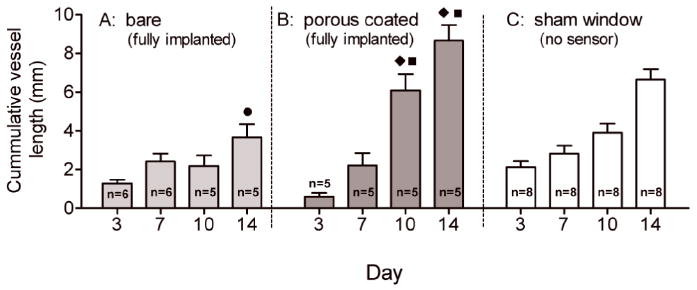
Comparison of cumulative vessel length (mm) within 1mm2 of fully implanted bare and porous coated sensor strips and beneath sham window over 14 days. Lowest cumulative vessel length occurred adjacent to the bare sensor strips, highest vessel length found adjacent to porous coated sensor strips. (● p<0.001 compared with sham; ◆ p<0.001 compared with bare; ■ p<0.05 compared with sham).
Figure 4 shows the corresponding LDF blood flow data. Similarly, Day 10 and 14 LDF blood flow values for bare sensor strips were two-thirds the blood flow measured for porous coated sensor strips; however, there were no differences compared to the sham control except for a significantly higher blood flow for porous coated sensors on Day 14. These data further suggest that the porous coatings promote a foreign body response favoring neovascularization.
Figure 4.
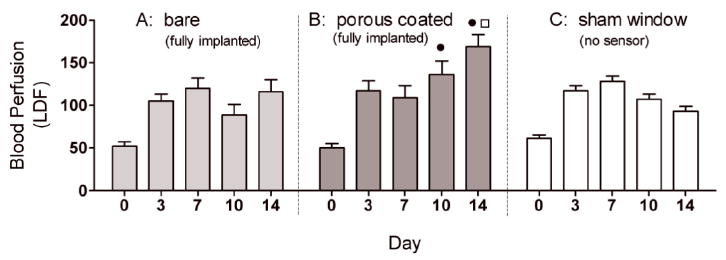
Comparison of blood perfusion adjacent to fully implanted bare (n = 5-6) and porous coated (n = 4-5) sensor strips, as well as beneath sham windows (n = 6-9) from Day 0 to Day 14. Tissue surrounding the porous coated surfaces had significantly higher LDF measurements on Days 10 and 14 compared to tissue adjacent to bare sensor strips, correlating with the increased cumulative vessel length observed around porous coated sensor strips compare with bare sensor strips. (● p<0.01 compared with bare; □ p<0.001 compared with sham).
It is interesting to note that the sham produced cumulative vessel length data that more closely resembled that of the porous coated sensors strips (Figure 3), while the sham control yielded blood flow data that more closely resembled the bare sensor strip data (Figure 4).
Functional Sensors
Fluorescein-glucose bolus injections and intravital microscopy were performed on Days 3, 7, 10 and 14 for nine rats with bare sensors and eight rats with porous coated sensors implanted percutaneously beneath an acrylic disk in the rat dorsum. LDF measurements were also taken at these time points, as well as on Day 0 immediately following sensor and window implantation. No additional sham studies were performed because they would have been redundant to sham studies shown in Figure 3 and Figure 4.
Each experiment on a give day was considered successful only if the sensor 1) remained securely implanted and visible beneath the viewing window, 2) was not infected, 3) had no technical difficulties injecting the bolus into the tail vein, or collecting/downloading data from the MiniLink™ digital camera, and 4) responded to glucose challenge.
Seventeen functional sensors were implanted on Day 0. According to these criteria, one failure occurred by Day 3, nine sensor failures occurred by Day 7, and two failures occurred between Days 11 and 13. Six sensors remained intact and infection-free by Day 14; however, we were unable to properly administer the bolus to the tail vein in one of the remaining six sensors. The overall success rate was therefore 5 of 17 sensors (30%), with three being bare and two being porous coated. Five failures occurred by sensor pull out, three from loss of sensor visibility beneath the window, two from data acquisition difficulties, and two from infection. There appeared to be no component-related failures, and none of these failure appeared to be related to whether the sensor was bare or porous coated.
Figure 5A and 5B are plots of the cumulative microvessel length adjacent to the surface of functional percutaneous sensors. The cumulative microvessel lengths for percutaneously implanted sensors with and without a porous coating were not statistically different at any of the four time points examined. Note: vessel length data for the percutaneously implanted porous coated sensor on Day 10 was excluded from statistical analysis due to an n=1. The microvessel lengths measured for porous coated percutaneously implanted sensors (Figure 5B) were also not statistically different than the porous coated fully implanted sensors (Figure 3B). The only significant difference was a two-fold increase in vascularity on Day 14 for percutaneously implanted bare sensors (Figure 5A) compared with the fully implanted bare sensor strips (Figure 3A).
Figure 5.
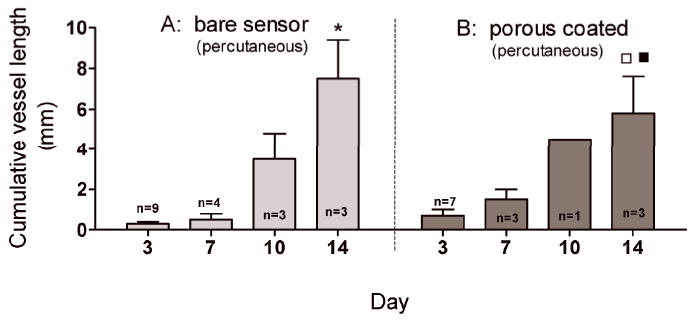
Cumulative vessel length (mm) within 1mm2 of sensor surfaces. No difference in vessel length between bare and porous coated percutaneously implanted sensors over 14 days. (* p<0.001 compared with bare sensor surface on Day 3 and Day 7; □ p<0.01 compared with porous coated sensor surface on Day 3; ■ p<0.05 compared with porous coated sensor surface on Day 7).
No intra- or inter-group statistically significant differences between LDF measurements were observed over the 14 days for either porous coated or bare sensors percutaneously implanted (Figure 6); nor were there any statistical differences in LDF measurements between bare sensors and sensor strips, or porous coated sensors and sensor strips, respectively, from Day 3 to Day 14 (Figure 4 vs. Figure 6).
Figure 6.
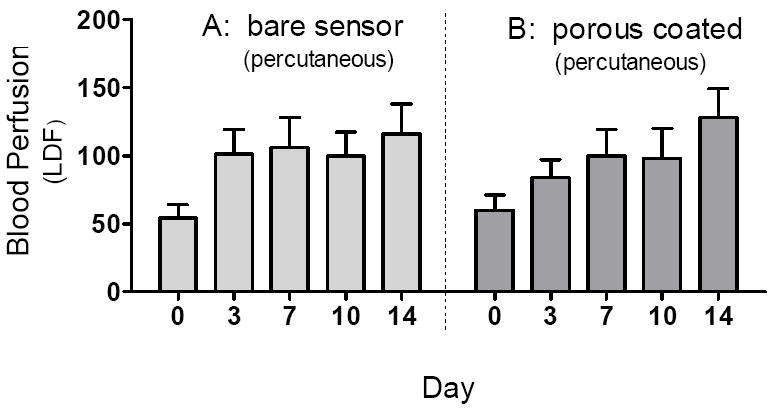
Comparison of blood perfusion adjacent to percutaneously implanted bare (n=3-9) and porous coated (n=4-8) sensors from Day 0 to Day 14. No significant difference in blood perfusion was observed between bare and porous coated sensors between Days 3 and 14.
Sensor Response to Glucose Challenge
Sensor responses to glucose bolus challenges showed typical asymmetric parabolic profiles. Figure 7 compares pre glucose bolus injection baseline current (A,C) and post glucose bolus injection maximum sensor current (B,D) and blood glucose concentrations for bare and porous coated percutaneous sensors for 14 days. Sensor currents closely matched blood glucose concentrations for both baseline glucose and maximum glucose concentrations. Sensor currents were similar regardless of the days implanted, or whether the sensors were bare or porous coated; however, variance was observed in the time to reach maximum response (Figure 8), ranging from 13 to 23 minutes post bolus injection. Note that Day 10 and 14 porous coated sensors were limited to n=2, thus not statistically valid. No statistically significant intra- or inter-group trends were observed for these data, with the exception of bare sensor response on Day 7, in which the response to the glucose challenge was slightly faster and larger than porous coated sensors (P<0.05). Time required for maximum blood glucose concentration post tail vein injection was 8 minutes. Eight minutes might be conservatively high as the first blood sample measured post injection ranged from 2 to 10 minutes depending on ease of locating the tail vein. Therefore, maximum blood glucose concentration may have occurred prior to the first blood glucose measurement.
Figure 7.
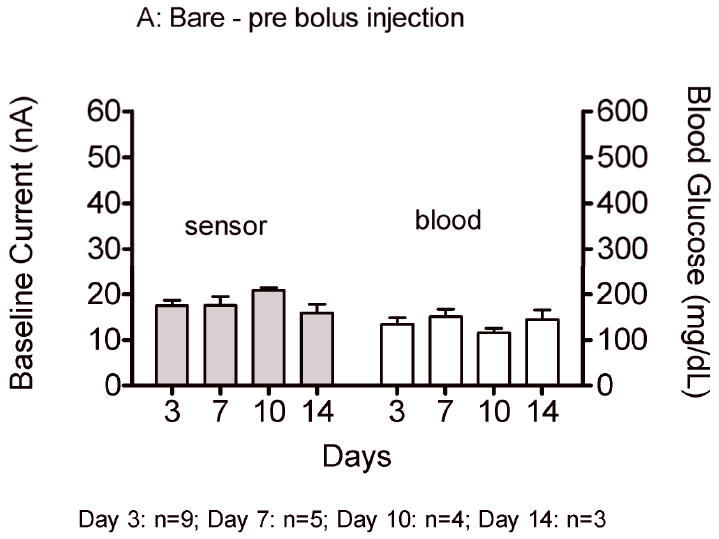
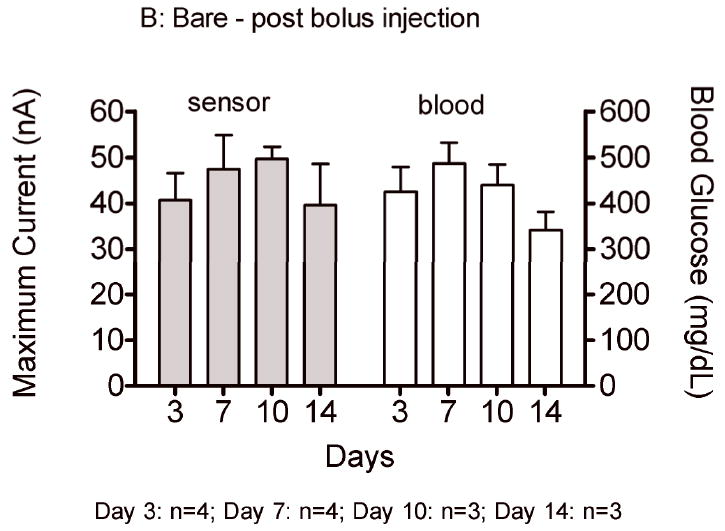
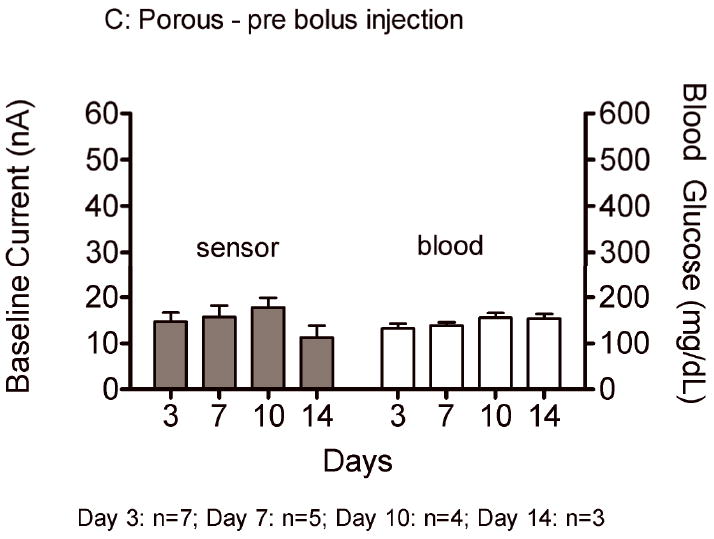
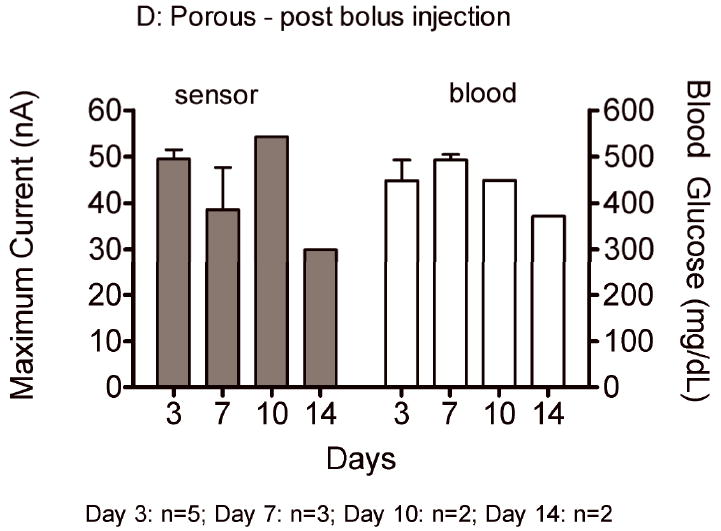
Average baseline current and maximum sensor current following a glucose bolus injection (nA) on Days 3, 7, 10 and 14 for bare (A,B) and porous coated (C,D) sensors. Corresponding baseline and maximum blood glucose concentrations have also been included.
Figure 8.
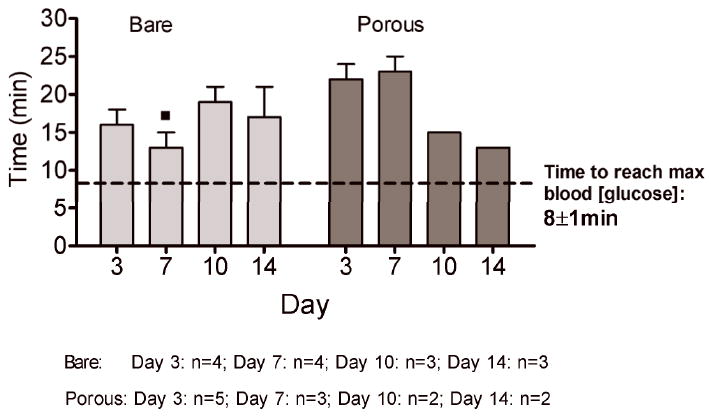
Times to reach maximum sensor response (min) post bolus injection for bare and porous coated sensors on Days 3, 7, 10 and 14. Times to reach maximum blood glucose concentrations have been included. (■ p<0.05 compared with Day 7 porous coated sensor response time).
In Vitro Testing of Explanted Sensors
Of the 17 implanted sensors, 13 remained sufficiently intact (not destroyed by rats) to be tested post-implantation in vitro with step changes in glucose concentration from 0 mg/dL to 400 mg/dL. Explanted sensors had a t90% response time of 5±1 minutes and a mean in vitro sensitivity (Δcurrent/Δconcentration) of 0.13 ± 0.0 nA/mg/dL. Twenty new MiniMed sensors responded to the same in vitro step increase testing with a t90% response time of 2±0 minutes with a mean sensitivity of 0.20 ± 0.0 nA/mg/dL. Thus, the explanted sensors had a significantly slower mean response time (P<0.0001) and a significantly lower sensitivity (P<0.001) than the new sensors.
DISCUSSION
Histology continues to provide a well-defined, but static snap-shot of tissue composition and structure at the time of sacrifice. Many valuable parameters, such as microvessel density, cellular composition, collagen content and capsule thickness, can be quantified from such analysis. However, one primary disadvantage of histology is the inability to collect serial, real-time data from a single animal.
The often-erratic behavior of implanted glucose sensors presents a dynamic experimental scenario that is impacted by time-dependent changes at the sensor-tissue interface. Gough and co-workers noted that direct tissue visualization is necessary to understand the underlying physiology behind unpredictable sensor response5. While subject to limitations, a window chamber model is the only way to simultaneously image changes at the sensor-tissue interface while collecting live sensor data, particularly during the first two weeks post-implantation that are the least favorable time for glucose measurement21. The window chamber model also lends itself to incorporation with other non-invasive detection methods; i.e. blood perfusion adjacent to sensor could be gathered by coupling intravital microscopy with laser Doppler flowmetry, providing valuable information on the health of the surrounding tissue.
In the current study a window chamber implanted into a single animal allowed direct monitoring of changes in the microvascular network and sensor function over several days. Microvessel number, patency, and orientation were visualized repeatedly, and nondestructively using fluorescent dyes, and correlated with sensor function using glucose bolus injections. Two implantation conditions were also monitored, fully implanted nonfunctional sensor strips and percutaneously implanted functional sensors. Each sensor was also either implanted bare (unmodified, smooth) or implanted with a PLLA porous coating (Figure 1).
In the non-functional sensor strip studies, a significant and predictable increase in cumulative microvessel length as well as significantly higher laser Doppler flowmetry values adjacent to porous coated sensors compared to bare sensors was measured. The observation that Day 14 tissue vascularization for bare sensor strips was significantly lower than both the porous coated sensor strips and the sham supports the well-established observation that smooth-surfaced implants are encapsulated by relatively avascular tissue 22,23,24,25. This observation was expected given our previously reported histology findings of a threefold increase in microvessel density adjacent to porous coated MiniMed glucose sensors compared with bare sensors after three weeks fully implanted in the rat subcutis1. These results validated that our window chamber model could quantify local changes in microvascularity and also provided the justification for the analogous study of percutaneously implanted functional sensors.
In the functional studies, rats received bolus injections of fluorescein-glucose to simultaneously illuminate the microvascular network beneath the window and measure sensor response to the glucose challenge. Unlike the non-functional sensor strip studies that provided a clear distinction in tissue response between the bare and porous sensors, the functional sensor studies generated a more ambiguous outcome. The following discussion focuses on the surprising disparity between the results of the non-functional fully implanted and functional percutaneous sensor studies.
Tissue irritation
Numerous studies have shown that fully implanted porous materials stimulate angiogenesis compared with smooth materials 20, 22, 24, 26, 27. In these studies the implants were fully implanted, and thus relatively free of mechanical stresses. In contrast, mechanical irritation of percutaneous devices is a leading cause in device failure. Acute mechanical interfacial stresses tear the device from its implantation bed 28, while chronic, small mechanical stresses cause localized injury, resulting in inflammation 29 and increased susceptibility to infection28. Mechanical forces also prevent an epidermal seal to form, increasing infection risk28.
When non-functional sensors were fully implanted in the rat dorsum, we observed a two fold increase in cumulative vessel length adjacent to the porous coated sensor by Day 14, compared with the smooth surface (bare sensor). The lumbar sacral region where the sensors were implanted is located in an area on the rat subjected to limited muscle motion30, therefore, minimal shear forces were expected at the implant-tissue interface.
In contrast, we observed no difference in neovascularization or sensor response between bare and porous coated percutaneous sensor groups. This similarity in angiogenesis translated into similar sensor responses over 14 days for both groups. It is possible that suturing of the plastic hub connector to the rat dermis may have contributed to chronic mechanical stress and irritation of the tissue along the sensor-tissue interface, resulting in increased inflammation 31. The integration of the porous coating with the surrounding tissue may have further increased tissue trauma at the porous coating-tissue interface compared with a smooth, non-tissue integrated surface. It is well known that chronic inflammation and angiogenesis are strongly linked32. The similar tissue responses between bare and porous coated sensors suggest that the capillarity adjacent to the sensor surface was induced less by surface texturing and more from mechanical irritation resulting from normal rodent movement (i.e. ambulation, grooming) and scratching the plastic hub connector sutured to the dermis.
The percutaneous functional sensors also showed no correspondence between cumulative microvessel length and sensor response to glucose bolus. Cumulative microvessel length adjacent to the sensor surfaces increased three- to seven-fold from Day 7 to Day 10, and up to two- fold by Day 14. However, the lowest sensor responses to glucose bolus challenge were recorded for both smooth and porous coated sensors on Day 14. Though modest, this attenuation in sensor current, despite increased angiogenesis, suggests that angiogenesis plays a secondary role in maintaining sensor function long-term.
Dungel et al. 33 recently observed that porous sensor coatings increase fibrosis and subsequently reduce sensor longevity compared with non-porous coated sensors in spite of increased vascularity of the surrounding tissue. We similarly observed in previous studies that increased collagen deposition often accompanies increased vascularity 1. Extrapolation of the functional sensor studies presented here suggests that increased collagen was a strong factor in attenuating baseline current than the beneficial effects of increased angiogenesis surrounding the porous coating. However, the reason for the attenuating effect of increased collagen deposition is not apparent. Unlike histology, the intravital microscopy and laser Doppler flowmetry did not allow for measuring the extent of collagen deposition.
A number of steps were taken to minimize anaesthetic effects. In the current studies, animals were anaesthetized twice weekly for glucose bolus challenges using inhaled isoflurane rather than injectable pentobarbital, as inhaled anaesthetics provided better control over length and depth of anaesthesia than injectable anaesthetics 34. Although isoflurane is known to elevate blood glucose levels, we believe the observed increases in sensor current were the result of the 50% glucose solution injected for the glucose bolus challenge. Rats were anaesthetized for approximately 15 minutes with isoflurane to allow for glucose bolus injection and imaging, following which the rat was removed from the anaesthetic. Moreover, a high dose (2.5% isoflurane) was used initially to induce rapid anaesthesia (~ 5 minutes), then reduced to 1.5% isoflurane for the remainder of the experiment. However, for future studies, fasted rats may be used instead of fed rats to minimize any effects of isoflurane on glucose levels since hyperglycaemia does not occur during isoflurane administration when rats are first fasted 35.
Finally, we observed a significant reduction in sensor sensitivity between explanted and new (non-implanted) sensors, as well as an increase in sensor response time to step changes in glucose concentration. (We did not test the sensor sensitivity and response times prior to sensor implantation in order to maintain sensor sterility.) Possible reasons for the observed changes in sensor sensitivity and response time are changes in glucose oxidase activity, as well as changes in permeability of the glucose limiting membrane and/or porous PLLA coating (e.g. from protein adsorption, biofouling, collagen deposition). Overnight soaking in unstirred conditions may not have adequately removed the fouling agents from the sensor surfaces. Severed vessels and collagen deposition within the porous matrix could further limit glucose diffusion during ex vivo testing 36.
Caveats
Capillary diameter in subcutaneous tissue is approximately 5μm 37-40, while less than 5% of microvessel diameters measured beneath the window in this study were less than 6μm. This discrepancy suggests that microvessel structures less than 10μm were difficult to resolve, and cumulative vessel length was under-reported in this study. A 6.3x objective with low numerical aperture was used to maximize working distance and depth of field; however, resolution may have been compromised. Variability in light intensity was substantial over the entire image preventing the use of a simple (automatic) threshold analysis to quantify microvascularity.
Sensor migration beneath the window was substantial in some rats, which may have been due to animal movement and/or loosening of sutures anchoring the sensor. In most cases, gentle manipulation of the dorsum dermis permitted window repositioning over the migrated sensor. Typically, sensor migration occurred during the first 24 to 48 hours post implantation, after which further sensor migration was minimal. Cyclic sensor motion from animal respiration was minimized for laser Doppler readings and for intravital microscopy by attaching the LDF probe to a ring stand and capturing microscopic images at the end of expiration. Also, LDF acquires most of its signal from 500 to 1,500 microns into the tissue 41, which is much deeper than the tissue observed using intravital microscopy. Therefore, caution is justified in comparing observed microvascularization and tissue perfusion. Nevertheless, laser Doppler flowmetry provides an indication of perfusion within the vicinity of the implanted sensor.
Exudate occasionally accumulated beneath the window following sensor connection to the MiniLink™, possibly stimulated by increased motion experienced by the sensor once connected to the MiniLink™. Exudate also accumulated beneath the window which limited optimal focusing. Resolution was improved by aspirating the accumulated exudate with a syringe inserted several millimeters away from the window to prevent bleeding under the window 18.
Finally, window infection must be minimized by daily topical application of antibiotics around the window perimeter. The antibiotics were not applied to the subcutaneous tissue adjacent to the sensor and it is unlikely that antibiotics would diffuse from the site of application on the skin adjacent to the edge of the window to the viewing area; since that would require traversing through the stratum corneum, through the epidermis, through the dermis, and laterally several millimeters to the site of the sensor observation18.
Future considerations
In this study attempts were made to correlate sensor response with perfusion and clearance of the tissue using injection of a glucose bolus doped with fluorescein. While fluorescein provided an excellent marker for observing vessel patency, conclusions were not be drawn about glucose perfusion of the sensor based on visualizing fluorescein diffusion as these two molecules have different transport mechanisms. Further, diffuse reflectance and autofluorescence spectroscopy into the window chamber model may provide repeatable and non-destructive methods for quantifying tissue changes beneath the window, such as collagen deposition and hemoglobin saturation 42-45.
CONCLUSIONS
The window chamber successfully provided a method for directly visualizing microvessel formation and remodelling in the tissue surrounding implanted sensors. The benefit of tissue integration of a porous coating to promote angiogenesis, which was clearly evident in the fully implanted non-functional sensor studies, was not apparent in the percutaneous functional sensor studies. We postulate that the effect of the porous coating may have been overridden by chronic mechanical irritation of the tissue adjacent to percutaneously implanted functional sensors. While our functional sensor experiments extended beyond the FDA-approved three-day range for the MiniMed sensors, the percutaneously implanted sensors became increasingly subject to animal-related failure that reduced the number of fully-functional sensors at longer time points. Ultimately, longer-term experiments will be needed to better understand why sensor attenuation occurs despite increased angiogenesis at the sensor-tissue interface, regardless of surface topography.
Acknowledgments
These studies were supported by NIH grant DK54932, Duke University Graduate School Dr Lewis Siegel International Fellowship, Medtronic, Inc., and the Robert Jones Fund. The authors also thank Dr Lori Norton for helpful discussion.
References
- 1.Koschwanez HE, Yap FY, Klitzman B, Reichert WM. In vitro and in vivo characterization of porous poly-L-lactic acid coatings for subcutaneously implanted glucose sensors. J Biomed Mat Res. 2008;87A:792–803. doi: 10.1002/jbm.a.31824. [DOI] [PMC free article] [PubMed] [Google Scholar]
- 2.Vajkoczy P, Ullrich A, Menger MD. Intravital fluorescence videomicroscopy to study tumor angiogenesis and microcirculation. Neoplasia. 2000 Jan-Apr;2(1-2):53–61. doi: 10.1038/sj.neo.7900062. [DOI] [PMC free article] [PubMed] [Google Scholar]
- 3.Menger MD, Laschke MW, Vollmar B. Viewing the microcirculation through the window: Some twenty years experience with the hamster dorsal skinfold chamber. European Surgical Research. 2002 Jan-Apr;34(1-2):83–91. doi: 10.1159/000048893. [DOI] [PubMed] [Google Scholar]
- 4.Makale M. Intravital imaging and cell invasion. Integrins. 2007:375–401. doi: 10.1016/S0076-6879(07)26016-1. [DOI] [PubMed] [Google Scholar]
- 5.Makale MT, Chen PC, Gough DA. Variants of the tissue-sensor array window chamber. American Journal of Physiology-Heart and Circulatory Physiology. 2005 Jul;289(1):H57–H65. doi: 10.1152/ajpheart.01001.2004. [DOI] [PubMed] [Google Scholar]
- 6.Makale MT, Lin JT, Calou RE, Tsai AG, Chen PC, Gough DA. Tissue window chamber system for validation of implanted oxygen sensors. 2003 doi: 10.1152/ajpheart.00721.2002. [DOI] [PubMed] [Google Scholar]
- 7.Papenfuss HD, Gross JF, Intaglietta M, Treese FA. Transparent Access Chamber for the Rat Dorsal Skin Fold. Microvascular Research. 1979;18(3):311–318. doi: 10.1016/0026-2862(79)90039-6. [DOI] [PubMed] [Google Scholar]
- 8.Ertefai S, Gough DA. Physiological Preparation for Studying the Response of Subcutaneously Implanted Glucose and Oxygen Sensors. Journal of Biomedical Engineering. 1989;11(5):362–368. doi: 10.1016/0141-5425(89)90097-6. [DOI] [PubMed] [Google Scholar]
- 9.Makale MT, Lin JT, Calou RE, Tsai AG, Chen PC, Gough DA. Tissue window chamber system for validation of implanted oxygen sensors. American Journal of Physiology-Heart and Circulatory Physiology. 2003 Jun;284(6):H2288–H2294. doi: 10.1152/ajpheart.00721.2002. [DOI] [PubMed] [Google Scholar]
- 10.Sorg BS, Moeller BJ, Donovan O, Cao YT, Dewhirst MW. Hyperspectral imaging of hemoglobin saturation in tumor microvasculature and tumor hypoxia development. Journal of Biomedical Optics. 2005 Jul-Aug;10(4) doi: 10.1117/1.2003369. [DOI] [PubMed] [Google Scholar]
- 11.Shan SQ, Sorg B, Dewhirst MW. A novel rodent mammary window of orthotopic breast cancer for intravital microscopy. Microvascular Research. 2003 Mar;65(2):109–117. doi: 10.1016/s0026-2862(02)00017-1. [DOI] [PubMed] [Google Scholar]
- 12.Menger MD, Walter P, Hammersen F, Messmer K. Quantitative-Analysis of Neovascularization of Different Ptfe-Implants. European Journal of Cardio-Thoracic Surgery. 1990;4(4):191–196. doi: 10.1016/1010-7940(90)90003-i. [DOI] [PubMed] [Google Scholar]
- 13.Algire GH. An adaptation of the transparent chamber technique to the mouse. Journal of the National Cancer Institute. 1943 Aug-Jun;4:1–11. [PubMed] [Google Scholar]
- 14.Laschke MW, Haufel JM, Thorlacius H, Menger MD. New experimental approach to study host tissue response to surgical mesh materials in vivo. Journal of Biomedical Materials Research Part A. 2005 Sep;74A(4):696–704. doi: 10.1002/jbm.a.30371. [DOI] [PubMed] [Google Scholar]
- 15.Laschke MW, Witt K, Pohlemann T, Menger MD. Injectable nanocrystalline hydroxyapatite paste for bone substitution: In vivo analysis of biocompatibility and vascularization. Journal of Biomedical Materials Research Part B-Applied Biomaterials. 2007 Aug;82B(2):494–505. doi: 10.1002/jbm.b.30755. [DOI] [PubMed] [Google Scholar]
- 16.Gaber MW, Yuan H, Killmar JT, Naimark MD, Kiani MF, Merchant TE. An intravital microscopy study of radiation-induced changes in permeability and leukocyte-endothelial cell interactions in the microvessels of the rat pia mater and cremaster muscle. Brain Research Protocols. 2004;13(1):1–10. doi: 10.1016/j.brainresprot.2003.11.005. [DOI] [PubMed] [Google Scholar]
- 17.Tomita Y, Kubis N, Calando Y, Dinh AT, Meric P, Seylaz J, et al. Long-term in vivo investigation of mouse cerebral microcirculation by fluorescence confocal microscopy in the area of focal ischemia. Journal of Cerebral Blood Flow and Metabolism. 2005;25(7):858–867. doi: 10.1038/sj.jcbfm.9600077. [DOI] [PubMed] [Google Scholar]
- 18.Koschwanez H, Klitzman B, Reichert W. Percutaneous window chamber method for chronic intravital microscpy of sensor-tissue interactions. J Diabetes Sci Technol. 2008;2(6):977–983. doi: 10.1177/193229680800200608. [DOI] [PMC free article] [PubMed] [Google Scholar]
- 19.Nam YS, Yoon JJ, Park TG. A novel fabrication method of macroporous biodegradable polymer scaffolds using gas foaming salt as a porogen additive. Journal of Biomedical Materials Research. 2000 Feb;53(1):1–7. doi: 10.1002/(sici)1097-4636(2000)53:1<1::aid-jbm1>3.0.co;2-r. [DOI] [PubMed] [Google Scholar]
- 20.Gilligan B, Shults MC, Rhodes RK, Jacobs PG, Brauker JH, Pintar TJ, Updike SJ. Feasibility of continuous long-term glucose monitoring from a subcutaneous glucose sensor in humans. Diabetes Technol Ther. 2004;6(3):378–386. doi: 10.1089/152091504774198089. [DOI] [PubMed] [Google Scholar]
- 21.Updike SJ, Shults MC, Rhodes RK, Gilligan BJ, Luebow JO, von Heimburg D. Enzymatic Glucose Sensors - Improved Long-Term Performance In Vitro and In Vivo. ASAIO Journal. 1994;40:157–163. [PubMed] [Google Scholar]
- 22.Brauker JH, Carrbrendel VE, Martinson LA, Crudele J, Johnston WD, Johnson RC. Neovascularization of Synthetic Membranes Directed by Membrane Microarchitecture. Journal of Biomedical Materials Research. 1995 Dec;29(12):1517–1524. doi: 10.1002/jbm.820291208. [DOI] [PubMed] [Google Scholar]
- 23.Ward WK, Slobodzian EP, Tiekotter KL, Wood MD. The effect of microgeometry, implant thickness and polyurethane chemistry on the foreign body response to subcutaneous implants. Biomaterials. 2002 Nov;23(21):4185–4192. doi: 10.1016/s0142-9612(02)00160-6. [DOI] [PubMed] [Google Scholar]
- 24.Sharkawy AA, Klitzman B, Truskey GA, Reichert WM. Engineering the tissue which encapsulates subcutaneous implants. II. Plasma-tissue exchange properties. Journal of Biomedical Materials Research. 1998 Jun;40(4):586–597. doi: 10.1002/(sici)1097-4636(19980615)40:4<586::aid-jbm10>3.0.co;2-e. [DOI] [PubMed] [Google Scholar]
- 25.Sharkawy AA, Klitzman B, Truskey GA, Reichert WM. Engineering the tissue which encapsulates subcutaneous implants .1. Diffusion properties. Journal of Biomedical Materials Research. 1997 Dec;37(3):401–412. doi: 10.1002/(sici)1097-4636(19971205)37:3<401::aid-jbm11>3.0.co;2-e. [DOI] [PubMed] [Google Scholar]
- 26.Marshall AJ, Irvin CA, Barker T, Sage EH, Hauch KD, Ratner BD. Biomaterials with tightly controlled pore size that promote vascular in-growth. Abstracts of Papers of the American Chemical Society. 2004 Aug;228:U386–U386. [Google Scholar]
- 27.Updike SJ, Shults MC, Gilligan BJ, Rhodes RK. A subcutaneous glucose sensor with improved longevity, dynamic range, and stability of calibration. Diabetes Care. 2000 Feb;23(2):208–214. doi: 10.2337/diacare.23.2.208. [DOI] [PubMed] [Google Scholar]
- 28.Vonrecum AF. Applications and Failure Modes of Percutaneous Devices – a Review. Journal of Biomedical Materials Research. 1984;18(4):323–336. doi: 10.1002/jbm.820180403. [DOI] [PubMed] [Google Scholar]
- 29.Von Recum AF. New aspects of biocompatibility: motion at the interface. In: Heimke G, Soltesz U, Lee A, editors. Clinical implant materials, advances in biomaterials. Amsterdam: Elsevier Science Publishers BV; 1990. pp. 297–302. [Google Scholar]
- 30.Picha GJ, Drake RF. Pillared-surface microstructure and soft-tissue implants: Effect of implant site and fixation. Journal of Biomedical Materials Research. 1996;30(3):305–312. doi: 10.1002/(SICI)1097-4636(199603)30:3<305::AID-JBM5>3.0.CO;2-U. [DOI] [PubMed] [Google Scholar]
- 31.Mooney V, Schwartz SA, Roth AM, Gorniowsky MJ. Percutaneous Implant Devices. Annals of Biomedical Engineering. 1977;5(1):34–46. doi: 10.1007/BF02409337. [DOI] [PubMed] [Google Scholar]
- 32.Jackson JR, Seed MP, Kircher CH, Willoughby DA, Winkler JD. The codependence of angiogenesis and chronic inflammation. Faseb Journal. 1997;11(6):457–465. [PubMed] [Google Scholar]
- 33.Dungel P, Long N, Yu B, Moussy Y, Moussy F. Study of the effects of tissue reactions on the function of implanted glucose sensors. Journal of Biomedical Materials Research. 2008;85A(3):699–706. doi: 10.1002/jbm.a.31593. [DOI] [PubMed] [Google Scholar]
- 34.Hilderbrandt I, Su H, Weber W. Anesthesia and other considerations for in vivo imaging of small animals. ILAR Journal. 2008;49(1):17–26. doi: 10.1093/ilar.49.1.17. [DOI] [PubMed] [Google Scholar]
- 35.Saha JK, Xia JQ, Grondin JM, Engle SK, Jakubowski JA. Acute hyperglycemia induced by ketamine/xylazine anesthesia in rats: Mechanisms and implications for preclinical models. Exp Biol Med. 2005 Nov;230(10):777–784. doi: 10.1177/153537020523001012. [DOI] [PubMed] [Google Scholar]
- 36.Dungel P, Long N, Yu B, Moussy Y, Moussy F. Study of the effects of tissue reactions on the function of implanted glucose sensors. Journal of Biomedical Materials Research Part A. 2008 Jun;85A(3):699–706. doi: 10.1002/jbm.a.31593. [DOI] [PubMed] [Google Scholar]
- 37.Mian R, Marshall JM. Responses Observed in Individual Arterioles and Venules of Rat Skeletal-Muscle During Systemic Hypoxia. Journal of Physiology-London. 1991;436:485–497. doi: 10.1113/jphysiol.1991.sp018562. [DOI] [PMC free article] [PubMed] [Google Scholar]
- 38.Taguchi Y, Takashima S, Sasahara E, Inoue H, Ohtani O. Morphological changes in capillaries in the ischemic brain in Wistar rats. Archives of Histology and Cytology. 2004;67(3):253–261. doi: 10.1679/aohc.67.253. [DOI] [PubMed] [Google Scholar]
- 39.Kano Y, Shimegi S, Furukawa H, Matsudo H, Mizuta T. Effects of aging on capillary number and luminal size in rat soleus and plantaris muscles. Journals of Gerontology Series a-Biological Sciences and Medical Sciences. 2002;57(12):B422–B427. doi: 10.1093/gerona/57.12.b422. [DOI] [PubMed] [Google Scholar]
- 40.Wikipedia, The Free Encyclopedia. Wikimedia Foundation, Inc.; 2009. Capillary. [cited Jan 2009]; Available from: http://en.wikipedia.org/wiki/Capillary. [Google Scholar]
- 41.Laserflo BPM2 Blood Perfusion Monitor Operator Manual. Vasamedics, Inc.; 1991. [Google Scholar]
- 42.Breslin TM, Xu F, Palmer GM, Zhu C, Gilchrist KW, Ramanujam N. Autofluorescence and Diffuse Reflectance Properties of Malignant and Benign Breast Tissues. Ann Surg Oncol 2004. 2004 January 1;11(1):65–70. doi: 10.1007/BF02524348. [DOI] [PubMed] [Google Scholar]
- 43.Ramanujam N. Fluorescence spectroscopy of neoplastic and non-neoplastic tissues. Neoplasia. 2000 Jan-Apr;2(1-2):89–117. doi: 10.1038/sj.neo.7900077. [DOI] [PMC free article] [PubMed] [Google Scholar]
- 44.Brown JQ., PhD . Personal communication. Duke University; 2007. [Google Scholar]
- 45.Gill EM, Palmer GM, Ramanujam N. Steady-state fluorescence imaging of neoplasia. Biophotonics, Pt B. 2003:452–481. doi: 10.1016/s0076-6879(03)61023-2. [DOI] [PubMed] [Google Scholar]