

Summary
The Aer receptor monitors internal energy (redox) levels in Escherichia coli with an FAD-containing PAS domain. Here, we randomly mutagenized the region encoding residues 14 to 119 of the PAS domain and found 72 aerotaxis-defective mutants, 24 of which were gain-of-function, signal-on mutants. The mutations were mapped onto an Aer homology model based on the structure of the PAS-FAD domain in NifL from Azotobacter vinlandii. Signal-on lesions clustered in the FAD binding pocket, the β-scaffolding and in the N-cap loop. We suggest that the signal-on lesions mimic the “signal-on” state of the PAS domain, and therefore may be markers for the signal-in and signal-out regions of this domain. We propose that the reduction of FAD rearranges the FAD binding pocket in a way that repositions the β-scaffolding and the N-cap loop. The resulting conformational changes are likely to be conveyed directly to the HAMP domain, and on to the kinase control module. In support of this hypothesis, we demonstrated disulfide band formation between cysteines substituted at residues N98C or I114C in the PAS β-scaffold and residue Q248C in the HAMP AS-2 helix.
Keywords: aerotaxis, bacterial chemotaxis, PAS signaling, FAD
Introduction
In Escherichia coli, the Aer receptor orchestrates oxygen-seeking behavior (aerotaxis) by monitoring intracellular redox status (Taylor et al., 1999, Taylor, 2007). The Aer redox sensor is an FAD-binding PAS [Per ARNT Sim; (Nambu et al., 1991)] domain (Bibikov et al., 2000, Repik et al., 2000) that is a member of the PAS superfamily of more that 14,000 proteins (http://smart.embl-heidelberg.de/) found in all kingdoms of life. These domains have diverse functions, and may act as oxygen, light and redox sensors (Zhulin et al., 1997, Taylor & Zhulin, 1999), mediators of protein-protein interaction (Huang et al., 1993) and transcriptional activators (Kewley et al., 2004).
The Aer PAS domain is cytosolic, and interacts directly with a HAMP domain that is separated in sequence from the PAS domain by two transmembrane segments (Herrmann et al., 2004, Watts et al., 2004, Amin et al., 2006) (Fig. 1). HAMP domains comprise a superfamily of versatile modules that transduce various signals into a common signal that is transmitted to the output domain of a receptor (Aravind & Ponting, 1999). In both Aer and in chemoreceptors, the output domain is a kinase control module, which activates the autophosphorylation of a CheA histidine kinase and the response regulator CheY-P, causing a change in the direction of flagellar rotation and tumbling (Hazelbauer et al., 2008). Signal transduction in Aer begins with the reduction of FAD, which appears to initiate a conformational signal that propagates through the cytoplasmic PAS domain to an interface with the HAMP domain (Watts et al., 2004), and on to the distal kinase control module. Although many residues have been identified in the Aer-PAS domain that are critical for FAD binding (Bibikov et al., 2000, Repik et al., 2000, Burón-Barral et al., 2006, Watts et al., 2006), it is not known how signals propagate from the FAD-binding cavity to the surface, and on to the HAMP domain. In the nitrogen fixation regulator NifL from Azotobacter vinlandii [AvNifL (Key et al., 2007)], the photoreceptor Vivid from Neurospora crassa (Zoltowski et al., 2007) and the methane monooxygenase MmoS from Methylococcus capsulatus (Ukaegbu & Rosenzweig, 2009), the protonation of FAD leads to the reorganization of hydrogen bonds within the FAD binding site and a conformational change within the PAS domain.
Fig. 1.

Model of the domain organization of an Aer dimer. Structures were modeled in silico with Swiss-Model (Kiefer et al., 2009) based on PAS-A from AvNifL [2GJ3 (Key et al., 2007); Aer-PAS: cyan], Af1503 HAMP [2ASW (Hulko et al., 2006); Aer-HAMP: blue] and the cytoplasmic domain from a Thermatoga maritima receptor [2CH7 (Park et al., 2006); Aer-kinase control module: yellow]. The membrane anchor is based on disulfide crosslinking studies [yellow, (Amin et al., 2007, Amin et al., 2006)]. The PAS domains are linked to the membrane anchor via a forty-five amino acid F1 tether (not drawn); the HAMP domain begins immediately following the membrane anchor.
Data from a previous study indicates that the N-terminal cap (N-cap) may have a role in Aer signaling, as removing part of the cap (residues 1–14) creates a conformational change that mimics the signal-on state of the receptor (Watts et al., 2004). To identify other critical regions involved in Aer-PAS signaling, we have now randomly mutagenized the remaining coding sequence of the Aer-PAS domain. We isolated both loss-of-function and gain-of-function mutants, and found that lesions mimicking the signal-on state of the receptor clustered in specific regions, including the N-cap loop. We propose that the high degree of localization may define a signaling pathway within the Aer-PAS domain.
Results
Isolation of Aer-PAS mutants
To identify critical residues for signaling in the Aer-PAS domain, we randomly introduced single amino acid substitutions in the PAS domain (residues 14 to 119) using low fidelity PCR to make copies of the aer gene with Taq DNA polymerase (which favors transition mutations). We also mutagenized aer with Mutazyme® II DNA polymerase, which increases the rate of transversions (Vanhercke et al., 2005). Plasmid-derived mutant proteins were expressed in BT3388 cells that lack Aer and all chemoreceptors [aer tsr tar tap trg (Yu et al., 2002)]. Colonies were screened for aerotaxis in Tryptone semi-solid agar miniswarm plates and confirmed on Tryptone semi-solid agar plates (Fig. 2). Expression of the complete Aer protein was confirmed by Western blot and mutants with poor protein expression were discarded. Using this method, we screened 10,000 colonies, sequenced 400 plasmids that expressed full-length but aberrant products, and obtained 72 aerotaxis-defective mutant proteins that had single amino acid substitutions at 48 of 105 residues in the Aer-PAS domain (Fig. 3A).
Fig. 2.

Aerotaxis phenotypes of Aer mutants in Tryptone and succinate semi-solid agar. A. Aer mutant proteins were expressed in the receptorless strain, BT3388 (aer tsr tar tap trg), and colonies were inoculated into Tryptone semi-solid agar containing 50 µg ml−1 ampicillin and IPTG ranging from 20 to 1000 µM. Plates were incubated at 30°C for 16 h and the colony morphologies were compared with positive (wild-type Aer) and negative (vector) aerotaxis controls. Examples shown are for plasmids pKW1 (wild-type Aer), pKW1-G76E (leaky), pKW1-Y93C (null) and pTrc99A (vector).
B. Plasmids isolated from aerotaxis-defective colonies in (A) were introduced into BT3312 (aer tsr) to test for functional rescue by Tar. Colonies were inoculated into succinate semi-solid agar containing 50 µg ml−1 ampicillin and IPTG ranging from 0 to 1000 µM, and plates were incubated at 30°C for 18 to 19 h. Examples shown are for plasmids pKW1 (wild-type Aer), pKW1-S80I (rescued) and pKW1-Y93C (non-rescued), and pTrc99A (vector).
Fig. 3.

Signaling phenotypes and steady state concentrations of Aer mutant proteins. A. Amino acid substitutions that produced signal-on (above line), signal-on-biased (above line, circled), and signal-off (below line) phenotypes are mapped onto the secondary structural elements of the Aer PAS domain. Aer mutant proteins that were phenotypically rescued by Tar (see text) at low (*) or high (°) Aer expression levels are marked with an asterisk or superscripted circle, respectively. For secondary structure, cylinders represent helices, arrows represent β strands, and lines represent loops.
B. Steady state concentrations of the Aer mutant proteins relative to wild-type Aer when induced with 50 µM IPTG in the receptorless strain BT3388 (see Experimental Procedures). Mutant Aer proteins that were present at less than 50% (upper line) of wild-type Aer may be unstable. Degradation rates were determined for mutant proteins with steady state concentrations below 30% (lower line).
Mutant phenotypes
The signal output of wild-type Aer expressed from a plasmid causes E. coli cells to swim smoothly in air and to tumble in nitrogen (an anaerobic environment) (Rebbapragada et al., 1997). Tumbling reflects the “signal-on” conformation [clockwise (CW) flagellar rotation] and smooth-swimming reflects the “signal-off” or null phenotype of Aer [counterclockwise (CCW) flagellar rotation] (Repik et al., 2000). To further characterize the signaling activity of the mutant Aer proteins, we analyzed the swimming behavior of receptorless cells expressing the mutant proteins. We grew cells in Tryptone broth and induced protein expression with 200 µM IPTG, then monitored the cells under a dark-field microscope for behavioral responses as the gases in the perfusion chamber were toggled between nitrogen and air. The mutants displayed one of three phenotypes: smooth swimming cells that did not tumble in nitrogen [48 mutants; signal-off receptor state], elevated tumbling frequency in air and nitrogen (3 mutants; signal-on biased), constantly tumbling in air and nitrogen (21 mutants; signal-on receptor state)(Fig. 3A).
We tested for partial function in spatial assays on Tryptone semi-solid agar plates by incrementally increasing the expression of the mutant Aer proteins (20 to 1000 µM IPTG) (Fig. 2A). As Aer expression increased, four signal-off PAS mutants regained aerotaxis activity and produced larger colonies in Tryptone semi-solid agar with an outer aerotaxis band. These mutants with partial loss-of-function included Aer-L48S, Aer-T72I, Aer-G76E and Aer-E77G. The remaining signal-off mutants, the tumbling-biased mutants, and the signal-on mutants, were non-aerotactic at all induction levels up to 1 mM IPTG.
Some defective Aer proteins can be functionally rescued by the presence of the high abundance chemoreceptor, Tar (Burón-Barral et al., 2006, Gosink et al., 2006), indicating that these aberrant Aer receptors retain some input/output control. The mechanism of rescue appears to be a combination of Tar influence on swimming bias as well as the ability of Tar to exert compensatory effects through direct interactions with Aer within a mixed trimer-of-dimers (Gosink et al., 2006). To test for phenotypic rescue, mutant Aer proteins were expressed in cells that contain Tar but lack the aerotaxis transducers Aer and Tsr (BT3312, aer tsr) (Fig. 2B). We did not test for rescue by Tsr, because Tsr (in addition to sensing serine) responds to changes in the proton motive force, and thereby also functions as an aerotaxis receptor in E. coli (Rebbapragada et al., 1997, Edwards et al., 2006). In the presence of Tar, 39 of the remaining Aer mutant proteins regained aerotactic responses without Aer induction by IPTG (Fig. 3A, indicated with asterisks), while 6 of the signal-off mutants regained function after induction with IPTG (20 to 100 µM IPTG; Fig. 3A, indicated with a superscripted “o”). The remaining 23 mutant proteins (6 signal-on and 17 signal-off mutants) did not regain aerotactic responses in the presence of Tar, even when overexpressed. Notably, all six non-rescued CW substitutions were at amino acids predicted to face inward towards the FAD cleft, and therefore may influence the flavin environment. Presumably, these non-rescuable mutant receptors had more severe lesions than those that were rescued by Tar; yet, in the absence of Tar, there was no quantifiable difference between the outputs of these signal-on mutant Aer receptors when compared to those that were not rescued.
We studied the phenotypic interactions between mutant Aer receptors and wild-type Aer expressed from a compatible plasmid. The 23 mutant proteins that were not rescued by Tar were expressed from an IPTG inducible pTrc99A-derived plasmid (pKW1) and wild-type Aer was expressed from a salicylate inducible pACYC184-derived plasmid (pDS7). Expression of the Aer mutants was induced with IPTG concentrations between 20 µM and 1000 µM, while wild-type Aer was concomitantly induced with 0.5 µM or 1 µM sodium salicylate. When wild-type and mutant Aer proteins were expressed at a 1:1 ratio, three of the six signal-on mutant proteins (A97D, N85S and S113T) were dominant, and completely inhibited aerotaxis by wild-type Aer. At higher expression levels, Aer-L20Q and Aer-N85D became dominant; Aer-H53Y, which was partially dominant, eliminated the aerotactic band, but there was a partial increase in the size of the wild-type colony compared to cells with dominant Aer mutations. In contrast, only one of the signal-off mutant proteins (N34K) altered wild-type Aer-mediated aerotaxis; it reduced the colony size without eliminating the band (i.e., it was partially dominant). Since chemoreceptors in E. coli form trimers of receptor dimers (Ames et al., 2002, Gosink et al., 2006), mutant Aer proteins that are dominant or partially dominant may interfere with the normal structure of trimers of dimers formed with wild-type Aer. Alternately, the mutant proteins may have such a strong CW bias that wild-type Aer cannot modulate it.
Stability of altered Aer proteins
Strains with a null Aer phenotype may have varying underlying defects in addition to those that lock the signaling pathway into the “off” state. These include structural changes in the native fold that affect FAD binding, maturation (folding) of the nascent peptide and/or an increase in the rate of degradation (Watts et al., 2004, Burón-Barral et al., 2006). To distinguish between these possibilities, we first determined the steady state levels of the PAS mutant proteins by comparing the cellular levels of mutant protein to those of wild-type Aer expressed from the pKW1 plasmid after induction with 50 µM IPTG (Fig. 3B). The steady state expression levels ranged from 10% to 130% of wild-type Aer. Two thirds of the proteins were present at 50% or more of wild-type Aer levels. As previously observed (Burón-Barral et al., 2006), some PAS lesions markedly increased the rate of Aer degradation. Seven mutant proteins (one signal-on and six signal-off) had steady state levels below 30%, and we measured the degradation rates of these proteins. We induced mutant protein expression in receptorless cells (BT3388) with 50 µM IPTG, then inhibited new protein synthesis with chloramphenicol and measured the rate of protein loss over a 4 h period. Using this method, wild-type Aer showed a low initial degradation rate of 0.007/min and little subsequent degradation (Fig. 4). In contrast, the Aer-PAS mutant proteins had enhanced rates of initial degradation ranging from 0.0107/min to 0.213/min, which was followed by a longer period of slower degradation. The initial rapid degradation may represent degradation of slow-folding proteins (Burón-Barral et al., 2006), which become more resistant to proteolysis once folded. Those mutant proteins with the highest degradation rates had substitutions that altered the hydrophobicity of native amino acids. These lesions included M21K, D25V and D35V, and they apparently caused serious structural defects that hindered maturation, as the mutant proteins were rapidly proteolyzed with rates of 0.213/min, 0.1952/min and 0.2039/min respectively. When mapped onto an Aer-PAS model, these and the other highly unstable replacements mapped to positions on or near loops (see below).
Fig. 4.

Degradation profiles for Aer mutant proteins having steady-state concentrations below 30% of wild-type Aer. Samples were collected at selected time points after blocking new protein synthesis with chloramphenicol, and Aer levels were quantitated by Western blot. The degradation curves represent best-fit values for a two-phase exponential decay, and the values shown are fractional concentrations relative to wild-type Aer.
Residues affecting FAD binding
The binding site for cofactors in many PAS domains, including the FAD cofactor in AvNifL, is in a cavity formed by the EF loop and/or F helix, and the β-scaffold (Borgstahl et al., 1995, Gong et al., 1998, Kay, 1997, Key et al., 2007). Previously, we found that several signal-off lesions in Aer appeared to abolish FAD binding, and when these lesions were mapped onto an Aer-PAS homology model, they clustered in the EF loop (Repik et al., 2000). To test the signal-off mutant proteins for FAD binding in the current study, we measured the increase in total cellular FAD in BT3388 after overexpressing Aer with 1 mM IPTG (Bibikov et al., 2000, Repik et al., 2000). This assay requires high levels of Aer protein expression and requires an increase in cellular FAD of 20% or more to infer binding. False negatives for FAD binding may result from low expression of a mutant protein (Burón-Barral et al., 2006). As a precaution, mutant proteins with steady state levels below 30% of wild-type Aer were excluded from the FAD assay.
Using this method, half (22/42) of the signal-off mutant proteins with steady state levels above 30% had FAD binding defects, although 12 of these had steady state levels less than 50% of wild-type Aer, and could possibly be false negatives. Eight of these lesions mapped to the FAD binding pocket. The 10 remaining FAD-minus Aer proteins had steady state levels more than 50% of wild-type Aer, but their substitutions were not associated with the FAD pocket. In addition to these signal-off mutant proteins, three of the signal-on mutant proteins that were predicted to face the FAD binding pocket exhibited poor FAD binding (H53Y, M69K and S113T). Two of the replacements were not rescued by Tar, supporting the notion that the signal-on state was generated by these substitutions independent of FAD binding. However, the other replacement (M69K) was rescued by Tar, indicating that it still retained some input/output ability, and that the low values for FAD binding were more likely a reflection of compromised stability (53% expression). Taken together, these data indicate that residues outside of the FAD binding pocket can stabilize FAD binding, but suggest that lesions within the FAD binding pocket may cause greater structural defects and degradation of the Aer protein.
Mapping lesions onto the Aer-PAS domain model
PAS lesions were mapped onto a homology model of the Aer-PAS domain created using the coordinates of the recently resolved crystal structure of the PAS-FAD domain AvNifL [2GJ3; (Key et al., 2007)]. Substitutions that promoted a rapid proteolysis of Aer (T19A, M21K, D25V, D35V, V95A, P101L and G110D) mapped to positions on or near loops and, with one exception, yielded a CCW (signal-off) phenotype (Fig. 3A). The loops associated with these lesions were distributed throughout the PAS domain (data not shown) and we postulate that the lesions disrupted critical turns in the PAS fold. Eight of the FAD-binding lesions mapped to positions at or near the putative FAD binding site within the E helix, EF loop, the F helix and the Gβ strand (not shown).
In the absence of a functional PAS domain, the null phenotype of the Aer receptor is “signal-off”, and the Aer HAMP domain is dependent on an “on” signal from the PAS domain to activate the kinase control module (kinase-on state) and trigger CheA histidine kinase autophosphorylation (K. Gosink and J.S. Parkinson, personal communication). Accordingly, mutants with “signal-on” (CW) PAS lesions are gain-of-function mutants (Burón-Barral et al., 2006), and these mutants must in some way mimic the signal-on state of the native PAS domain. Given that the Aer-PAS domain signals directly to the HAMP domain, we infer that the signal-on PAS mutants can invoke a conformation that mimics the “on- state” at a PAS-HAMP interface. When the signal-on lesions were viewed on a surface model the substitutions were not distributed uniformly over the surface, but clustered specifically at the FAD insertion site, on the backside of the FAD pocket, and on the N-cap loop (Fig. 5A). This suggests that the most significant conformational changes in the signal-on state may occur in these regions, in which case their location might be used as markers for the signaling pathway within the PAS domain. We postulate that the signal originates in the FAD-binding cavity and a resulting conformational change is transmitted to the β-scaffold and N-cap, which communicate these changes to the HAMP domain.
Fig. 5.
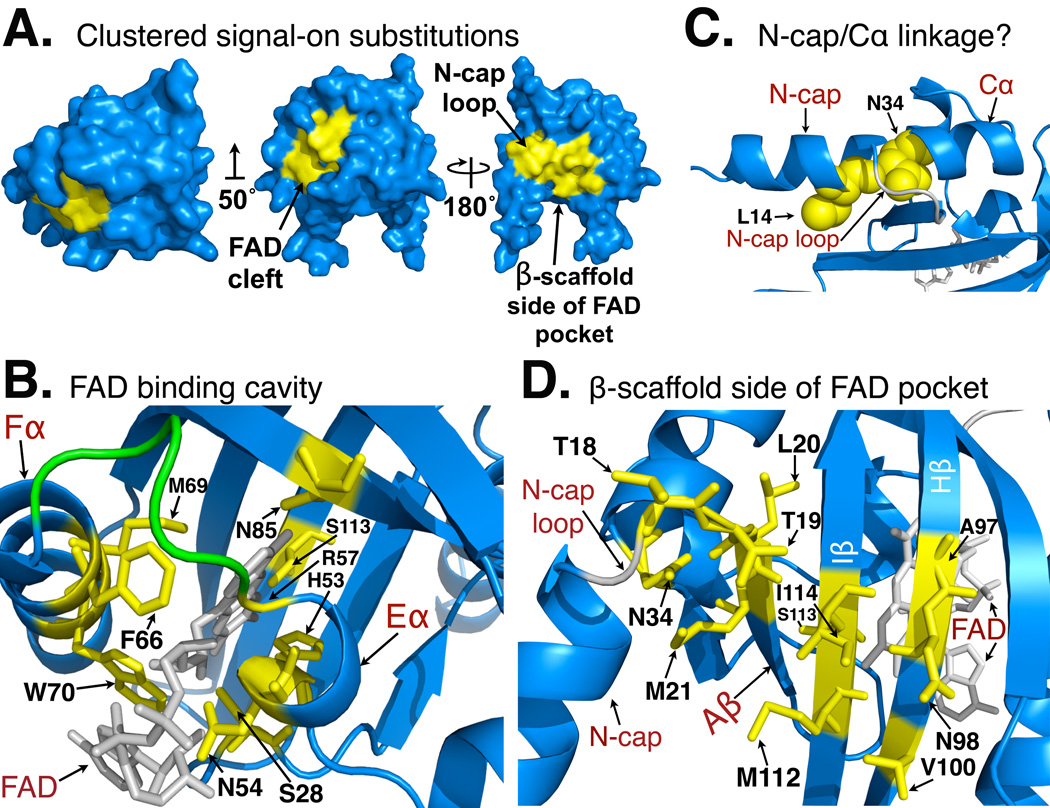
Surface and ribbon views of a homology model for the Aer-PAS domain showing clustering of the 23 signal-on lesions isolated in this study. The model was built using Swiss-Model, based on the coordinates of PAS-A from AvNifL [2GJ3; (Kiefer et al., 2009, Key et al., 2007).
A. Surface view of the front of FAD pocket showing signal-on lesions (yellow) clustered in a patch in and around the FAD binding pocket (left and middle model). Surface view of the PAS domain (right model, rotated 180° about y-axis from middle model), showing the remaining signal-on lesions (yellow) clustered at the back of the FAD pocket, and near the N-cap loop. The orientations of the PAS domain in the left and right models are retained in 5B and 5D, respectively. The middle model is rotated 50° about the x-axis (from the left model) to reveal all clustered surface residues on this face.
B. Ribbon model viewed from the top of the FAD binding cavity showing the side-chains of native residues replaced in signal-on lesions (yellow), and their proximity to FAD (gray). The EF loop [colored green, except for R57 (yellow)] is conserved as RHPDMP in the PAS_FAD1 (Aer) subfamily. The orientation is identical to the left model in 5A.
C. Ribbon model showing residues L14 and N34. A hydrogen bond between homologous residues in AvNifL may stabilize the N-cap loop. This gives the appearance of a continuous helix from the N-cap to Cα, despite 19 intervening residues (the N-cap loop is highlighted in gray). In Aer, thirteen amino acid replacements at this site are CW-biased, signal-on mutants (A. Rodgers-Miller and K. Watts, unpublished). The potential role of N34 in signaling to the HAMP is discussed in the text.
D. Ribbon model of the PAS domain viewed from behind the FAD binding cleft showing the remaining locations (yellow sticks) of the signal-on lesions isolated in this study. The model includes residue N34 (panel C), and I114, where a Cys replacement generated a signal-on phenotype and crosslinked with residue Q248C in the HAMP AS-2 [(Campbell, 2010); Fig. 6]. The orientation is similar to that of the right model in 5A.
Support for direct contact between the PAS β-scaffold and the HAMP domain
The proposed PAS-HAMP signaling pathway predicts that residues in the β-scaffold and possibly the N-cap region make direct contact with the HAMP domain. Residues N98 and I114 on the β-scaffold were prime candidates for interaction with the HAMP domain because substitutions at these residues produced a signal-on phenotype (Fig. 3 and Table S1) and their side-chains were predicted to project into the solvent where they might contact HAMP residues (Figs. 5D and 6). Residue Q248 in the HAMP domain was chosen as a candidate for PAS interactions from an on-going study of the surface accessibility in the HAMP region (K. Watts, unpublished observation). In preliminary experiments exploring direct interactions between the PAS and HAMP domains, we constructed the double cysteine mutants Aer-N98C/Q248C and Aer-I114C/Q248C, expressed the modified receptors in BT3312 (aer tsr), tested for function, and then looked for disulfide crosslinking after oxidation of Aer in vivo (Taylor et al., 2007). Aer I114C had a signal-on phenotype (Table S1) that was rescued by Tar in strain BT3312, and BT3312 cells expressing either Aer-I114C/Q248C or Aer-N98C/Q248C had a normal aerotaxis phenotype. When oxidized with copper phenanthroline, PAS domain substitutions N98C and I114C crosslinked with Q248C in the HAMP AS-2 helix (Fig. 6). Since the di-Cys-substituted Aer proteins mediated normal aerotaxis responses, we infer that the mutant proteins assume a native fold where there is close proximity between the β-scaffolding and the HAMP domain. This supports an aerotaxis-signaling pathway leading from the FAD-binding site in the PAS domain to the β-scaffold and on to the AS-2 helix of the HAMP domain.
Fig. 6.

Crosslinking between residues in the Aer-PAS β-scaffolding and the Aer-HAMP AS-2 helix.
A. Western blot showing disulfide band formation between substitutions I114C in the PAS domain and Q248C in the HAMP AS-2 helix in response to the oxidant copper phenanthroline. Some crosslinking between cognate I114C residues occurred (lane 1) during maturation (it decreased in the presence of chloramphenicol; not shown), and it was absent in the Aer-I114C/Q248C double-replacement protein (lane 2). The extent of Q248C/Q248C crosslinking was approximately 1%. The mobility of the disulfide products indicated that PAS/HAMP contacts occurred between monomers rather than within monomers.
B. Extents of crosslinking between replacement Q248C in the HAMP AS-2 helix and either N98C or I114C in the β-scaffolding of the PAS domain. Whole cells were incubated with 600 µM copper phenanthroline for 20 min at 25° C (Taylor et al., 2007).
C. Residues I114 and N98 (red) lie within the signal-on cluster of substitutions (yellow) in the PAS β-scaffolding, supporting the hypothesis that conformational changes in this region are transmitted directly to the HAMP AS-2 helix.
Discussion
Signal-off lesions
In this study, we used random mutagenesis to identify regions in the Aer-PAS domain that are critical for signaling. Many signal-off substitutions were unsurprising in that they mapped to positions of high sequence conservation within the Aer-PAS domain subfamily. This subfamily, called PAS_FAD1, is one of three PAS subfamilies recently defined [(Xie et al., 2010); see description in Table S1]. One of the most conserved regions of the PAS_FAD1 (Aer) subfamily is the RHPDMP motif on the EF loop that forms a surface of the FAD pocket [(Xie et al., 2010); see Table S1; colored green in Fig. 5B]. Lesions in this loop have previously been isolated (Bibikov et al., 2000, Repik et al., 2000), and in the current study, four signal-off substitutions (H58R, D60V, M61K, P62Q) and one signal-on lesion (R57C; colored yellow, Fig. 5B) were in this loop. Substitutions in this region would be expected to disrupt structure and/or alter FAD binding; this was case for D60V, M61K and P62Q, which had low steady state levels (<50% WT; Fig. 3B) and poor FAD binding (data not shown). Sixteen other signal-off mutants had substitutions at residues conserved in both the PAS_FAD1 (Aer) subfamily and in at least one other flavin-binding (non-Aer) PAS domain (Table S1). Since these substitutions (except for W79R, Y93H and Y111N, discussed below) were either unstable or did not bind FAD, they likely caused gross alterations in the native structure of Aer.
Six signal-off substitutions mapped to residues that are common to both PAS_FAD1 (Aer) and PAS_FAD2 (AerC) subfamilies (see Table S1). The latter subfamily, PAS_FAD2, is exemplified by AerC from Azospirillum brasiliense (Xie et al., 2010), and is a group of soluble chemotaxis receptors that contain dual PAS domains and an MCP domain, but no intervening transmembrane sequence. We infer that residues conserved in both of these subfamilies may have critical structural or signaling roles in Aer. One residue, Aer-P101, is conserved in all generic PAS domains (Table S1), and it is therefore likely to be involved in structure rather than function. The P101L substitution was unique in that it was unable to form a stable subpopulation (Fig. 4). On the other hand, Aer-N34, which is also conserved in generic PAS domains, may be involved in both structure and function. N34K was the only dominant signal-off substitution, and the equivalent residue in AvNifL (N51) lies at the N-terminal end of the Cα helix, and hydrogen bonds to the residue corresponding to Aer-L14 on the C-terminal end of the N-cap helix [Figs. 5C and D; see (Key et al., 2007)]. This forms an unusual extended helix that is unbroken in structure, but discontinuous in sequence. If this feature is replicated in Aer, lesions at N34 could perturb the stability of this hydrogen bonding and alter the conformation around the N-cap loop in a way that activates signaling to the HAMP domain. We propose that the region around N34 modulates the signal-out from the Aer-PAS domain, because an N34D signal-on substitution was previously isolated and found to be an allele-specific suppressor of the C253R lesion in the HAMP domain (Watts et al., 2004). Notably, 13 amino acid replacements at this site are CW-biased, signal-on mutants (A. Rodgers-Miller and K. Watts, unpublished), and some of these replacements can be suppressed by substitutions at C253; however, unlike N34D, they are rescued by Tar. In DcuS-PASc, an equivalent substitution (N248D) reorients the N-cap and activates the protein, so it is possible that a similar reorientation occurs in the Aer “PAS-on” state (Etzkorn et al., 2008)
FAD binding site
The 23 signal-on lesions from this study cluster in the pocket surrounding the FAD cofactor, the backside of the FAD pocket (Iβ- and Hβ-strands), and around the loop connecting the N-cap to the PAS core (Aβ-strand and N-cap loop) (Fig. 5A). Residues that were replaced in signal-on lesions (Fig. 3A; Fig. 5B, colored yellow) are shown in relationship to the predicted position of the FAD cofactor on the homology model (Fig. 5B, colored gray). Several of these critical residues are at positions known to be involved in FAD binding in the resolved structures of PAS-FAD domains, such as the AvNifL and MmoS PAS domains [see alignment (Fig. S1) and Table S1]; those that are conserved in Aer are likely to have similar functions (Key et al., 2007, Ukaegbu & Rosenzweig, 2009). Aer-N85 (Fig. 5B) is equivalent to AvNifL-N102 and MmoS-N164, which hydrogen bond to the N3 and O4 atoms of their respective isoalloxazine rings (Key et al., 2007, Ukaegbu & Rosenzweig, 2009, Zoltowski et al., 2007). Feasibly, Aer amino acid replacements N85D, S, and C [Aer-N85C was previously shown to be a signal-on mutant (Repik et al., 2000)] alter these contacts. Tryptophan residue W70 (Fig. 5B) is conserved in all Aer-type proteins, and its presence is now considered diagnostic for predicting whether a given PAS domain binds FAD (Xie et al., 2010). In AvNifL (W87) and MmoS (W149), the equivalent tryptophan forms stacking interactions with the FAD ribose and adenine rings (Key et al., 2007, Ukaegbu & Rosenzweig, 2009), and it therefore may be a critical residue in linking the reduction of FAD to a conformational change in the Aer PAS domain. Another residue that is predicted to face into the FAD-binding cleft is Aer-N54 (Fig. 5B). Although it is conserved in the PAS_FAD1 (Aer) subfamily, it is not conserved in the other PAS subfamilies (Table S1), and in MmoS, the equivalent residue (R133) stabilizes the FAD ribityl chain. Several other signal-on substitutions occurred at residues also predicted to face the FAD molecule, including conserved residues S28, H53, R57, F66, M69 and S113. These residues are within a range where they might interact with FAD directly or via an intermediate water molecule (Fig. 5B). Although the homologous residues of H53, R57, M69 and S113 are believed to have a role in modulating FAD in other PAS-FAD proteins, there is no consensus on their precise role in signaling (see supplemental Table S1).
Two of the signal-on substitutions in the FAD binding cleft (F66L and S28C) replaced residues for which there are no proposed functions in the other resolved PAS domains. In the in silico model (Fig. 5B) the Aer-F66 carbon ring atoms are cIose to the FAD ribityl C5 (2.6 Å) and the isoalloxazine O2 (3.6 Å). Presumably, this arrangement would be altered with Leu, and could in some way influence the signaling state of FAD. The other residue, Aer-S28, is predicted to face inward, with its side chain oxygen close (2.3 Å) to the C8 methyl group of the isoalloxazine ring. However, removing these interactions does not abolish signaling, as an S28G replacement that lacks a side chain acts as a general suppressor of lesions in the HAMP AS-2 subdomain (Watts et al., 2004), likely due to increased protein stability (Gosink et al., 2006). Moreover, Gly, not Ser, is the more conserved amino acid at this position in the PAS_FAD1 (Aer) subfamily. The Cys side chain replacement has a similar volume to Ser, so its effect on the signaling state (signal-on) would more likely be electronic than steric.
Three signal-off lesions (W79S; Y93C; Y111N) were at residues previously proposed to have roles in FAD binding in PAS domains, and may be directly involved in the Aer-PAS signaling pathway. In MmoS, residue W158 (equivalent to Aer-W79) is a potential electron mediator from membrane redox components to W149 (equivalent to Aer-W70) and on to FAD. In AvNifL, Y110 (equivalent to Aer-Y93) and S39 (equivalent to unstable signal-off Aer lesion, S22P) are members of a network of bond donors and acceptors that facilitate uptake and release of protons at N5 of FAD (Key et al., 2007). Finally, Aer-Y111 was previously found to be important in signaling, as an Aer-Y111C replacement caused an inverted response to both air and nitrogen; cells swam smoothly in nitrogen and tumbled in air (Repik et al., 2000).
Role of the β-scaffold in signaling
The remaining signal-on substitutions in the Aer-PAS domain clustered in the Hβ-, Iβ- and Aβ-strands of the β-scaffold as well as in the N-cap loop (yellow, Fig. 5A and D). Since the β-strands form the rear wall of the FAD binding pocket, conformational changes in the pocket could feasibly rearrange these strands in a reversible manner, and substitutions in the strands could mimic the signal-on conformation. In the AvNifL and MmoS PAS domains, rearrangements resulting from FAD reduction lead to a conformational change on the surface of the domain at the Iβ- and Aβ-strands (Key et al., 2007, Ukaegbu & Rosenzweig, 2009), and in the heme-binding PAS domain of BjFixLH, signaling involves the Hβ-strand as well (Gong et al., 1998, Key & Moffat, 2005).
The side-chain positions of these signal-on lesions (on Hβ-, Iβ- Aβ-, and N-cap loop) are shown in Fig. 5D from a vantage point behind the FAD-binding cleft (S113 is included as a guidepost from Fig. 5B). Notably, all residues except A97, S113 and L20 face outward away from the FAD binding pocket (Fig. 5D). Aer-A97 is conserved throughout most of the PAS family, and is not predicted to contact the FAD ring. However, all 9 rotamers of the Asp signal-on replacement (A97D) caused a steric clash in the in silico model (not shown). Residues N98 and V100 are not conserved in PAS domains, but lie on the same Hβ-strand as A97 (Fig. 5D), suggesting that conformational changes in this region invoke a signal-on state. M112 on the neighboring Iβ-strand (Fig. 5D) is not conserved in the PAS_FAD1 (Aer) subfamily, but the equivalent position in AvNifL (L130) packs against the N-cap of the cognate monomer. Notably, it resides next to S113, which is proposed (in MmoS) to bind indirectly to FAD-N5 through a water molecule. In many PAS-receptors the cognate PAS domains interact, and oligomerization is involved in signaling. However, this is not likely in Aer. The native fold of Aer PAS domains must accommodate the HAMP domain, which is a four-helix bundle and therefore must be between the PAS domains. This probably occludes oligomerization of the PAS domains, and would explain the finding that substitutions at N98C or I114C in the β-scaffold can crosslink with Q248C in HAMP AS-2 (Fig. 6). We propose that conformational changes in the PAS domain are conveyed directly to the HAMP domain via alterations in the β-strands. We previously reported that many residues in the N-cap can collide at 23°C but not at 10°C, and that collisions could occur between dimers (Watts et al., 2006). This thermal effect as well as the recent placement of the HAMP domain between PAS β-scaffolds suggests that the N-cap contacts are random collisions that occur by diffusion in the membrane rather than by oligomerization.
Role of N-terminal cap loop
The remaining replacements (T18I, N; T19A; L20P, Q; M21T) mapped on or near the N-cap loop (Fig. 5D), a region that we previously found to be actively involved in Aer signaling (Watts et al., 2006). The N-cap is also involved in signaling in the PAS-FAD domain of other sensory proteins. In Vivid, light activation weakens the hydrogen bonds that fix the N-cap to the PAS core, causing displacement of the N-cap (Zoltowski et al., 2007). In AvNifL, the N-cap interacts with the Iβ- and Aβ-sheets of the cognate monomer, and these interactions may weaken during signaling (Key et al., 2007). Furthermore, in the photoactive yellow protein (PYP), which binds cis-hydroxycinnamic acid, signaling causes a structural change in the β-scaffold that influences an N-terminal loop, changing the N-cap conformation (Pellequer et al., 1998, Harigai et al., 2003).
The N-cap loop is adjacent to the β-scaffold (Fig. 5C), and rearrangement of the β-strands might readily impinge on the loop, and on to the N-cap itself. However, since removing part of the N-cap elicits a signal-on phenotype (Watts et al., 2006), the N-cap could conceivably move away from the PAS core and expose residues that transmit the “on” signal to the HAMP domain (Watts et al., 2004). Given the density of lesions on and around the N-cap loop, it is possible that the N-cap loop acts as a hinge around which the N-cap pivots. In this scenario, the N-cap would pack tightly against the PAS core in the signal-off state, but would be destabilized during the signal-on state. Alternatively, deformations in the N-cap and surrounding regions could be subtle, but still alter interactions between the PAS and HAMP domains in a way that propagates the signal-on state of the receptor.
Proposed mechanism for signaling by the Aer PAS domain
In summary, the signal-on lesions isolated in this study localized in specific regions of the PAS domain, and cysteine substitutions in one of these regions, the PAS scaffold, crosslinked to the AS-2 helix of the HAMP domain. Signal-on substitutions in the FAD pocket indicated that there are similarities between FAD binding in Aer and in NifL, and substitutions in the N-cap loop provided additional support for a role of the N-cap in signaling. Based on these findings, and by inference from NifL and other PAS domains, we propose that the reduction and protonation of FAD elicits a reorganization of the hydrogen bonding network in the FAD binding pocket (Key et al., 2007, Zoltowski et al., 2007), causing structural changes that propagate to the β-strands of the β-scaffold and the N-terminal cap. These conformational changes are then conveyed to the HAMP domain through a PAS-HAMP interface that involves, but may not be limited to, the β-scaffold. The resulting HAMP conformation initiates the kinase-on state in the kinase control module, activating the CheA histidine kinase and altering the direction of flagellar rotation.
Experimental Procedures
Bacterial strains and plasmids
E. coli strains used in this study include BT3388 [(Δaer::erm Δtsr-7021Δtar-tap-5201 trg::Tn10) (Yu et al., 2002)], BT3312 [(Δaer-1 Δtsr-7028 (Repik et al., 2000)] and BT3400 [(Δaer-1 Δtsr-7028 recA::cat) (Watts et al., 2006)]. These strains were derived from E. coli strain RP437, which is wild-type for chemotaxis (Parkinson, 1978).
The plasmids used in this study include pTrc99A (Pharmacia), an isopropyl-β-D-thiogalactopyranoside (IPTG)-inducible ptrc expression vector; pGH1 (Rebbapragada et al., 1997), a pTrc99A derivative expressing wild-type Aer; pKW1 (Watts et al., 2004), a pGH1 derivative containing silent mutations that introduce restriction sites for NheI (codon 14) and BstBI (codon 204); pDS7 (Watts et al., 2006), which expresses wild-type Aer from pACYC184 (Chang & Cohen, 1978) using a tightly regulated sodium salicylate-inducible promoter (pnahG). The pACYC184 plasmid contains a p15A origin of replication, which allows the coexpression of genes with pTrc99A-derived plasmids.
Random mutagenesis and mutant selection
To obtain single amino acid changes in the Aer-PAS domain in the region encoding residues 14 to 119, random PCR mutagenesis was performed using pGH1 and NheIF and BstBIR primers (Watts et al., 2004). Both Taq (Fisher Scientific, Pittsburg, PA) and Mutazyme® II (Agilent Technologies, Santa Clara, CA) DNA polymerases were used. Random PCR mutagenesis using Taq DNA polymerase was carried out under conditions of reduced fidelity (Jung & Spudich, 1998) as previously described (Watts et al., 2004). The Taq-generated DNA fragments were then pooled and purified using a QIAquick® PCR purification column (QIAGEN Inc. Valencia, CA) and subjected to 30 cycles of normal PCR amplification [95°C (30 sec), 59°C (30 sec) and 72°C (30 sec)]. Random PCR mutagenesis using Mutazyme® II DNA polymerase was performed according to the instructions of the Genemorph® II Random Mutagenesis Kit (Agilent Technologies). PCR products obtained by both methods were purified, digested with NheI and BstBI, then gel-purified using a QIAquick gel extraction kit (QIAGEN). The digested fragments were then cloned into pKW1 with the corresponding NheI/BstBI segment removed and then introduced into BT3388 by electroporation.
Transformed BT3388 cells were screened for non-aerotactic colonies in Tryptone miniswarm agar and the phenotypes were confirmed in Tryptone semi-solid agar as previously described (Burón-Barral et al., 2006) except that the Tryptone miniswarm plates had 20 µM IPTG. Aerotaxis phenotypes were viewed using a light box that provided indirect fluorescent light against a black background. Colonies that lacked a sharp outer ring were considered non-aerotactic and were selected for further analysis. Aer expression was confirmed by Western blot analysis using anti-Aer2–166 antisera (Repik et al., 2000) and mutations were confirmed by sequencing the entire aer gene. Mutant proteins with multiple amino acid changes were not included in the study.
Site-directed mutagenesis
Site-directed cysteine mutagenesis was performed according to the instructions of a QuikChange site-directed mutagenesis kit (Stratagene, La Jolla, CA) using pMB1 as the template. Aer expression was confirmed by Western blot analysis using anti-Aer2–166 antisera (Repik et al., 2000), and the expected mutations were confirmed by DNA sequencing.
Behavioral assays
Transformed BT3388 cells were analyzed for aerotaxis in Tryptone semi-solid agar (Taylor, 2007) containing 50 µg ml−1 ampicillin and incremental increases in IPTG from 20 to 1000 µM. Plasmids from aerotaxis-defective mutants were then introduced into BT3312 and assessed in minimal semi-solid agar (Taylor, 2007) containing 30 mM succinate and 50 µg ml−1 ampicillin and titrations of IPTG from 0 to 1000 µM. Aer proteins that did not support aerotaxis in BT3312 (aer tsr) in succinate semi-solid agar with up to 1 mM induction were then expressed in BT3400 and tested for dominant and recessive behavior as previously described (Watts et al., 2006).
Transformed BT3388 cells that were aerotaxis-defective were grown in Tryptone broth at 30°C to early log phase then induced with 200 µM IPTG or 1 mM IPTG. Mutant responses to oxygen were assessed in a gas perfusion chamber as described previously (Rebbapragada et al., 1997).
Steady state protein expression and degradation assays
Transformed BT3388 cells were grown in LB thia medium to mid log phase at 30°C and induced with 50 µM IPTG for 3 h and then Western blotted. The steady state protein levels were determined by comparing the band intensity of each mutant protein with the steady state level of wild-type Aer from pKW1. Densitometry measurements were determined using a UVP Biospectrum 500® Multispectrum Imaging System (Upland, CA).
Degradation assays essentially followed the protocol described by (Burón-Barral et al., 2006). Transformed BT3388 cells were grown to mid log phase in LB thia medium, induced with 50 µM IPTG for 3 h and then protein synthesis was blocked with 500 µg ml−1 chloramphenicol. Samples were then collected at different time points over 4 h and analyzed for full-length Aer expression by Western blot.
FAD binding analysis
Transformed BT3388 cells were grown in LB thia medium to mid log phase and then induced with 1 mM IPTG for 3 h. Cells were centrifuged at 11790 × g for 15 min, resuspended in 5 ml of 1 M formic acid, centrifuged at 9770 × g for 10 min and the supernatant dried in a SpeedVac Concentrator® (Savant Instruments Inc., Farmdale, CA). The dried sample was dissolved in 450 µl water and filtered using 0.2 µm nylon microfilterfuge tubes (Rainin Instruments Co., Oakland, CA) at 5000 × g for 10 min. FAD was measured using high performance liquid chromatography (HPLC) on a reverse phase (C18) column (Phenomenex, Torrance, CA). FAD binding to the Aer proteins was inferred by measuring the increase in cellular FAD when the protein expression was induced with 1 mM IPTG, compared to that in uninduced cells.
In silico modeling
Aer-PAS domain models were created with the DeepView/Swiss-Model package (http://www.expasy.org/spdbv/, http://swissmodel.expasy.org/) using the coordinates for NifL from Azotobacter vinlandii (2GJ3) and the sequence of the E. coli Aer-PAS domain. The quality of the model was judged reasonable using applications available in the Swiss-Model report: Anolea, Gromos, Verify3D, ProQRes, DFire, QMEAN, WhatCheck, ProMotif, Gromos and ProCheck. Ramachandran plots for all residue types (Procheck) revealed four residues with unfavorable conformations at T18 in the N-cap loop, and E105, G106 and K107 in the Hβ/Iβ loop. The program “What If” flagged three residues with a bad packing environment: R57, R104 and E105 (all in loops), but found no series of residues with a bad packing environment. The model was viewed and manipulated using PyMOL (http://pymol.sourceforge.net/).
Supplementary Material
Acknowledgements
We thank J.S. Parkinson for communicating unpublished data, G. Alexandre and I. Zhulin for communicating data prior to publication, and N. Abraham for technical assistance. This investigation was supported by a grant from the National Institute of General Medical Sciences (GM29481) to B. L. Taylor.
References
- Ames P, Studdert CA, Reiser RH, Parkinson JS. Collaborative signaling by mixed chemoreceptor teams in Escherichia coli. Proc Natl Acad Sci U S A. 2002;99:7060–7065. doi: 10.1073/pnas.092071899. [DOI] [PMC free article] [PubMed] [Google Scholar]
- Amin DN, Taylor BL, Johnson MS. Topology and boundaries of the aerotaxis receptor Aer in the membrane of Escherichia coli. J Bacteriol. 2006;186:894–901. doi: 10.1128/JB.188.3.894-901.2006. [DOI] [PMC free article] [PubMed] [Google Scholar]
- Amin DN, Taylor BL, Johnson MS. Organization of the aerotaxis receptor Aer in the membrane of Escherichia coli. J Bacteriol. 2007;189:7206–7212. doi: 10.1128/JB.00871-07. [DOI] [PMC free article] [PubMed] [Google Scholar]
- Aravind L, Ponting CP. The cytoplasmic helical linker domain of receptor histidine kinase and methyl-accepting proteins is common to many prokaryotic signalling proteins. FEMS Microbiol Lett. 1999;176:111–116. doi: 10.1111/j.1574-6968.1999.tb13650.x. [DOI] [PubMed] [Google Scholar]
- Bibikov SI, Barnes LA, Gitin Y, Parkinson JS. Domain organization and flavin adenine dinucleotide-binding determinants in the aerotaxis signal transducer Aer of Escherichia coli. Proc Natl Acad Sci U S A. 2000;97:5830–5835. doi: 10.1073/pnas.100118697. [DOI] [PMC free article] [PubMed] [Google Scholar]
- Borgstahl GE, Williams DR, Getzoff ED. 1.4 A structure of photoactive yellow protein, a cytosolic photoreceptor: unusual fold, active site, and chromophore. Biochemistry. 1995;34:6278–6287. doi: 10.1021/bi00019a004. [DOI] [PubMed] [Google Scholar]
- Burón-Barral MC, Gosink KK, Parkinson JS. Loss- and gain-of-function mutations in the F1-HAMP region of the Escherichia coli aerotaxis transducer Aer. J Bacteriol. 2006;188:3477–3486. doi: 10.1128/JB.188.10.3477-3486.2006. [DOI] [PMC free article] [PubMed] [Google Scholar]
- Campbell AJ. Department of Microbiology and Molecular Genetics. Loma Linda, CA: Loma Linda University; 2010. Structural dynamics and signaling roles of the Aer PAS and F1 regions; p. 167. [Google Scholar]
- Chang AC, Cohen SN. Construction and characterization of amplifiable multicopy DNA cloning vehicles derived from the P15A cryptic miniplasmid. J Bacteriol. 1978;134:1141–1156. doi: 10.1128/jb.134.3.1141-1156.1978. [DOI] [PMC free article] [PubMed] [Google Scholar]
- Edwards JC, Johnson MS, Taylor BL. Differentiation between electron transport sensing and proton motive force sensing by the Aer and Tsr receptors for aerotaxis. Mol Microbiol. 2006;62:823–837. doi: 10.1111/j.1365-2958.2006.05411.x. [DOI] [PMC free article] [PubMed] [Google Scholar]
- Etzkorn M, Kneuper H, Dunnwald P, Vijayan V, Kramer J, Griesinger C, Becker S, Unden G, Baldus M. Plasticity of the PAS domain and a potential role for signal transduction in the histidine kinase DcuS. Nat Struct Mol Biol. 2008;15:1031–1039. doi: 10.1038/nsmb.1493. [DOI] [PubMed] [Google Scholar]
- Gong W, Hao B, Mansy SS, Gonzalez G, Gilles-Gonzalez MA, Chan MK. Structure of a biological oxygen sensor: a new mechanism for heme-driven signal transduction. Proc Natl Acad Sci U S A. 1998;95:15177–15182. doi: 10.1073/pnas.95.26.15177. [DOI] [PMC free article] [PubMed] [Google Scholar]
- Gosink KK, Burón-Barral MC, Parkinson JS. Signaling interactions between the aerotaxis transducer Aer and heterologous chemoreceptors in Escherichia coli. J Bacteriol. 2006;188:3487–3493. doi: 10.1128/JB.188.10.3487-3493.2006. [DOI] [PMC free article] [PubMed] [Google Scholar]
- Harigai M, Imamoto Y, Kamikubo H, Yamazaki Y, Kataoka M. Role of an N-terminal loop in the secondary structural change of photoactive yellow protein. Biochemistry. 2003;42:13893–13900. doi: 10.1021/bi034814e. [DOI] [PubMed] [Google Scholar]
- Hazelbauer GL, Falke JJ, Parkinson JS. Bacterial chemoreceptors: high-performance signaling in networked arrays. Trends Biochem Sci. 2008;33:9–19. doi: 10.1016/j.tibs.2007.09.014. [DOI] [PMC free article] [PubMed] [Google Scholar]
- Herrmann S, Ma Q, Johnson MS, Repik AV, Taylor BL. PAS domain of the Aer redox sensor requires C-terminal residues for native-fold formation and flavin adenine dinucleotide binding. J Bacteriol. 2004;186:6782–6791. doi: 10.1128/JB.186.20.6782-6791.2004. [DOI] [PMC free article] [PubMed] [Google Scholar]
- Huang ZJ, Edery I, Rosbash M. PAS is a dimerization domain common to Drosophila period and several transcription factors. Nature. 1993;364:259–262. doi: 10.1038/364259a0. [DOI] [PubMed] [Google Scholar]
- Hulko M, Berndt F, Gruber M, Linder JU, Truffault V, Schultz A, Martin J, Schultz JE, Lupas AN, Coles M. The HAMP Domain Structure Implies Helix Rotation in Transmembrane Signaling. Cell. 2006;126:929–940. doi: 10.1016/j.cell.2006.06.058. [DOI] [PubMed] [Google Scholar]
- Jung KH, Spudich JL. Suppressor mutation analysis of the sensory rhodopsin I-transducer complex: insights into the color-sensing mechanism. J Bacteriol. 1998;180:2033–2042. doi: 10.1128/jb.180.8.2033-2042.1998. [DOI] [PMC free article] [PubMed] [Google Scholar]
- Kay SA. PAS, present, and future: clues to the origins of circadian clocks. Science. 1997;276:753–754. doi: 10.1126/science.276.5313.753. [DOI] [PubMed] [Google Scholar]
- Kewley RJ, Whitelaw ML, Chapman-Smith A. The mammalian basic helix-loop-helix/PAS family of transcriptional regulators. Int J Biochem Cell Biol. 2004;36:189–204. doi: 10.1016/s1357-2725(03)00211-5. [DOI] [PubMed] [Google Scholar]
- Key J, Hefti M, Purcell EB, Moffat K. Structure of the redox sensor domain of Azotobacter vinelandii NifL at atomic resolution: signaling, dimerization, and mechanism. Biochemistry. 2007;46:3614–3623. doi: 10.1021/bi0620407. [DOI] [PubMed] [Google Scholar]
- Key J, Moffat K. Crystal structures of deoxy and CO-bound bjFixLH reveal details of ligand recognition and signaling. Biochemistry. 2005;44:4627–4635. doi: 10.1021/bi047942r. [DOI] [PubMed] [Google Scholar]
- Kiefer F, Arnold K, Kunzli M, Bordoli L, Schwede T. The SWISS-MODEL Repository and associated resources. Nucleic Acids Res. 2009;37:D387–D392. doi: 10.1093/nar/gkn750. [DOI] [PMC free article] [PubMed] [Google Scholar]
- Nambu JR, Lewis JO, Wharton KA, Jr, Crews ST. The Drosophila single-minded gene encodes a helix-loop-helix protein that acts as a master regulator of CNS midline development. Cell. 1991;67:1157–1167. doi: 10.1016/0092-8674(91)90292-7. [DOI] [PubMed] [Google Scholar]
- Park SY, Borbat PP, Gonzalez-Bonet G, Bhatnagar J, Pollard AM, Freed JH, Bilwes AM, Crane BR. Reconstruction of the chemotaxis receptor-kinase assembly. Nat Struct Mol Biol. 2006;13:400–407. doi: 10.1038/nsmb1085. [DOI] [PubMed] [Google Scholar]
- Parkinson JS. Complementation analysis and deletion mapping of Escherichia coli mutants defective in chemotaxis. J Bacteriol. 1978;135:45–53. doi: 10.1128/jb.135.1.45-53.1978. [DOI] [PMC free article] [PubMed] [Google Scholar]
- Pellequer JL, Wager-Smith KA, Kay SA, Getzoff ED. Photoactive yellow protein: a structural prototype for the three-dimensional fold of the PAS domain superfamily. Proc Natl Acad Sci U S A. 1998;95:5884–5890. doi: 10.1073/pnas.95.11.5884. [DOI] [PMC free article] [PubMed] [Google Scholar]
- Rebbapragada A, Johnson MS, Harding GP, Zuccarelli AJ, Fletcher HM, Zhulin IB, Taylor BL. The Aer protein and the serine chemoreceptor Tsr independently sense intracellular energy levels and transduce oxygen, redox, and energy signals for Escherichia coli behavior. Proc Natl Acad Sci U S A. 1997;94:10541–10546. doi: 10.1073/pnas.94.20.10541. [DOI] [PMC free article] [PubMed] [Google Scholar]
- Repik A, Rebbapragada A, Johnson MS, Haznedar JO, Zhulin IB, Taylor BL. PAS domain residues involved in signal transduction by the Aer redox sensor of Escherichia coli. Mol Microbiol. 2000;36:806–816. doi: 10.1046/j.1365-2958.2000.01910.x. [DOI] [PMC free article] [PubMed] [Google Scholar]
- Taylor BL. Aer on the inside looking out: paradigm for a PAS-HAMP role in sensing oxygen, redox and energy. Mol Microbiol. 2007;65:1415–1424. doi: 10.1111/j.1365-2958.2007.05889.x. [DOI] [PMC free article] [PubMed] [Google Scholar]
- Taylor BL, Watts KJ, Johnson MS. Oxygen and redox sensing by two-component systems that regulate behavioral responses: behavioral assays and structural studies of aer using in vivo disulfide cross-linking. Methods Enzymol. 2007;422:190–232. doi: 10.1016/S0076-6879(06)22010-X. [DOI] [PubMed] [Google Scholar]
- Taylor BL, Zhulin IB. PAS domains: internal sensors of oxygen, redox potential, and light. Microbiol Mol Biol Rev. 1999;63:479–506. doi: 10.1128/mmbr.63.2.479-506.1999. [DOI] [PMC free article] [PubMed] [Google Scholar]
- Taylor BL, Zhulin IB, Johnson MS. Aerotaxis and other energy-sensing behavior in bacteria. Annu Rev Microbiol. 1999;53:103–128. doi: 10.1146/annurev.micro.53.1.103. [DOI] [PubMed] [Google Scholar]
- Ukaegbu UE, Rosenzweig AC. Structure of the Redox Sensor Domain of Methylococcus capsulatus (Bath) MmoS. Biochemistry. 2009;48:2207–2215. doi: 10.1021/bi8019614. [DOI] [PMC free article] [PubMed] [Google Scholar]
- Vanhercke T, Ampe C, Tirry L, Denolf P. Reducing mutational bias in random protein libraries. Anal Biochem. 2005;339:9–14. doi: 10.1016/j.ab.2004.11.032. [DOI] [PubMed] [Google Scholar]
- Watts KJ, Ma Q, Johnson MS, Taylor BL. Interactions between the PAS and HAMP domains of the Escherichia coli aerotaxis receptor Aer. J Bacteriol. 2004;186:7440–7449. doi: 10.1128/JB.186.21.7440-7449.2004. [DOI] [PMC free article] [PubMed] [Google Scholar]
- Watts KJ, Sommer K, Fry SL, Johnson MS, Taylor BL. Function of the N-terminal cap of the PAS domain in signaling by the aerotaxis receptor Aer. J Bacteriol. 2006;188:2154–2162. doi: 10.1128/JB.188.6.2154-2162.2006. [DOI] [PMC free article] [PubMed] [Google Scholar]
- Xie Z, Ulrich LE, Zhulin IB, Alexandre G. PAS domain containing chemoreceptor couples dynamic changes in metabolism with chemotaxis. Proc Natl Acad Sci U S A. 2010;107:2235–2240. doi: 10.1073/pnas.0910055107. [DOI] [PMC free article] [PubMed] [Google Scholar]
- Yu HS, Saw JH, Hou S, Larsen RW, Watts KJ, Johnson MS, Zimmer MA, Ordal GW, Taylor BL, Alam M. Aerotactic responses in bacteria to photoreleased oxygen. FEMS Microbiol Lett. 2002;217:237–242. doi: 10.1111/j.1574-6968.2002.tb11481.x. [DOI] [PubMed] [Google Scholar]
- Zhulin IB, Johnson MS, Taylor BL. How do bacteria avoid high oxygen concentrations? Biosci Rep. 1997;17:335–342. doi: 10.1023/a:1027340813657. [DOI] [PubMed] [Google Scholar]
- Zoltowski BD, Schwerdtfeger C, Widom J, Loros JJ, Bilwes AM, Crane BR. Conformational switching in the fungal light sensor Vivid. Science. 2007;316:1054–1057. doi: 10.1126/science.1137128. [DOI] [PMC free article] [PubMed] [Google Scholar]
Associated Data
This section collects any data citations, data availability statements, or supplementary materials included in this article.