

Abstract
Stimulation of the primary motor cortex (M1) of one hemisphere of the brain inhibits the opposite M1, a process known as interhemispheric inhibition (IHI). An early phase of IHI peaks at about ∼10 ms after stimulation of the opposite hemisphere and is termed short latency interhemispheric inhibition (SIHI). A later phase peaks at about 40 ms and has been termed long latency interhemispheric inhibition (LIHI). The objective of the present study is to test how LIHI interacts with cortical inhibitory and facilitatory circuits, including short interval intracortical inhibition (SICI), intracortical facilitation (ICF) and long interval intracortical inhibition (LICI). We studied 10 healthy volunteers. LIHI from right to left hemisphere was elicited by stimulating the right M1 at an interstimulus interval (ISI) of 40 ms before stimulation of the left M1. Conditioning and test stimuli to elicit SICI, ICF and LICI were given to left M1. The effects of different sizes of test motor-evoked potential (MEP amplitudes; 0.2, 1 and 2 mV) were examined for SICI, ICF, LICI and LIHI. Using paired-pulse and triple-pulse protocols, how LIHI interacts with SICI, ICF and LICI were investigated. We found SICI increased, while LICI and LIHI decreased with increasing test MEP amplitude. The presence of LIHI did not change the degree of SICI and intracortical facilitation (ICF), and their effects of these circuits were additive. On the other hand, LICI and LIHI were reduced in the presence of each other. We conclude that different sets of cortical neurons mediate LIHI, SICI, ICF and LICI. GABAB-mediated LICI and LIHI have inhibitory interactions with each other while LIHI has an additive effect with GABAA-mediated SICI.
Introduction
Several studies used transcranial magnetic stimulation (TMS) to study the interactions between interhemispheric as well as intrahemispheric neuronal circuits in order to understand the motor cortical circuitries involved in normal motor control and in neurological disorders (Chen, 2004). Stimulation of the primary motor cortex (M1) of one hemisphere inhibits the opposite M1 and the process has been termed interhemispheric inhibition (IHI) (Ferbert et al. 1992; Gerloff et al. 1998; Di Lazzaro et al. 1999). IHI may suppress undesired activities of the opposite hemisphere and has a physiological role in the coordination of bimanual movement (Duque et al. 2005). This inhibition occurs at interstimulus intervals (ISI) of 6–50 ms (Gerloff et al. 1998) and has two phases (Chen et al. 2003). The first phase of inhibition peaks at about 10 ms after stimulation of the opposite hemisphere, which has been termed short latency interhemispheric inhibition (SIHI). The second phase peaks at about 40–50 ms (Kukaswadia et al. 2005) and is referred to as long latency interhemispheric inhibition (LIHI). SIHI and LIHI are mediated by different neuronal circuits (Chen et al. 2003; Chen, 2004; Ni et al. 2009). Pharmacological studies showed that administration of the γ-aminobutyric acid type B (GABAB) receptor agonist baclofen increased LIHI, suggesting that LIHI is mediated by GABAB receptors whereas the neurotransmitter system mediating SIHI has not been established (Irlbacher et al. 2007). Furthermore, LIHI of motor cortex could be elicited by stimulation of widely distributed motor-related areas in the contralateral hemisphere such as the sensory cortex, premotor cortex and dorsolateral prefrontal cortex whereas the area that produces SIHI is more restricted (Ni et al. 2009). In addition, LIHI can be elicited at lower conditioning stimulus intensities than SIHI (Ni et al. 2009). IHI is abnormal in some neurological disorders such as dystonia (Beck et al. 2009; Nelson et al. 2010) and Parkinson's disease (Li et al. 2007). Several studies investigated the effects of IHI on intracortical circuits such as short interval intracortical inhibition (SICI), long interval cortical inhibition (LICI) and intracortical facilitation (ICF) circuits (Daskalakis et al. 2002; Chen, 2004; Lee et al. 2007; Muller-Dahlhaus et al. 2008). In the originating hemisphere of transcallosal projection, SICI and LICI reduced both SIHI and LIHI projecting to the opposite hemisphere (Lee et al. 2007). In the target hemisphere, SIHI was found to inhibit SICI (Daskalakis et al. 2002; Muller-Dahlhaus et al. 2008), while SIHI and LICI also have inhibitory interactions (Daskalakis et al. 2002). However, the effects of LIHI on these cortical circuits have not been studied. Thus, the aim of the present study is to examine how LIHI mediated by GABAB receptors interacts with cortical circuits SICI (GABAA mediated) and LICI (GABAB mediated). We hypothesize that: (1) LIHI is mediated by circuits distinct from SICI, LICI and ICF, based on different findings for these circuits in previous studies; (2) LIHI has competitive inhibition interactions with LICI because both LICI and LIHI are probably GABAB mediated and GABAB receptors are present in both pre- and post-synaptic locations; and (3) LIHI has inhibitory interaction with SICI because LICI has been shown to inhibit SICI, probably through presynaptic inhibition (Sanger et al. 2001).
Methods
Subjects
We studied 10 right-handed healthy volunteers (5 men and 5 women, aged 35.5 ± 10.1, range: 27–50 years). Handedness was assessed with the Edinburgh handedness inventory (Oldfield, 1971). Written informed consent was obtained from all subjects. The protocol was approved by the University Health Network Research Ethics Board in accordance with the Declaration of Helsinki on the use of human subjects in experiments.
Electromyographic recording
Surface electromyogram (EMG) was recorded from the first dorsal interosseous (FDI) muscle of both hands with 9 mm diameter Ag–AgCl electrodes. The active electrode was placed over the muscle belly and the reference electrode over the metacarpophalangeal joint of the index finger. The signal was amplified (1000×), band-pass filtered (20 Hz to 2.5 kHz; Intronix Technologies Corporation Model 2024F, Bolton, Ontario, Canada), digitized at 5 kHz by an analog-to-digital (A/D) interface (Micro1401, Cambridge Electronics Design, Cambridge, UK) and stored in a computer for off-line analysis. The EMG signal was monitored on a computer screen and via loudspeaker to provide feedback on the state of muscle relaxation. The subjects relaxed throughout the study. Trials contaminated with voluntary muscle activities were rejected.
Transcranial magnetic stimulation (TMS)
TMS was performed with two figure-of-eight coils, four Magstim 200 stimulators and two Bistim modules (Magstim Company, Dyfed, UK). The outputs of two Magstim 200 stimulators were directed to a Bistim module. The output of this Bistim module and the output of a third Magstim 200 stimulator were directed to the second Bistim module, the output of which was used to stimulate left M1 using a 70 mm diameter coil. The smaller second stimulating coil (60 mm diameter) with a vertical handle (‘branding iron’ type) was used to stimulate right M1 (to elicit LIHI) and was connected to the fourth Magstim stimulator. The area for eliciting the best motor response in the FDI muscle was established over the contralateral M1 (optimal position) with the coil held about 45 deg to the mid-sagittal line (approximately perpendicular to the central sulcus). The direction of the induced current in the brain was from posterior to anterior and was optimal to activate the corticospinal neurons transynaptically (Werhahn et al. 1994; Kaneko et al. 1996). The optimal positions for right and left M1 were marked on the scalp as well as on the neuro-navigation system (described below) to ensure identical placement of the coil throughout the experiment.
Neuro-navigation for tracking of coil position
A magnetic resonance imaging (MRI) guided neuro-navigational system (Brainsight Frameless; Rogue Research Inc., Montreal, Quebec, Canada) was used to verify the locations of both TMS coils. A standard MRI of each subject was conducted on a 3T GE scanner using an 8-channel volume head coil. The high-resolution structural T1-weighted MRI was imported to the Brainsight software and was co-registered with the fiducial landmarks for each subject and the centre of the TMS coil. The Brainsight system allows visualization of the coil location in relation to the brain in real time to ensure accurate online positioning over the FDI motor hot spot (Di Lazzaro et al. 1998; Guggisberg et al. 2001; Ni et al. 2009).
Study design
We tested the effect of LIHI on SICI, ICF and LICI. Each trial consisted of one or more conditioning stimuli (CS) followed by a suprathreshold test stimulus (TS). The timing of the pulses was controlled by the output features of the A/D converter (Micro 1401). TS were delivered to the left M1. The CS applied to the left M1 was delivered 2, 10 or 100 ms before the TS and was named CS2, CS10 and CS100, respectively. The CS to the right hemisphere was delivered 40 ms before the TS and was named CCS40 (contralateral conditioning stimulus). CS2 was used to elicit SICI (Kujirai et al. 1993) and CS10 for ICF (Ziemann et al. 1996). Their intensities were set at 80% of the resting motor threshold (RMT). RMT was defined as the minimum stimulator output that induced MEPs of greater than 50 μV in at least 5 out of 10 consecutive trials when FDI muscle was completely relaxed. A suprathreshold CS100 pulse (minimum stimulus intensity that produced >1 mV MEPs in at least 5 of 10 trials) was used to produce LICI. CCS40 was set at 75% stimulator output to produce LIHI (Daskalakis et al. 2002; Chen et al. 2003; Nelson et al. 2009). TS was set at the minimum intensity required to produce a peak-to-peak MEP amplitude of 1 mV in 5 out of 10 trials in the relaxed right FDI muscle in trials using TS1mV (see below) as the test intensity.
Experiment 1: effects of different test stimulus intensities on SICI, ICF, LICI and LIHI
The TS intensity was labelled according to test MEP amplitudes it produced. The minimum stimulus intensity that produced MEPs of >1 mV peak-to-peak amplitude in at least 5 out of 10 trials was named TS1mV. TS0.2mV and TS2mV were defined in a similar way. We tested different TS intensities while keeping the CS the same. Each run consisted of five different conditions: TS alone, CS2–TS, CS10–TS, CS100–TS and CCS40–TS. The test conditions were delivered in random order and repeated 10 times (50 trials in total). The inter-trial intervals were 6 s. The three different TS intensities were studied in separate runs.
Experiment 2: interactions between LIHI and SICI/ICF
We examined the interactions between LIHI and SICI and between LIHI and ICF. The 10 test states are shown in Table 1. These conditions were delivered in random order and repeated 10 times for each. TS intensity used was either TS1mV or TS1mVCCS40. TS1mVCCS40 refers to TS intensity adjusted to produce 1 mV MEPs in the presence of CCS40. Conditions 2A–2D gave SICI (2B/2A), ICF (2C/2A) and LIHI (2D/2A) for a 1 mV test MEP. Similarly, SICI (2F/2E), ICF (2G/2E) and LIHI (2H/2E) with an adjusted TS intensity (TS1mVCCS40) were tested in states 2E to 2H. Condition 2I assessed the interactions between LIHI and SICI while condition 2J tested the interactions between LIHI and ICF. The experiment was designed to compare SICI (2I/2H) and ICF (2J/2H) in the presence of LIHI to SICI and ICF alone matched for test MEP amplitude (2B/2A for SICI, 2C/2A for ICF) and matched TS intensity (2F/2E for SICI, 2G/2E for ICF).
Table 1.
Pulse configurations used in Experiment 2
| State | CCS40 | CS10 | CS2 | TS |
|---|---|---|---|---|
| 2A | – | – | – | 1 mV |
| 2B | – | – | 0.8 RMT | 1 mV |
| 2C | – | 0.8 RMT | – | 1 mV |
| 2D | + | – | – | 1 mV |
| 2E | – | – | – | 1mVCCS40 |
| 2F | – | – | 0.8 RMT | 1mVCCS40 |
| 2G | – | 0.8 RMT | – | 1mVCCS40 |
| 2H | + | – | – | 1mVCCS40 |
| 2I | + | – | 0.8 RMT | 1mVCCS40 |
| 2J | + | 0.8 RMT | – | 1mVCCS40 |
Experiment 2 investigated the effect of long interhemispheric inhibition (LIHI) on short interval intracortical inhibition (SICI) and intracortical facilitation (ICF). In conditions 2A to 2D, the effects of SICI, ICF and SAI on 1 mV test motor evoked potential (MEP) were assessed whereas in conditions 2E to 2J, test stimulus intensity was increased in order to produce 1 mV test MEP in the presence of CCS40 (1mVCCS40). CS2, conditioning stimulus given 2 ms prior to TS; CS10, conditioning stimulus given 10 ms prior to TS; CCS40, contra lateral hemisphere stimulation given 40 ms prior to test TS; RMT, resting motor threshold; TS, test stimulus.
Experiment 3: interactions between LIHI and LICI
We tested the interactions between LIHI and LICI by comparing the effects of applying LIHI and LICI together to that of LIHI or LICI alone. The test states are shown in Table 2. Seven states were delivered in random order and repeated 10 times for each. The first three states (3A–3C) assessed the inhibitory effect of CS100 (3B/3A) or CCS40 (3C/3A) on a test MEP of 1 mV. The TS intensity was increased in states 3D–3G to produce a 1 mV MEP in the presence of CS100 (TS1mVCS100). The experimental design allowed us to compare the degree of LIHI in the presence of LICI (3G/3E) to LIHI alone matched for MEP amplitude (3C/3A) and TS intensity (3F/3D). We also compared the LICI with 1 mV test MEP (3B/3A), LICI with test intensity of TS1mVCS100 (3E/3D) and LICI in the presence of LIHI (3G/3F). In this comparison, 3B/3A and 3G/3F were not matched for MEP amplitude, but 3E/3D and 3G/3F were matched for TS intensity.
Table 2.
Pulse configuration used in Experiment 3
| State | CS100 | CCS40 | TS |
|---|---|---|---|
| 3A | – | – | 1 mV |
| 3B | 1 mV | – | 1 mV |
| 3C | – | + | 1 mV |
| 3D | – | – | TS1mVCS100 |
| 3E | 1 mV | – | TS1mVCS100 |
| 3F | – | + | TS1mVCS100 |
| 3G | 1 mV | + | TS1mVCS100 |
Experiment 3 studied the interactions between long interhemispheric inhibition (LIHI) and long interval intracortical inhibition (LICI). In conditions 3A to 3C, inhibitory effects of CS100 and CCS40 on 1 mV test motor evoked potential (MEP) were assessed. In conditions 3D to 3G, test stimulus intensity was increased in order to produce 1 mV test MEPs in the presence of CS100 (TS1mVCS100). CS100, conditioning stimulus given 100 ms prior to TS; CCS40, contralateral hemisphere stimulation given 40 ms prior to test TS; TS, test stimulus.
Data analysis
MEP amplitudes were measured peak to peak. SICI, ICF, LICI and LIHI were expressed as the ratio of the conditioned (with preceding CS) to the unconditioned (TS alone) MEP amplitudes. A ratio more than 1 indicates facilitation and less than 1 indicates inhibition. Values were expressed as mean ± standard deviation (s.d.).
Statistical analysis
For Experiment 1, the effects of different test MEP amplitudes on SICI, ICF, LICI and LIHI were tested by repeated-measures analysis of variance (ANOVA) and Fischer's protected least significance difference (PLSD) post hoc test. For Experiment 2, the effects of LIHI on SICI were determined by repeated measures ANOVA by comparing SICI for TS1mV (2B/2A), SICI for a TS1mVCCS40 (2F/2E) and SICI in the presence of LIHI (2I/2H) as the repeated measures. Similarly, ICF for TS1mV (2C/2A), ICF for TS1mVCCS40 (2G/2E) and ICF in the presence of LIHI (2J/2H) were compared. For Experiment 3, the effects of LICI on LIHI were examined by repeated measures ANOVA with test conditions of LIHI for TS1mV (3C/3A), LIHI for TS1mVCS100 (3F/3D) and LIHI in the presence of LICI (3G/3E) as repeated measures. Similarly, the effects of LIHI on LICI were examined by repeated measures ANOVA with test conditions LICI for TS1mV (3B/3A), LICI for TS1mVCS100 (3E/3D) and LICI in the presence of LIHI (3G/3F) as repeated measures. Post hoc Fischer's PLSD test was used to examine which condition was different from others if ANOVA showed significant main effect. Bartlett's test was used to test for sphericity. The threshold for significance was set at P < 0.05.
Results
RMT was 53.5 ± 6.6% of the maximum stimulator output. Bartlett's test for sphericity was not significant for the data presented below.
Experiment 1: effects of different test stimulus intensities on SICI, ICF, LICI and LIHI
The TS intensities used were 57.8 ± 15.4% of stimulator output for TS0.2mV, 63.6 ± 16.2% for TS1mV and 83.2 ± 16.1% for TS2mV. The amplitudes for test MEP alone were 0.27 ± 0.15 mV for TS0.2mV, 0.93 ± 0.13 mV for TS1mV and 2.46 ± 0.78 mV for TS2mV. The results are shown in Fig. 1. SICI showed the least inhibition at TS0.2 mV and increased with TS intensity. ANOVA showed a significant effect of TS intensity (F2,18 = 4.97; P = 0.03). Post hoc testing showed less SICI at TS0.2mV compared to TS1mV (P = 0.01), and to TS2mV (P = 0.04). On the other hand LIHI showed greater inhibition with lower TS intensities than higher TS intensities. ANOVA showed significant effects of TS intensities (F2,18 = 4.65; P = 0.03). Post hoc testing showed less inhibition at TS2mV compared to TS0.2mV (P = 0.007). LICI also showed a significant effect of test MEP amplitude (F2,18 = 15.83; P < 0.001). Post hoc testing showed greater LICI for test MEP of 0.2 mV compared to 1 mV (P < 0.001) and 2 mV (P < 0.001). There was significant correlation between LICI and LIHI (r = 0.70; F1,9 = 7.63; P = 0.03, Fig. 1B) with TS2mV where the strengths of LICI and LIHI are comparable (Fig. 1A). The effect of test MEP amplitude on ICF was not significant.
Figure 1. Results of Experiment 1.
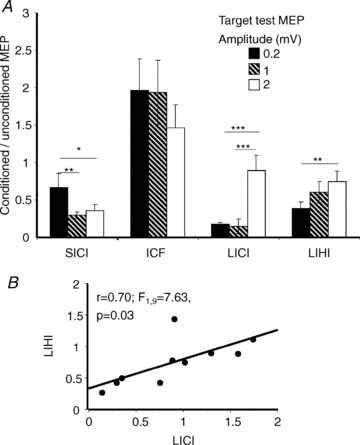
A, effects of different test stimulus intensities on SICI, ICF, LICI and LIHI in Experiment 1. The y-axis shows the ratio of the conditioned (CS followed by TS) to the unconditioned (TS alone) MEP amplitude. Values < 1 represent inhibition. Error bars represent standard errors of the mean. Filled columns represent target MEP amplitudes of 0.2 mV, hatched columns target MEP amplitudes of 1 mV and open columns target MEP amplitudes of 2 mV. Significant differences as shown by repeated-measures ANOVA and post hoc testing are indicated by asterisks (*P < 0.05; **P < 0.01; ***P < 0.001). B, relationship between LICI and LIHI at test intensity of 2 mV. The x-axis shows LICI and y-axis shows LIHI both elicited with test intensity of 2 mV. The significant positive correlation indicates that subjects with higher LICI have higher LIHI and these two circuits share some common properties at this test intensity.
Experiment 2: effect of LIHI on SICI and ICF
The data from one subject were excluded from the analysis as the MEP amplitude in the presence of CCS40 (state 2H, Table 1) could not be matched with that of TS1mV alone (state 2A). TS intensities used were 66.1 ± 18.3% of stimulator output for eliciting target MEPs of 1 mV (2A) and 71.8 ± 16.2% for MEPs of 1mVCCS40 (2E). The MEP amplitudes were 1.05 ± 0.46 mV for the 1 mV test MEP (2A), 1.86 ± 0.65 mV for 1mVCCS40 (2E) and 1.24 ± 0.53 mV for the CCS40–1mVCCS40 test pulse combination (2H). Thus, the amplitudes for the 1 mV test MEP (2A) and the CCS40–1mVCCS40 test MEP (2H) were matched. Figure 2 shows the results from one subject and the group results are shown in Fig. 3. LIHI had no significant effect on the SICI or ICF as SICI and ICF still occurred in the presence of LIHI. Thus, the inhibitory effect of LIHI and SICI appears to be additive and the facilitatory effect of ICF was still observed in the presence of LIHI.
Figure 2. Effects of LIHI on SICI in one representative subject.
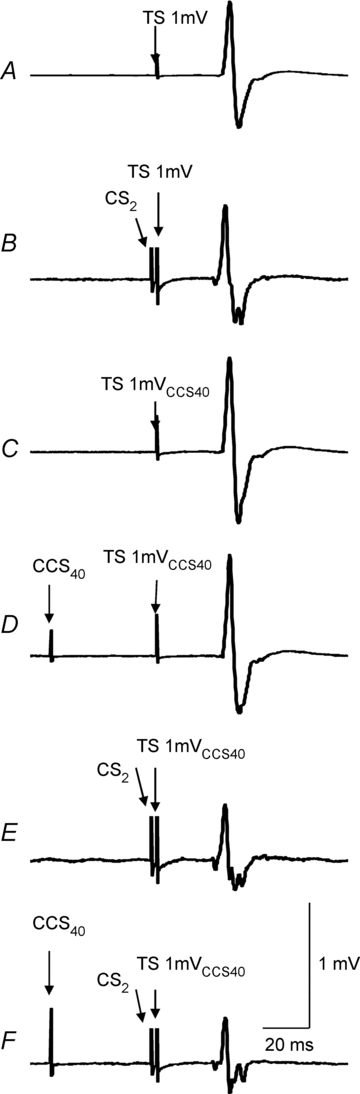
Each trace represents averaged MEPs from 10 trials. A, the test stimulus (TS) alone. TS was set to produce MEP of about 1 mV (state 2A in Table 1). B, short-interval intracortical inhibition (SICI) elicited by a subthreshold conditioning stimulus (CS2) that precedes the TS1mV by 2 ms (state 2B). C, TS1mVCCS40 alone. TS was adjusted to produce test MEP of 1 mV in the presence of contralateral cortical stimulation (CCS40) preceding the TS by 40 ms (state 2E). D, long interval interhemispheric inhibition (LIHI) induced by CCS40 preceding the TS1mVCCS40 by 40 ms (state 2H). The test MEP amplitude matched was similar to the test MEP amplitude in condition 2A. E, SICI elicited by a subthreshold conditioning stimulus (CS2) that precedes the TS1mVCCS40 by 2 ms (state 2F). F, combined LIHI and SICI (CCS40–CS2–TS1mVCCS40 combination, condition 2I). The inhibition is greater compared to D and E demonstrating that there is an additive effect of the two inhibitory pulses.
Figure 3. Interactions between SICI, ICF and LIHI.
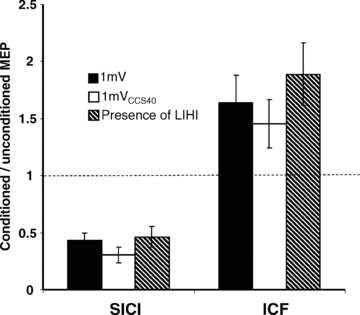
The y-axis shows the ratio of the conditioned vs. the unconditioned MEP. Ratios < 1 represent inhibition, ratios > 1 represent facilitation. Error bars represent standard errors of the mean. The left three columns show the results for SICI: SICI in the presence of LIHI (hatched column) was compared with the SICI alone matched for test stimulus amplitude (TS1mV, filled column) and test stimulus intensity (TS1mVCCS40, open column). The right three columns show the results for ICF: ICF in the presence of LIHI (hatched column) was not significantly different compared to ICF alone matched for test stimulus amplitude (TS1mV, filled column) and test stimulus intensity (TS1mVCCS40, open column). SICI and ICF were not significantly changed in the presence of LIHI.
Experiment 3: interaction between LIHI and LICI
The data from one subject were excluded from the analysis as the MEP amplitude in the presence of CS100 (state 3F, Table 2) could not be matched to that of TS1mV alone (state 3A). TS intensities were 65.9 ± 18.3% of maximum stimulator output to elicit a 1 mV MEP (3A–3C) and 77.7 ± 18.3% for 1 mV MEP in the presence of CS100 (3D–3G). The MEP amplitude for the TS1mV alone (3A) was 0.97 ± 0.21 mV, for TS1mVCS100 alone (3D) was 2.52 ± 0.98 mV and for the CS100–TS1mVCS100 combination (3E) was 1.02 ± 0.30 mV. Thus, the TS1mV alone (3A) and CS100–TS1mVCS100 combination (3E) produced similar MEP amplitudes. The results from one subject are shown in Fig. 4. The MEP amplitude induced by triple-pulse CS100–CCS40–TS1mVCS100 (Fig. 4E) was similar to that induced by paired-pulse CCS40–TS1mVCS100 (Fig. 4D), showing that addition of CS100 in the presence of LIHI had little effect. Moreover, addition of the CCS40 pulse to paired-pulse CS100–TS1mVCS100 caused MEP facilitation rather than inhibition (Fig. 4C compared to Fig. 4E). The group results are shown in Fig. 5. ANOVA showed a significant effect of test conditions on LIHI (F2,16 = 7.17; P = 0.006). Post hoc testing confirmed that there was significantly less inhibition for LIHI in the presence of LICI (the mean value was in the facilitatory range, 3G/3E = 1.54 ± 0.39) compared to LIHI matched for MEP amplitude (3C/3A = 0.73 ± 0.19, P = 0.004) and matched for TS intensity (3F/3D = 0.76 ± 0.07, P = 0.006). Similarly, ANOVA showed a significant effect of test conditions on LICI (F2,16 = 12.97; P < 0.001). Post hoc testing confirmed that LICI in the presence of LIHI (3G/3F = 0.74 ± 0.18) showed significantly less inhibition compared to LICI alone both with 1 mV test MEP (3B/3A = 0.17 ± 0.12, P < 0.001) and with increased test intensity (3E/3D = 0.41 ± 0.08, P = 0.013). However, it should be noted that the comparison of LICI in the presence of LIHI to LICI with 1 mV test MEP (3G/3F vs. 3B/3A) was not matched for MEP amplitude. The MEP amplitude for condition 3F was 1.72 ± 0.29 mV. Therefore, this difference may partially be accounted for by the higher MEP amplitude in 3F compared to 3A.
Figure 4. Interactions between LIHI and LICI in one representative subject.
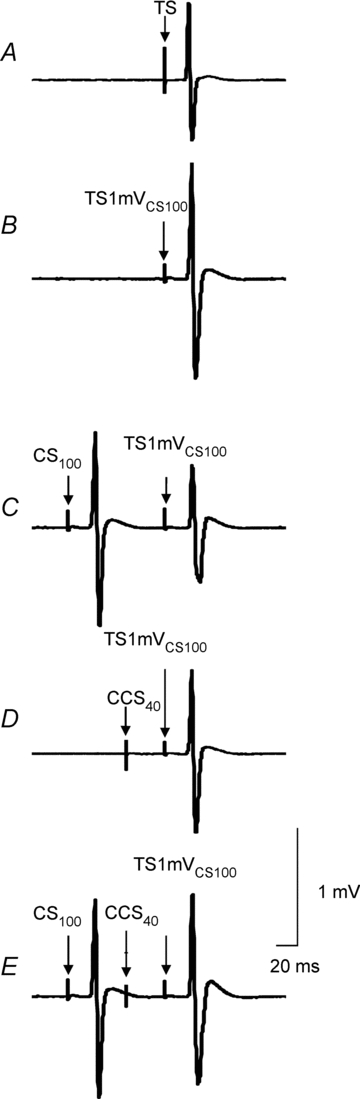
Traces represent averaged MEPs from 10 trials. A, the test stimulus (TS) alone. TS was set to produce MEP of about 1 mV (state 3A in Table 2). B, TS1mVCS100 alone. TS was adjusted to produce test MEP of 1 mV in the presence of CS100 (cortical stimulation that precedes the TS by 100 ms) (state 3D). C, LICI induced by CS100 preceding the TS1mVCS100 by 100 ms (state 3E). D, long interhemispheric inhibition (LIHI) induced by contralateral cortical stimulation (CCS40) preceding TS1mVCS100 by 40 ms (state 3F). The test MEP amplitude matched was similar to the test MEP amplitude in condition 3A. E, combined LIHI and LICI (CS100–CCS40–TS1mVCS100 combination, state 3G). The combined effects of LICI and LIHI are less than the individual inhibitory effects showing that these two inhibitory circuits have inhibitory interactions. Addition of the CCS40 (E, state 3G) pulse to the CS100–TS1mVCS100 combination (C, state 3F) resulted in MEP facilitation.
Figure 5. Interactions between LICI and LIHI.
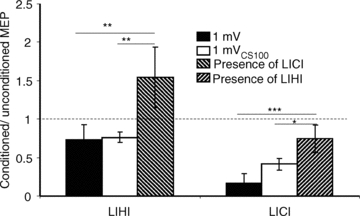
LICI in the presence of LIHI and LIHI in the presence of LICI in Experiment 3. The y-axis shows the ratio of the conditioned (CS followed by TS) to the unconditioned (TS alone) MEP amplitude. Ratios < 1 represent inhibition, ratios > 1 represent facilitation. Error bars represent standard errors of the mean. The left three columns show the results for LICI. LICI in the presence of LIHI (presence of LIHI, hatched column) showed significantly less inhibition compared to LICI alone matched for test MEP amplitude (TS1mV, filled column) and test stimulus intensity (TS1mVCS100, open column). The right three columns show LIHI in the presence of LICI (presence of LICI, hatched column) was compared with the LIHI alone (TS1mV, filled column) and LIHI matched for test stimulus intensity (TS1mVCS100, open column). The inhibitory effects of LIHI were significantly decreased in the presence of LICI. Significant differences as shown by repeated-measures ANOVA and post hoc testing are indicated by asterisks (*P < 0.05; **P < 0.01; ***P < 0.001).
Discussion
We examined the interactions between LIHI and other intracortical inhibitory and facilitatory circuits. SICI, ICF, LICI and LIHI showed different changes with variations in TS intensities. We observed inhibitory interactions between LIHI and LICI while LIHI had no significant effect on SICI and ICF. There was correlation between LICI and LIHI at TS2mV.
Different neuronal circuits mediate SICI, ICF, LICI and LIHI
Experiment 1 showed that SICI increased and ICF decreased with higher test MEP amplitude. On the other hand, LIHI and LICI decreased with higher test MEP amplitude. This is in agreement with previous studies (Sanger et al. 2001; Daskalakis et al. 2002; Sailer et al. 2002), although LIHI has not been studied in this manner. Since changes in test stimulus intensities had different effects for the different types of cortical inhibition and facilitation, different sets of neuronal circuits are probably involved (Chen, 2004). Decrease of LIHI with higher TS intensity is different from increased SICI at higher TS intensity (Sanger et al. 2001; Daskalakis et al. 2002; Sailer et al. 2002). With higher TS intensity more late I-waves may be generated (Di Lazzaro et al. 1998), which may be less susceptible to LIHI. TS at higher intensities activate corticospinal neurons with higher threshold and these neurons may be less sensitive to the GABAB-mediated inhibition, similar to reduced LICI at higher TS intensities (Sanger et al. 2001). An alternative explanation is that a TS with higher intensity activates the corticospinal neurons that are further away from the centre of the TMS coil. These neurons may receive less transcallosal projection because they are not located at the centre of muscle representation in the M1. The correlation between LIHI and LICI (Fig. 1B) should be interpreted cautiously as the conditioning intensity for LIHI was fixed at 75% of stimulator output to produce maximum LIHI (Chen et al. 2003), whereas the conditioning stimulus for LICI was adjusted to produce 1 mV MEP.
Effects of LIHI on SICI and ICF
We found SICI in the target hemisphere was unchanged in the presence of LIHI, and their effects are additive (Figs 2 and 3). This is different from the interaction between SIHI and SICI since SIHI inhibits SICI in the target hemisphere (Daskalakis et al. 2002). Therefore, SIHI and LIHI have different interactions with intracortical circuits in the target hemisphere, further supporting the notion that SIHI and LIHI are mediated by different neuronal mechanisms (Chen et al. 2003; Irlbacher et al. 2007; Ni et al. 2009). In the originating hemisphere for IHI, SICI significantly reduced both SIHI and LIHI (Lee et al. 2007). Therefore, the organization and interaction of IHI circuits are different for the originating and target hemispheres.
It has been suggested that transcallosal inhibition helps to attain the specificity of movement by inhibiting the homologous muscular activation (Kobayashi et al. 2003). Intracortical circuits such as SICI are also known to be involved in precision movements (Gagne & Schneider, 2008). Thus, the additive effects of LIHI and SICI may be important in the control of precise movements. Further, this interaction may also play a role in preventing mirror movements (Duque et al. 2005). Certain types of mirror movements are produced by simultaneous activation of both left and right cortices due to reduced IHI (Mayston et al. 1999). Transcallosal inhibitory control is important during unimanual or asynchronous movements to prevent undesirable mirror movements and interference from the opposite hemisphere (Mayston et al. 1999). This idea is supported by a recent study showing that electromyographic mirror activities are inversely proportional to IHI (Hubers et al. 2008).
We only tested single CS40 intensity at 75% of maximum stimulator output. This intensity was chosen because a previous study showed that it produces maximum LIHI (Chen et al. 2003). We cannot completely exclude the possibility that weaker LIHI may change SICI or ICF, but this seems unlikely. Since LIHI may alter the ratio of early and late I-waves mediating the test MEP which may change the effects of SICI and ICF, we cannot be certain that there was no interaction between LIHI, SICI and ICF. However, the additive effects of SICI and ICF in the presence of LIHI are clearly different from the interaction between LIHI and LICI.
Interaction between LIHI and LICI
Previous reports (Chen et al. 2003; Kukaswadia et al. 2005) suggested that the circuits mediating LICI may be related to those mediating LIHI. Pharmacological studies showed that both LIHI (Irlbacher et al. 2007) and LICI (McDonnell et al. 2006) are increased by the GABAB agonist baclofen. We found that both LICI and LIHI decreased with higher test MEP amplitude (Fig. 1A) and there was a significant correlation between the strengths of LICI and LIHI (Fig. 1B), consistent with the idea that these neuronal networks share common properties. However, there are also difference in the properties of LICI and LIHI. LICI inhibits SICI (Sanger et al. 2001) whereas we found additive effects of LIHI and SICI in the present study. Our results suggest that the neurons mediating LIHI and LICI share some properties, but they are not identical.
We found that LIHI was reduced in the presence of LICI compared to LIHI alone whether matched for test stimulus intensity or test MEP amplitude (Fig. 5). In addition, LICI was reduced in the presence of LIHI matched for test stimulus intensity (Fig. 5). These findings suggest LICI and LIHI have inhibitory interactions. Interestingly, the addition of the CCS40 pulse to LICI (condition 3G compared to 3E) caused MEP facilitation (Figs 4C and E, and 5, LIHI in the presence of LICI). The finding that LIHI turns into facilitation suggests that the results cannot be simply explained by occlusion or saturation of inhibitory effects such as two inhibitory systems competing for the same GABAB receptors, or the matched MEP (condition 3E) were due to I-waves that were less susceptible to LIHI than the unconditioned MEP (condition 3A), although we cannot exclude some contributions from these factors. Therefore, more complex mechanisms are probably involved. Furthermore, the facilitatory effect of LIHI in the presence of LICI (condition 3G compared to 3E) can be explained by LIHI inhibiting LICI. However, it cannot be readily accounted for by LICI inhibiting LIHI. This is because even if LIHI were completely abolished by LICI, the CCS40 pulse generating LIHI would have no effect but cannot explain the facilitation.
Based on the present results, we propose that LIHI and LICI probably share some common circuits and LIHI inhibits LICI. GABAB receptors occur in both presynaptic and postsynaptic locations. Activation of presynaptic GABAB receptors decreases neurotransmitter release while stimulation of postsynaptic GABAB receptors produces long-lasting hyperpolarization (Huang, 2006). GABAB receptors are heterodimers of GABAB1 and GABAB2 subunits (Huang, 2006). The GABAB1 subunit has two isoforms with distinct locations and functions. The GABAB1a subunit is located presynaptically and inhibits GABA release whereas the GABAB1b subunit generates postsynaptic inhibition through potassium-mediated inhibitory postsynaptic potentials (Vigot et al. 2006; Perez-Garci et al. 2006). We speculate that LIHI inhibits LICI through GABAB receptors with the GABAB1a isoform which produces presynaptic inhibition of GABA release. Abnormal LIHI, SICI, ICF and LICI have been reported in diseases such as Parkinson's disease, schizophrenia and dystonia (Chen et al. 2008; Nelson et al. 2010). Impaired interaction between LICI and SICI tested with methods similar to those used in this study has been observed in Parkinson's disease (Chu et al. 2009). Future studies on the interaction between LIHI with different inhibitory and facilitatory circuits may help elucidate the pathophysiology of neurological and psychiatric disorders.
Acknowledgments
This study was supported by Canadian Institutes of Health Research (MOP 62917) and the Catherine Manson Chair in Movement Disorders.
Glossary
Abbreviations
- CCS
contralateral conditioning stimulus
- CS
conditioning stimulus
- FDI
first dorsal interosseous
- ICF
intracortical facilitation
- IHI
interhemispheric inhibition
- ISI
interstimulus interval
- LICI
long interval intracortical inhibition
- LIHI
long latency interhemispheric inhibition
- RMT
resting motor threshold
- SICI
short interval intracortical inhibition
- SIHI
short latency interhemispheric inhibition
- TS
test stimulus
Author contributions
All the authors were involved in the conception and design of the study. K.U. collected, analysed and interpreted the data, and drafted the first version of the manuscript. C.G. assisted in data collection. All the authors revised the manuscript critically for important intellectual content and all approved the final version.
References
- Beck S, Shamim EA, Richardson SP, Schubert M, Hallett M. Inter-hemispheric inhibition is impaired in mirror dystonia. Eur J Neurosci. 2009;29:1634–1640. doi: 10.1111/j.1460-9568.2009.06710.x. [DOI] [PMC free article] [PubMed] [Google Scholar]
- Chen R. Interactions between inhibitory and excitatory circuits in the human motor cortex. Exp Brain Res. 2004;154:1–10. doi: 10.1007/s00221-003-1684-1. [DOI] [PubMed] [Google Scholar]
- Chen R, Cros D, Curra A, Di Lazzaro V, Lefaucheur JP, Magistris MR, Mills K, Rosler KM, Triggs WJ, Ugawa Y, Ziemann U. The clinical diagnostic utility of transcranial magnetic stimulation: report of an IFCN committee. Clin Neurophysiol. 2008;119:504–532. doi: 10.1016/j.clinph.2007.10.014. [DOI] [PubMed] [Google Scholar]
- Chen R, Yung D, Li JY. Organization of ipsilateral excitatory and inhibitory pathways in the human motor cortex. J Neurophysiol. 2003;89:1256–1264. doi: 10.1152/jn.00950.2002. [DOI] [PubMed] [Google Scholar]
- Chu J, Wagle-Shukla A, Gunraj C, Lang AE, Chen R. Impaired presynaptic inhibition in the motor cortex in Parkinson disease. Neurology. 2009;72:842–849. doi: 10.1212/01.wnl.0000343881.27524.e8. [DOI] [PubMed] [Google Scholar]
- Daskalakis ZJ, Christensen BK, Fitzgerald PB, Roshan L, Chen R. The mechanisms of interhemispheric inhibition in the human motor cortex. J Physiol. 2002;543:317–326. doi: 10.1113/jphysiol.2002.017673. [DOI] [PMC free article] [PubMed] [Google Scholar]
- Di Lazzaro V, Oliviero A, Profice P, Insola A, Mazzone P, Tonali P, Rothwell JC. Direct demonstration of interhemispheric inhibition of the human motor cortex produced by transcranial magnetic stimulation. Exp Brain Res. 1999;124:520–524. doi: 10.1007/s002210050648. [DOI] [PubMed] [Google Scholar]
- Di Lazzaro V, Oliviero A, Profice P, Saturno E, Pilato F, Insola A, Mazzone P, Tonali P, Rothwell JC. Comparison of descending volleys evoked by transcranial magnetic and electric stimulation in conscious humans. Electroencephalogr Clin Neurophysiol. 1998;109:397–401. doi: 10.1016/s0924-980x(98)00038-1. [DOI] [PubMed] [Google Scholar]
- Duque J, Mazzocchio R, Dambrosia J, Murase N, Olivier E, Cohen LG. Kinematically specific interhemispheric inhibition operating in the process of generation of a voluntary movement. Cereb Cortex. 2005;15:588–593. doi: 10.1093/cercor/bhh160. [DOI] [PubMed] [Google Scholar]
- Ferbert A, Priori A, Rothwell JC, Day BL, Colebatch JG, Marsden CD. Interhemispheric inhibition of the human motor cortex. J Physiol. 1992;453:525–546. doi: 10.1113/jphysiol.1992.sp019243. [DOI] [PMC free article] [PubMed] [Google Scholar]
- Gagne M, Schneider C. Dynamic influence of wrist flexion and extension on the intracortical inhibition of the first dorsal interosseus muscle during precision grip. Brain Res. 2008;1195:77–88. doi: 10.1016/j.brainres.2007.12.021. [DOI] [PubMed] [Google Scholar]
- Gerloff C, Cohen LG, Floeter MK, Chen R, Corwell B, Hallett M. Inhibitory influence of the ipsilateral motor cortex on responses to stimulation of the human cortex and pyramidal tract. J Physiol. 1998;510:249–259. doi: 10.1111/j.1469-7793.1998.249bz.x. [DOI] [PMC free article] [PubMed] [Google Scholar]
- Guggisberg AG, Dubach P, Hess CW, Wuthrich C, Mathis J. Motor evoked potentials from masseter muscle induced by transcranial magnetic stimulation of the pyramidal tract: the importance of coil orientation. Clin Neurophysiol. 2001;112:2312–2319. doi: 10.1016/s1388-2457(01)00677-0. [DOI] [PubMed] [Google Scholar]
- Huang ZJ. GABAB receptor isoforms caught in action at the scene. Neuron. 2006;50:521–524. doi: 10.1016/j.neuron.2006.05.005. [DOI] [PubMed] [Google Scholar]
- Hubers A, Orekhov Y, Ziemann U. Interhemispheric motor inhibition: its role in controlling electromyographic mirror activity. Eur J Neurosci. 2008;28:364–371. doi: 10.1111/j.1460-9568.2008.06335.x. [DOI] [PubMed] [Google Scholar]
- Irlbacher K, Brocke J, Mechow JV, Brandt SA. Effects of GABAA and GABAB agonists on interhemispheric inhibition in man. Clin Neurophysiol. 2007;118:308–316. doi: 10.1016/j.clinph.2006.09.023. [DOI] [PubMed] [Google Scholar]
- Kaneko K, Kawai S, Fuchigami Y, Morita H, Ofuji A. The effect of current direction induced by transcranial magnetic stimulation on the corticospinal excitability in human brain. Electroencephalogr Clin Neurophysiol. 1996;101:478–482. doi: 10.1016/s0013-4694(96)96021-x. [DOI] [PubMed] [Google Scholar]
- Kobayashi M, Hutchinson S, Schlaug G, Pascual-Leone A. Ipsilateral motor cortex activation on functional magnetic resonance imaging during unilateral hand movements is related to interhemispheric interactions. Neuroimage. 2003;20:2259–2270. doi: 10.1016/s1053-8119(03)00220-9. [DOI] [PubMed] [Google Scholar]
- Kujirai T, Caramia MD, Rothwell JC, Day BL, Thompson PD, Ferbert A, Wroe S, Asselman P, Marsden CD. Corticocortical inhibition in human motor cortex. J Physiol. 1993;471:501–519. doi: 10.1113/jphysiol.1993.sp019912. [DOI] [PMC free article] [PubMed] [Google Scholar]
- Kukaswadia S, Wagle-Shukla A, Morgante F, Gunraj C, Chen R. Interactions between long latency afferent inhibition and interhemispheric inhibitions in the human motor cortex. J Physiol. 2005;563:915–924. doi: 10.1113/jphysiol.2004.080010. [DOI] [PMC free article] [PubMed] [Google Scholar]
- Lee H, Gunraj C, Chen R. The effects of inhibitory and facilitatory intracortical circuits on interhemispheric inhibition in the human motor cortex. J Physiol. 2007;580:1021–1032. doi: 10.1113/jphysiol.2006.126011. [DOI] [PMC free article] [PubMed] [Google Scholar]
- Li JY, Espay AJ, Gunraj CA, Pal PK, Cunic DI, Lang AE, Chen R. Interhemispheric and ipsilateral connections in Parkinson's disease: relation to mirror movements. Mov Disord. 2007;22:813–821. doi: 10.1002/mds.21386. [DOI] [PubMed] [Google Scholar]
- McDonnell MN, Orekhov Y, Ziemann U. The role of GABAB receptors in intracortical inhibition in the human motor cortex. Exp Brain Res. 2006;173:86–93. doi: 10.1007/s00221-006-0365-2. [DOI] [PubMed] [Google Scholar]
- Mayston MJ, Harrison LM, Stephens JA. A neurophysiological study of mirror movements in adults and children. Ann Neurol. 1999;45:583–594. doi: 10.1002/1531-8249(199905)45:5<583::aid-ana6>3.0.co;2-w. [DOI] [PubMed] [Google Scholar]
- Muller-Dahlhaus M, Liu Y, Ziemann U. Inhibitory circuits and the nature of their interactions in the human motor cortex a pharmacological TMS study. J Physiol. 2008;586:495–514. doi: 10.1113/jphysiol.2007.142059. [DOI] [PMC free article] [PubMed] [Google Scholar]
- Nelson AJ, Hoque T, Gunraj C, Ni Z, Chen R. Bi-directional interhemispheric inhibition during unimanual sustained contractions. BMC Neurosci. 2009;10:31. doi: 10.1186/1471-2202-10-31. [DOI] [PMC free article] [PubMed] [Google Scholar]
- Nelson AJ, Hoque T, Gunraj CA, Ni Z, Chen R. Impaired interhemispheric inhibition in writer's cramp. Neurology. 2010;29:1634–1640. doi: 10.1212/WNL.0b013e3181ebdda0. [DOI] [PMC free article] [PubMed] [Google Scholar]
- Ni Z, Gunraj C, Nelson AJ, Yeh IJ, Castillo G, Hoque T, Chen R. Two phases of interhemispheric inhibition between motor related cortical areas and the primary motor cortex in human. Cereb Cortex. 2009;19:1654–1665. doi: 10.1093/cercor/bhn201. [DOI] [PubMed] [Google Scholar]
- Oldfield RC. The assessment and analysis of handedness: the Edinburgh inventory. Neuropsychologia. 1971;9:97–113. doi: 10.1016/0028-3932(71)90067-4. [DOI] [PubMed] [Google Scholar]
- Perez-Garci E, Gassmann M, Bettler B, Larkum ME. The GABAB1b isoform mediates long-lasting inhibition of dendritic Ca2+ spikes in layer 5 somatosensory pyramidal neurons. Neuron. 2006;50:603–616. doi: 10.1016/j.neuron.2006.04.019. [DOI] [PubMed] [Google Scholar]
- Sailer A, Molnar GF, Cunic DI, Chen R. Effects of peripheral sensory input on cortical inhibition in humans. J Physiol. 2002;544:617–629. doi: 10.1113/jphysiol.2002.028670. [DOI] [PMC free article] [PubMed] [Google Scholar]
- Sanger TD, Garg RR, Chen R. Interactions between two different inhibitory systems in the human motor cortex. J Physiol. 2001;530:307–317. doi: 10.1111/j.1469-7793.2001.0307l.x. [DOI] [PMC free article] [PubMed] [Google Scholar]
- Vigot R, Barbieri S, Brauner-Osborne H, Turecek R, Shigemoto R, Zhang YP, et al. Differential compartmentalization and distinct functions of GABAB receptor variants. Neuron. 2006;50:589–601. doi: 10.1016/j.neuron.2006.04.014. [DOI] [PMC free article] [PubMed] [Google Scholar]
- Werhahn KJ, Fong JK, Meyer BU, Priori A, Rothwell JC, Day BL, Thompson PD. The effect of magnetic coil orientation on the latency of surface EMG and single motor unit responses in the first dorsal interosseous muscle. Electroencephalogr Clin Neurophysiol. 1994;93:138–146. doi: 10.1016/0168-5597(94)90077-9. [DOI] [PubMed] [Google Scholar]
- Ziemann U, Rothwell JC, Ridding MC. Interaction between intracortical inhibition and facilitation in human motor cortex. J Physiol. 1996;496:873–881. doi: 10.1113/jphysiol.1996.sp021734. [DOI] [PMC free article] [PubMed] [Google Scholar]