

Abstract
Breath analysis is a powerful noninvasive technique for the diagnosis and monitoring of respiratory diseases, including asthma and chronic obstructive pulmonary disease (COPD). Nitric oxide (NO) and carbon monoxide (CO) are markers of airway inflammation and can indicate the extent of respiratory diseases. We have developed a compact fast response laser system for analysis of multiple gases by infrared absorption. The instrument uses room temperature quantum cascade lasers to simultaneously measure NO, CO, carbon dioxide (CO2) and nitrous oxide (N2O) in exhaled breath. Four breath flow rates are employed to explore their exchange dynamics in the lungs and airways. We obtain 1-s detection precisions of 0.5-0.8 parts-per-billion (ppb) for NO, CO, and N2O with an instrument response time of less than 1 s. The breath analysis system has been demonstrated in a preliminary study of volunteers. It is currently deployed in a trial clinical study.
Index Terms: Infrared spectroscopy, nitric oxide, quantum cascade laser
I. Introduction
Elevated nitric oxide in exhaled breath can serve as a biomarker of airway inflammation [1]. Asthma and chronic obstructive pulmonary disease (COPD), diseases that involve airway inflammation, affect millions of Americans every year. In the United States, about 15 million people have asthma of which nearly 5 million are children [2]. About 12.1 million adults over the age of 25 were diagnosed with COPD in 2001, but many others are believed to go undiagnosed [3]. Asthma is a chronic inflammation of the airways that involves airflow obstruction and increased airway responsiveness to a variety of stimuli [4]. Although asthma affects people of all ages, it often starts in childhood. Asthma is a growing medical problem with its incidence increasing in recent years. Chronic obstructive pulmonary disease (COPD) is a chronic disease of the airways characterized by a gradually increasing loss of lung function. The classification of COPD includes chronic bronchitis, chronic obstructive bronchitis, or emphysema. Cigarette smoking is the most important risk factor for COPD in the U.S.
Conventional lung diagnostics of asthma and COPD include spirometry and peak flows. The spirometer measures how much and how fast a patient can expel air from the lungs after a deep breath. This test, however, cannot be used with children under the age of five, has poor sensitivity, and is not specific. Instrumentation for fast noninvasive diagnosis, monitoring, and management of lung disease, and for the evaluation of drug efficacy is needed. Patients and physicians want such devices to avoid invasive procedures, to minimize physical trauma and risk, and to lower health care costs.
Breath analysis has great potential in the diagnosis and treatment of respiratory problems, including asthma, cystic fibrosis, and chronic obstructive pulmonary disease. Through monitoring identified biomarkers of each disease, improved patient care is possible. These lung diseases are characterized by chronic inflammation of the lungs and associated with oxidative stress, a process initiated by reactive oxygen species; i.e., unstable compounds with unpaired electrons. Inflammation in the lungs causes the release of increased amounts of reactive oxygen species, damaging the lung tissues of patients with asthma or COPD.
The presence of nitric oxide (NO) and carbon monoxide (CO) in breath have been identified as biomarkers of asthma and COPD [5], [6]. Malmberg et al. [7] found that exhaled NO is superior to other more accepted guidelines, including baseline respiratory function and bronchodilator responsiveness, in identifying preschool children with asthma. Exhaled NO is also directly correlated with extent of untreated asthma. Furthermore, research has shown that NO decreases with corticosteroid treatment [6]-[9].
Carbon monoxide is a marker of oxidative stress, produced by the stress protein heme oxygenase [(HO)-1], and also of inflammation [6]. Increased levels of CO have been measured in asthmatics [6], [10]. Healthy adults typically have between 1 and 3 parts-per-million (ppm) of CO in exhaled breath, the sum of inspired and endogenous CO. Endogenous carbon monoxide comes from heme metabolism in the tissues including those of the lung. The carbon monoxide is transferred from the blood stream to alveolar air and thus there is an alveolar source of exhaled CO. Questions, however, remain about the contribution of the airways to breath CO.
The elevation of CO in the breath of asthmatics compared to normal subjects is less than the elevation in NO. Although the effect of steroid treatment on exhaled CO in mild asthmatics is negligible, when acute exacerbation of asthma occurs, CO levels increase and are reduced following corticosteroid treatment [6]. Exhaled CO is also elevated in cystic fibrosis (CF), and clinically stable CF [11], [12]. For patients with COPD, carbon monoxide is not considered as useful a biomarker because smoking causes a significant increase in exhaled breath CO, and a large fraction of COPD patients are smokers or ex-smokers [6], [13].
A. Models
There has been increased interest in developing models to characterize the exchange of NO in the respiratory system [1], [14]-[19]. It has been observed that breath NO concentration is an inverse function of flow [17], [19], [20]. One explanation for this inverse relationship is that the nonexpansive airway region of the lung is the primary source of the exhaled NO [19]. As flow increases, there would be an increase in the rate of washout in the fixed volume of the airways, thereby decreasing the concentration. Meanwhile, the source of carbon dioxide (CO2) is in the expansible alveoli. Because the volume of the alveoli can change, as the alveoli shrink during exhalation, the CO2 in the alveolar gas remains approximately constant and is thus independent of flow [19], [21]. NO exchange dynamics are significantly different from other well studied gases, including CO2. Silkoff et al. reported a nonlinear relationship between exhaled NO and exhalation flow rate [17] with a steep slope at flow less than ~ 0.02 L/s, due to increasing diffusion of NO from airway walls. As the flow exceeded 0.02 L/s, exhaled NO was transitioned to a point of being mostly due to convection from alveoli [17].
In a two-compartment model George et al. [15] characterize NO exchange using three flow-independent exchange parameters to describe the airway compartment and the alveolar region. The model is applied to exhaled nitric oxide measured at several different exhalation flow rates, to separately assess alveolar and bronchial NO [17], [19]. In asthmatics, a measured increase in bronchial NO flux has been observed, while alveolar NO concentration is usually in the normal range [22]. These alveolar and bronchial NO parameters also correlate with disease severity in asthma. There is evidence that this method upon further refinement will be extremely valuable in assessing disease severity and the efficacy of treatment.
Real-time sensitive measurement techniques make possible accurate measurements and definitive studies. Better determination of the NO exchange parameters will improve the specificity of detecting altered NO exchange dynamics that differentially impact the two regions of the lungs. If these NO parameters are uniquely altered in different lung states, such as asthma, cystic fibrosis, COPD, and allergic rhinitis, as proposed by George et al. [15], then understanding them could lead to improved clinical management of these diseases.
There are a several types of sensors now applied to measuring exhaled nitric oxide. The U.S. Food and Drug Administration has approved three commercial instruments for use as exhaled nitric oxide analyzers in the U.S. The Niox chemiluminescent device was the first to receive approval, followed by the Niox-MINO electrochemical device and Apieron solid-state gel detection device [1]. There have been questions raised about the agreement of the instruments, even between those of the same kind operated in different locations, which might be due to accuracy of flow measurement, calibration, etc. [1]. Presently available commercial NO breath analyzers also are not able to measure other exhaled gases. Exhaled carbon monoxide is often measured with electrochemical monitors or nondispersive infrared (NDIR) analyzers [5]. Although inexpensive, electrochemical systems have the problem of interference from other compounds.
Recently, there has been substantial progress in the development of laser-based systems in the mid-infrared for breath analysis. Tunable infrared laser spectroscopy is a sensitive detection method for many small molecules, including NO and CO. Until recently, these systems have typically used lead–salt diode lasers [23], [24]. These systems have been hampered by the need for cryogenic cooling (e.g., liquid nitrogen), or the need of calibration gases which has made the deployment of such instruments in a medical environment challenging. Roller et al. at EKIPS Technologies [25], [26] have developed a mid-IR tunable laser absorption system based on lead–salt diode lasers, operating at cryogenic temperatures, but with a closed cycle refrigerant instead of liquid nitrogen. They have applied this system to detection of NO in exhaled breath with a detection limit of 1.5 ppb in 4 s. Tittel’s group at Rice University has developed a cavity ringdown spectroscopy (CRDS) instrument [27], [28], and a system with off-axis integrated cavity output spectroscopy (OA-ICOS) to detect nitric oxide in breath [29], [30]. They report detection limits of 16 ppb with CRDS and 2 ppb for OA-ICOS with wavelength modulation. In both systems, the integration time was 15 s. There have also been reports of laser-based measurements of exhaled CO [31]-[33].
Our real-time breath analysis instrument is based upon tunable infrared laser differential absorption spectroscopy (TILDAS) using room-temperature quantum cascade lasers. With these lasers we overcome many of the difficulties encountered in high-resolution infrared absorption with lead–salt tunable diode lasers. Quantum cascade (QC) lasers have greatly improved laser stability, reproducible behavior, and operate without cryogens [34]-[36].
The QC-TIDLAS method has distinct advantages over other methods of gas analysis. Infrared absorption is an absolute technique whereby the concentration of the trace gas can be obtained from fundamental molecular parameters (line strengths, broadening coefficients, partition functions) and physical measurements (sample pressure, temperature, and absorption path length). Thus, in principle, the TILDAS method can be used without reliance on calibration cylinders or permeation sources which may vary with time, and are expensive to obtain and maintain. Combining thermoelectrically cooled (TE) detectors with TE cooled lasers yields a fully noncryogenic system. The Aerodyne Research, Inc. (ARI) QC system achieves fast response with a multipass sampling cell of small volume (0.5 l) and long pathlength (76 m) for high sensitivity. The fast response and sensitivity of this instrument supports the need to examine NO and CO formation and exchange in the different regions of the respiratory system, which may lead to the development of improved models of exchange dynamics in the respiratory airways. The identified trace species, NO, CO, CO2, and N2O, as well as others (e.g., C2H6, OCS) are indicators of different aspects of lung disease. Simultaneous quantification of multiple trace species, marking different aspects of respiratory disease, is a powerful approach to the diagnosis and study of lung disease.
II. Experimental Methods
A. Breath Analysis System
We have developed a fully noncryogenic laser based system for measuring gaseous components of breath. The system simultaneously measures multiple breath gases in real time. The breath analysis instrument simultaneously measures NO, CO2, CO, and N2O. We perform breath tests at multiple flow rates to investigate the dynamics of the components in airways. The overall system, shown in Fig. 1, consists of two compact quantum cascade laser instruments and a multi-flow sampling manifold. All of the components, including a vacuum pump and water cooling circulator, are mounted in a single rack for portability. A laptop computer with wireless capability is used to operate two laser instruments and the breath analysis software interface. The sampling pump (Variac dry scroll IDP-3) provides subsecond time response.
Fig. 1.

ARI Breath Analyzer. The self-contained, portable system includes two mini ARI QCL instruments (black rack mounted boxes) and multi-flow sampling system (mounted behind the white panel near top of unit). Also visible are the Thermocube coolant circulator and small compressed air cylinder for balloon valves in the sampling system. A 60-L/min scroll pump is located on the bottom shelf.
The entire system can be turned on and initiated to take baseline data automatically without operator intervention. We have written a breath analysis software interface to collect patient information and automatically carry out a series of breath tests at four different exhalation flow rates. In the following sections, we will describe the main components of the system.
B. Compact Quantum Cascade Laser Instruments
The breath analysis system contains two compact quantum cascade laser instruments operated in series using a single pump and a single sampling system. Each instrument is a fully non-cryogenic instrument for trace gas measurements based on a pulsed distributed feedback (DFB) QC laser and a TE cooled detector. We have designed the instrument for fast response and sub-ppb detection limits. It has a compact design in a rack mountable box of dimensions 17″(W)×24″(D)×10.5″(H) and weight 25 kg. A detailed description of this compact, high-sensitivity instrument and its performance is given in a recent publication [37]. One may monitor different trace gases by changing the laser and possibly the detector. The two QC instruments in our system are configured with room temperature pulsed QC lasers (Alpes Lasers) for two mid-infrared regions. One instrument has a laser operating at 1900 cm−1 for NO and CO2 detection. The second instrument operates at 2190 cm−1 for CO and N2O monitoring.
C. Sampling System
We have designed the system for breath analysis studies using multiple exhalation flows. Flow rates of 0.6, 3, 6, and 20 liters per minute (L/min) were selected based on modeling studies of NO dynamics [14]-[19]. By measuring the trace gas concentrations at different exhalation rates, we can investigate the sources and dynamics of NO in the airways, working with respiratory models of NO exchange such as those developed by Högman, George, and Silkoff [1], [14]-[19].
Different exhalation flows are obtained by breathing through different-sized orifices in the sampling line. Each of the flows is obtained at an expiratory resistance between 5 and 13 cm H2O. A minimum of 5 cm H2O is recommended to close off the nasal plenum [38], preventing its contamination of the air from the lower airways. This is necessary when measuring nitric oxide in the breath as there typically are high levels of NO in the nasal passages. We have selected appropriately sized orifices for our desired flow rates and these are mounted in the sampling manifold. An automated valve system is used to select the appropriate orifice for each preset flow rate.
A sketch of the sampling system is given in Fig. 2. We have designed a sampling system which allows for fast flows at low restrictions and comfortable exhalation pressures. Unnecessary dead volume was minimized to prevent excess delay or broadening of signals. The flow into the instrument absorption cells is maintained at a constant flow rate (2.8 slpm) by an orifice directly after the valve. This helps to avoid issues that might result from changes in cell pressure and flow during testing.
Fig. 2.
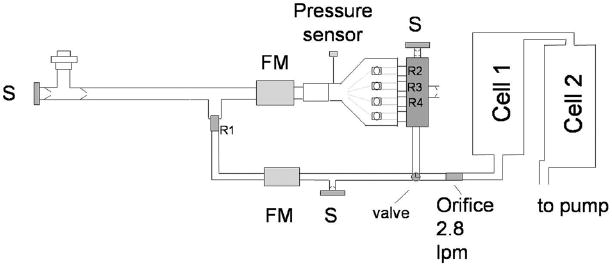
Sampling scheme. FM=flowmeter; S = NO scrubber; R1, R2, R3, and R4 are restrictors to set exhalation flow. The two sampling cells are components of the QCL instruments.
A nonrebreathing valve (NRV) in a tee configuration (Hans–Rudolph) with a bacterial/viral mouthpiece filter is used to sample the breath (see left side of Fig. 2). The nonrebreathing valve has two one-way valves—one is on the scrubber port and allows air to enter for inhalation, and the second valve is on the exit port to allow air to be exhaled into the sampling system but not be inhaled from there. The subject inhales air through the scrubber which removes nitric oxide to less than 5 ppb. Exhaled air enters the main sampling manifold and follows one of the two main flow pathways in the manifold. Both main paths join at a three-way solenoid valve with common flow going to the instrument line. The three higher exhalation flows (3, 6, and 20 L/min) follow the primary flow path (drawn as the top path in Fig. 2), normally connected to the instrument line. It uses a five-way Gatlin-shaped unit (Hans–Rudolph) with four inflatable balloon valves. This path has larger diameter lines and valves (e.g., 3/8–in o.d. tubing) to allow for higher flows with little restriction. The second pathway is for the slowest flow, 0.6 L/min. It has smaller diameter sampling lines (0.25-in o.d. tubing), necessary to minimize the delay and sampling time. The expiratory resistance or pressure in all tests is measured with a miniature pressure sensor (Honeywell, ASCX01DN).
The lower flow pathway is connected to the instrument line by switching the valve located before the instrument orifice. The valve normally connects the larger flow pathway with the instruments. In a breath test at 0.6 L/min, the breath flow passes through the orifice (R1, equal to 0.056-cm diameter) and a mass flowmeter (TSI model 41211). Since the flow is less than the total flow to the instrument, additional NO-free air is added as a diluent. The exact dilution flow (instrument flow minus measured breath flow) is calculated to correct the measured gas concentrations.
The higher flow pathway utilizes larger diameter tubing and valves upstream of the orifices to minimize restrictions. The flow passes first through a mass flowmeter (TSI 40211) before going to the Gatlin five-way valve. We are presently using just three of the four balloon valves and exit ports with the extra port plugged. Three outputs on the Gatlin are connected to a specially designed manifold to bring all flows into a single point, minimizing dead volume. Each Gatlin output connects to a port on the manifold using a medical tapered connector. We have mounted an appropriate orifice in each port to obtain 3, 6, and 20 L/min exhalation flows at expiratory pressure of approximately 7 cm H2O. The orifice diameters (R2, R3, and R4) are 0.14, 0.22, and 0.38 cm, respectively. When a particular flow is selected, the corresponding balloon valve is opened. These valves are normally inflated (i.e, closed) in the experiments. The air is released to open the valve. Flow goes through the orifice to the manifold and on to the instruments. The manifold has two additional ports: a one-way valve to release excess flow is in one port; the other has a one-way valve and scrubber in case flow falls below that of the instrument flow. A small restriction before the scrubber prevents flow from unnecessarily being drawn through it. We measure the exhaled flow through the orifices and the back pressure from the breath. As the back pressure varies, there is a corresponding change in flow. This measured flow is displayed to the subject who tries to maintain it at the target flow rate. If the exhalation rate falls below the fixed flow into the laser systems, scrubbed room air is added. If the flow is greater than the instrument flow, the excess is released into the room. The pressure in the sampling line before the instrument orifice is thus kept at atmospheric pressure.
We have automated the switching between the different flows. Each of the balloon valves is connected to the compressed air source via a solenoid valve. In the normal state, a balloon valve is connected to the compressed air and is inflated (i.e, valve is closed). When the solenoid valve is switched, the compressed air source is blocked, air is released from the balloon valve, and the valve is open. The valves are controlled by the breath analysis software interacting with the TDLWintel laser control and data acquisition program operating on one of the instruments.
D. Measurement Procedures
The breath analysis measurements are designed using the American Thoracic and European Respiratory Societies (ATS/ERS) recommendations for exhaled NO studies [38]. Briefly, NO-free air (NO < 5 ppbv), obtained by passing room air through a charcoal-based scrubber, is inhaled for 2–3 s through the mouth to total lung capacity (TLC), or near TLC and then exhaled immediately. No breath hold techniques or nose clips are used. A patient exhales against an expiratory resistance while maintaining a positive mouthpiece pressure, minimizing nasal NO leakage. A constant flow is possible by biofeedback with the patient being asked to keep the flow at a fixed target flow using a real-time graphical display.
Our standard protocol is to measure four different exhalation flow rates with two or three tests performed at each flow. As described above, a nonrebreathing valve is used to sample the breath. The ATS/ERS recommends that exhalation be against an expiratory resistance of at least 5 cm H2O. Each of the flows in our protocol is obtained at an expiratory resistance between 5 and 13 cm H2O.
We have developed a dedicated software interface for overall instrument control and completion of measurement protocols. The program runs on a laptop computer that interacts with the two laser instruments via a wireless router. The program collects patient information, controls flow selection and therefore the valve selection, and performs data acquisition and storage. The interface stores concentration data, both measured and targeted flow rate, and the expiratory resistive pressure for each breath test. During each test, graphics are displayed to aid the patient in exhaling at the target flow rate. The volunteer is asked to exhale at the target flow for a set time period (20 s for 3 and 6 L/min; 30 s for 0.6 L/min; and 8 s for 20 L/min). After each test the concentrations, flow and pressure are each displayed as a function of time.
The breath analysis interface has two measurement options. One can either select to run the standard protocol (3, 0.6, 6, and 20 L/min target flows in that order), or choose a “flow selection” option. The latter allows any of the four flows to be selected for a test. In all of the tests presented here, the standard protocol was selected.
III. Results
We have demonstrated excellent sensitivity and precision to the detection of breath components. The detection limit is determined by the instrument noise level, which is expressed as a function of averaging time. For data reported at 1 Hz, we typically obtain an RMS noise for NO of 0.2 to 0.5 ppb. Sample data for nitric oxide is displayed in Fig. 3. In the lower panel we show an Allan variance plot, i.e., the variance as a function of averaging time. The NO concentration noise (standard deviation) with 1 s averaging is 0.30 ppb. The minimum in the Allan plot indicates the ultimate noise limit (0.05 ppb), at 198 s averaging time. This is an indication of the overall system stability. We obtain precisions of 0.5 ppb Hz−1/2 for NO, 0.8 ppb Hz−1/2 CO, and 0.8 ppb Hz−1/2 N2O. The sensitivity is sufficient and necessary for breath analysis over a range of exhalation rates.
Fig. 3.

Instrument noise measuring NO at cm−1. Upper trace: 11.5-h continuous measurement of nitric oxide in “zero air.” Lower trace: Allan variance for the data sample, showing noise in 1-s of 0.3 ppbv, and a minimum noise of 0.05 ppbv with 198-s averaging. The straight line shows ideal averaging with variance depending on the inverse of averaging time.
We have studied the flow response of the overall breath analysis system by introducing 0.5 ppm NO in nitrogen into the nonrebreathing valve where the patient normally exhales. The system is configured such that NO is measured by laser instrument 1, followed by N2O and CO measured by instrument 2. Data are recorded at 10 Hz. Time response data for a sample flow rate of 3 L/min are shown in Fig. 4. The sample gas is introduced using a solenoid valve to quickly switch between room air and cylinder gas containing 0.5 ppm NO and 130 ppb CO. The cylinder gas is introduced at the appropriate pressure to simulate exhaled breath at the target flows. Tests were conducted at flow rates between 0.5 and 6 L/min and the delay times for the two instruments were measured as shown in Fig. 5. There is less than 1-s delay between the instruments and the longest delay for the first instrument is 3.2 s at the slowest flow rate.
Fig. 4.
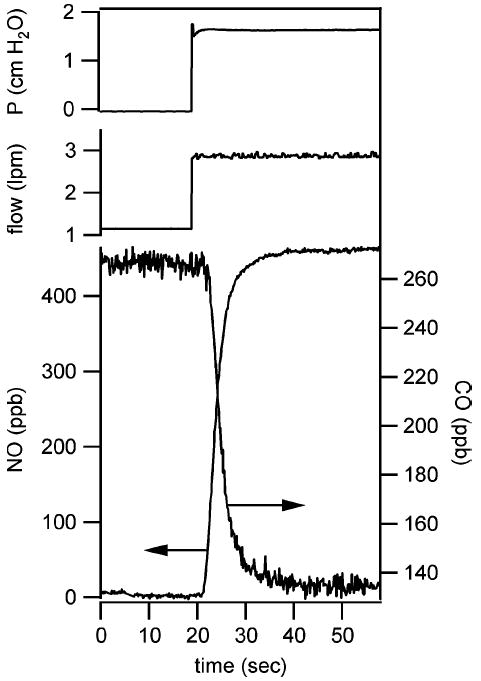
System time response to change in sample gas, introduced to simulate a 3-L/min exhaled breath test. NO is measured by the first QCL instrument. CO is measured by the second QCL instrument. The gas flow of the two instruments is in series. The arrows indicate appropriate axis for the two data sets.
Fig. 5.

Delay times of the two QCL instruments in the breath analyzer over a exhalation flow range of 0.6 to 6 L/min.
A. Breath Analysis Results
We have conducted preliminary studies with volunteers at Aerodyne Research. A total of 20 adults (17 male, 3 female) and 2 youths (1 male, 1 female) participated in the preliminary study. Informed consent was received for all participants in the study, following the IRB approved protocol. Because this was a preliminary study, we performed only breath measurements and no other medical tests. We used the system’s standard protocol for each subject; that is, two or three breath tests were conducted at each of the four exhalation rates. The total time per volunteer to perform all these maneuvers was approximately 20 min.
Real-time data were collected at 10 Hz during all testing. In addition, spectra were saved during every breath. Spectra of exhaled breath at exhalation rate of 6 L/min from a healthy male are shown in Figs. 6 and 7. In both figures, the points in the transmission spectra are the measured data and the solid line is the nonlinear least squares fit. There is 18.1 ppb NO and 4.5% CO2 in the sample of Fig. 6 and 2.2 ppm CO and 417 ppb N2O in the sample of Fig. 7.
Fig. 6.
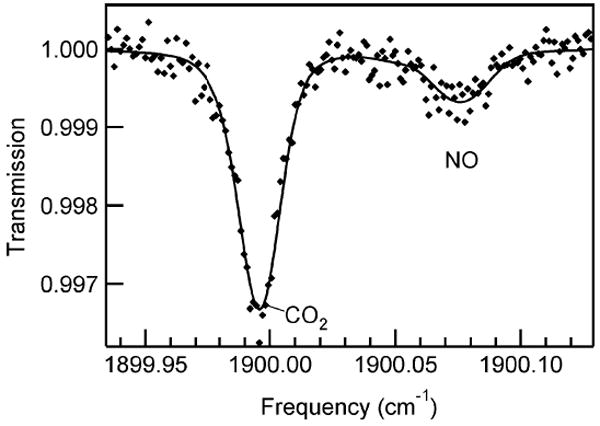
Infrared QCL spectrum of 18.1 ppb NO and 4.5% CO2 in exhaled breath (6-L/min exhaled flow). Spectrum was collected at 10 Hz. Markers are data and the solid line is the nonlinear least squares fit to the data. Sample pressure 35 Torr.
Fig. 7.

Infrared QCL spectrum of exhaled breath containing 2.2 ppm CO and 417 ppb N2O, collected at 6-L/min exhaled flow. A weak CO2 line is visible and included in the spectral fit. Markers are data points and the solid line is the nonlinear least squares fit to the data. Sample pressure 35 Torr.
During each breath we simultaneously measure four trace gas concentrations, exhalation flow, and expiratory pressure. An example of simultaneous data set collected from a healthy 32-year-old male (nonsmoker) is shown in Fig. 8. The data were collected at an exhalation flow of 3 L/min. After completion of the breath maneuver, the valve corresponding to 20 L/min is opened to facilitate removal of residual breath sample in the system before the next test. We do not include this post-maneuver data in Fig. 8 as it is not representative of normal instrument behavior. While plateaus in NO and N2O are attained, both CO and CO2 continued to increase during exhalation. Although we expect to see a plateau in NO, we have observed variability in the profile of N2O in exhaled breath. The source of this variability is under investigation.
Fig. 8.
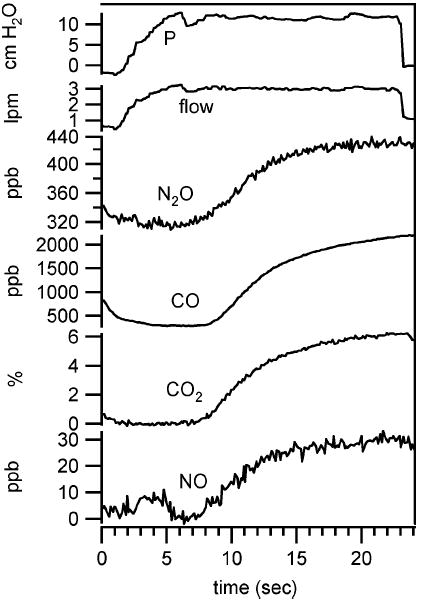
Simultaneous exhaled breath data collected from healthy male (non-smoker) at exhalation flow of 3 L/min.
We compare the NO and CO levels in exhaled breath at the ATS standard NO monitoring exhalation rate of 3 L/min (i.e., 50 mL/s) for the adult subjects in our study. The levels for each of the two or three breath tests per subject are displayed in Fig. 9 as a function of subject i.d. number. The variability between tests for a particular subject is small but larger than the instrumental noise (see Table I). In this preliminary study we observed between 9.6 and 114.5 ppb NO for adult subjects. None of the subjects reported being asthmatic, although two reported occasional asthma symptoms without a diagnosis of asthma. Subject 27 reported occasional symptoms and subject 30 reported to have seasonal allergies and associated symptoms, but not at the time of testing. Both Subjects 27 and 30 have been prescribed inhaled corticosteroids to be taken as needed. One subject (i.d. 33) reported to be asthmatic as a child, but no longer. This subject’s nitric oxide level was among the high levels observed. Subject 24 with the highest measured NO among this group, reported having a lingering respiratory infection. Respiratory infections are known to increase exhaled NO [38] and may have been the source of the elevated level of NO in this case. The CO levels for all but two subjects were in the 1–3 ppm range. The two subjects with higher breath CO (i.d. 29 and 33) are smokers, with 0.6 and 8 h since last previously smoked cigarette before testing, respectively.
Fig. 9.
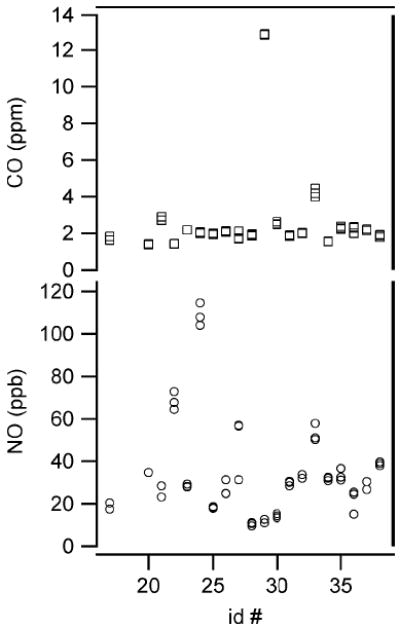
Comparison of exhaled NO and CO levels from 20 healthy adults. All data in the figure were collected at the target exhalation flow of 3 L/min.
TABLE I.
Comparison of Standard Deviation of Test Results and Instrument Precision
| Breath Gas | Average σ per subject | Instrumental noisea |
|---|---|---|
| NO | 2.9 ppb | 0.2 ppb |
| CO | 75 ppb | 0.6 ppb |
| CO2 | 0.2% | 0.06 % |
instrumental noise over the integration time of the measurement
IV. Conclusion
We have demonstrated a novel laser-based instrument for breath analysis of multiple components of human breath. This new QCL system is totally cryogen free and integrated into a portable, self-contained unit. The system features the capability of simultaneous detection of multiple trace species. It has a sampling system for breath analysis at multiple exhalation flow rates for enhanced investigations of nitric oxide and carbon monoxide dynamics.
Although there have been many studies and advances in the field since nitric oxide was first measured in exhaled breath, many questions remain including a need to critically study the role of NO in physiology. There is also a need to better understand exhaled CO dependence on inflammation and disease. It has been suggested that N2O is a biomarker of immune response to infectious disease [39]. We plan to look at the distribution of N2O levels and any relationship it may have to disease extent and type. The ARI instrument is currently deployed in a clinic in a study comparing NO, CO, and N2O breath levels from pediatric and adult asthmatics, adult COPD patients, allergic rhinitis patients, and healthy subjects.
The ARI breath analysis system can be easily extended to the study of other breath biomarkers. Ethane, ammonia, ethylene, and carbonyl sulfide are among many biomarkers of disease. Cystic fibrosis patients are susceptible to chronic respiratory infections by opportunistic bacteria, which in turn produce sulfide, including carbonyl sulfide (OCS). Current techniques are limited in their ability to evaluate the presence of bacteria and are fairly invasive. A recent study by Kamboures et al. [40], however, identified OCS as a potential biomarker of respiratory bacterial colonization in CF. A breath analyzer for OCS would be a valuable clinical tool to help prevent and treat chronic infections associated with CF . We have recently demonstrated detection of OCS using a pulsed QC laser and 76-m cell with sensitivity of 0.05 ppb. Ethane is a biomarker of oxidative stress and free radical induced lipid peroxidaton, a process in which oxidants can damage the lung tissue. Present in parts per trillion (pptv) to several parts per billion (ppbv) in breath, ethane is considered to be the most specific volatile marker of this process [41]. Lipid peroxidation has been shown to be increased in asthmatics, and patients with cystic fibrosis or COPD [42], [43]. Like NO, it might be a predictor of asthma severity.
The medical community has recognized a need for innovative instrumentation which is able to rapidly and accurately monitor biomarkers in exhaled human breath in a noninvasive procedure. Subsecond measurements would provide the ability to map out the origin of these biomarkers, and gain critical information on the relationship of their origin and lung disease (i.e., nonaveolor versus aveolor air). The real time breath analysis instrument is based upon tunable infrared laser differential absorption spectroscopy using room-temperature quantum cascade lasers, overcoming many of the difficulties encountered using lead–salt tunable diode lasers. Noninvasive routine procedures would aid in the correct diagnosis and monitoring of the severity of these diseases and would be more accepted by patients than are invasive, sometimes painful, and costly diagnostic procedures. There is increasing interest in the medical field for using expired breath as a tool for monitoring and diagnosing respiratory diseases, as well as other diseases. The ARI breath analyzer can be adapted and applied to many different medical diagnostics applications.
Acknowledgments
The authors would like to thank R. McGovern, D. Glenn, and F. Hills for their assistance in the construction of the ARI breath analysis system.
This work was supported in part by the U.S. National Institute of Health under Grant 5R44HL081951. The associate editor coordinating the review of this manuscript and approving it for publication was Prof. Cristina Davis.
Biographies

Joanne H. Shorter received the Ph.D. degree in physical chemistry from the Massachusetts Institute of Technology, Cambridge, in 1990.
Since 1991, she has been at Aerodyne Research, Inc., Billerica, MA where she is currently with the Center for Atmospheric and Environmental Chemistry. Her research interests include the development of laser-based sensors for atmospheric, environmental, and medical applications.

David D. Nelson, Jr. received the Ph.D. degree in chemical physics from Harvard University, Cambridge, MA, in 1987.
He joined Aerodyne Research, Inc., Billerica, MA, in 1989, and since 1997, has been the Director of Aerodyne’s Technical Facilities. His research interests include gas-phase chemical kinetics, atmospheric chemistry, and applied laser spectroscopy, including the development of laser-based field instruments for detection of trace atmospheric species.

J. Barry McManus received the Ph.D. degree in physics from Massachusetts Institute of Technology, Cambridge, MA, in 1982.
Since 1986, he has been with Aerodyne Research, Inc., Billerica, MA, where he is currently in the Center for Atmospheric and Environmental Chemistry. He is focused primarily on the development of laser spectroscopic instrumentation for environmental and atmospheric research.
Dr. McManus is a Fellow of the Optical Society of America.

Mark S. Zahniser received the Ph.D. degree in physical chemistry from the University of Pittsburgh, Pittsburgh, PA, in 1977.
He joined Aerodyne Research, Inc., Billerica, MA in 1979, where he currently leads the Center for Atmospheric and Environmental Chemistry. He is active in developing methods for in situ monitoring of trace gas fluxes using laser spectroscopy.

Donald K. Milton received the M.D. degree from Johns Hopkins University, Baltimore, MD, in 1980 and the M.OH and Dr.Ph. degrees in occupational health from Harvard School of Public Health (HSPH), Boston, MA, in 1984 and 1989, respectively.
Since 2005, he has been a Professor in the School of Health and Environment at the University of Massachusetts Lowell, Lowell, MA, and an Adjunct Senior Lecturer at HSPH. His research interests include allergen exposure and childhood and adult-onset asthma. He is currently the Director of the Maryland Institute for Applied Environmental Health, University of Maryland College Park.
Contributor Information
Joanne H. Shorter, Aerodyne Research, Inc., Billerica, MA 01821 USA (shorter@aerodyne.com)
David D. Nelson, Aerodyne Research, Inc., Billerica, MA 01821 USA (ddn@aerodyne.com)
J. Barry McManus, Aerodyne Research, Inc., Billerica, MA 01821 USA (mcmanus@aerodyne.com)
Mark S. Zahniser, Aerodyne Research, Inc., Billerica, MA 01821 USA (mz@aerodyne.com)
Donald K. Milton, Maryland Institute for Applied Environmental Health, University of Maryland College Park, College Park, MD 20742 USA (donald_milton@uml.edu)
References
- 1.Silkoff P. History, technical and regulatory aspects of exhaled nitric oxide. J Breath Res. 2008;2:037001–037008. doi: 10.1088/1752-7155/2/3/037001. [DOI] [PubMed] [Google Scholar]
- 2.U.S. Dept. of Health and Human Services. 2004;2004 [Online]. Available: http://www.nhlbi.nih.gov/health/dci/Diseases/Asthma.
- Chronic Obstructive Pulmonary Disease—Data Fact Sheet, NIH Publication-5229. Washington, DC: US Dept. of Health and Human Services and NIH; 2003. pp. 1–6. [Google Scholar]
- 4.Wood LG, Gibson PG, Garg ML. Biomarkers of lipid peroxidation, airway inflammation and asthma. Eur Respir J. 2003;21:177–186. doi: 10.1183/09031936.03.00017003a. [DOI] [PubMed] [Google Scholar]
- 5.Kharitonov SA, Barnes PJ. Exhaled markers of pulmonary disease. Am J Respir Crit Care Med. 2001;163:1693–1722. doi: 10.1164/ajrccm.163.7.2009041. [DOI] [PubMed] [Google Scholar]
- 6.Paredi P, Kharitonov SA, Barnes PJ. Analysis of expired air for oxidation products. Amer J Respir Crit Care Med. 2002;166:531–537. doi: 10.1164/rccm.2206012. [DOI] [PubMed] [Google Scholar]
- 7.Malmberg LP, Pelkonen AS, Haahtela T, Turpeinen M. Exhaled nitric oxide rather than lung function distinguishes preschool children with probable asthma. Thorax. 2003;58:494–499. doi: 10.1136/thorax.58.6.494. [DOI] [PMC free article] [PubMed] [Google Scholar]
- 8.Silkoff PE, Romero FA, Gupta N, Townley RG, Milgrom H. Exhaled nitric oxide in children with asthma receiving xolair (Omalizumab), a monoclonal anti-immunoglobulin E antibody. Pediatrics. 2004;113:308–312. doi: 10.1542/peds.113.4.e308. [DOI] [PubMed] [Google Scholar]
- 9.Mahut B, Delacourt C, Zerah-Lancner F, De Blic J, Harf A, Delclaux C. Increase in alveolar nitric oxide in the presence of symptoms in childhood asthma. Chest. 2004;125:1012–1018. doi: 10.1378/chest.125.3.1012. [DOI] [PubMed] [Google Scholar]
- 10.Zayasu K, Sekizawa K, Okinage S, Yamaya M, Ohrui T, Sasaki H. Increased carbon monoxide in exhaled air of asthmatic patients. Amer J Respir Crit Care Med. 1997;156:1140–1143. doi: 10.1164/ajrccm.156.4.96-08056. [DOI] [PubMed] [Google Scholar]
- 11.Paredi P, Shah PL, Montuschi P, Sullivan P, Hodson ME, Kharitonov SA, Barnes PJ. Increased carbon monoxide in exhaled air of patients with cystic fibrosis. Thorax. 1999;54:917–920. doi: 10.1136/thx.54.10.917. [DOI] [PMC free article] [PubMed] [Google Scholar]
- 12.Antuni JD, Kharitonov SA, Hughes D, Hodson ME, Barnes PJ. Increase in exhaled carbon monoxide during exacerbations of cystic fibrosis. Thorax. 2000;55:138–142. doi: 10.1136/thorax.55.2.138. [DOI] [PMC free article] [PubMed] [Google Scholar]
- 13.Montuschi P, Kharitonov SA, Barnes PJ. Exhaled carbon monoxide and nitric oxide in COPD. Chest. 2001;120:496–501. doi: 10.1378/chest.120.2.496. [DOI] [PubMed] [Google Scholar]
- 14.Högman M, Meriläinen P. Extended NO analysis in asthma. J Breath Res. 2007;1:024001–024008. doi: 10.1088/1752-7155/1/2/024001. [DOI] [PubMed] [Google Scholar]
- 15.George SC, Hogman M, Permutt S, Silkoff PE. Modeling pulmonary nitric oxide exchange. J Appl Physiol. 2004;96:831–839. doi: 10.1152/japplphysiol.00950.2003. [DOI] [PubMed] [Google Scholar]
- 16.Shin HW, Condorelli P, George SC. A new and more accurate technique to characterize airway nitric oxide using different breathhold times. J Appl Physiol. 2005;98:1869–1877. doi: 10.1152/japplphysiol.01002.2004. [DOI] [PubMed] [Google Scholar]
- 17.Silkoff PE, Sylvester JT, Zamel N, Permutt S. Airway nitric oxide diffusion in asthma. Am J Respir Crit Care Med. 2000;161:1218–1228. doi: 10.1164/ajrccm.161.4.9903111. [DOI] [PubMed] [Google Scholar]
- 18.Tsoukias NM, Shin HW, Wilson AF, George SC. A single-breath technique with variable flow rate to characterize nitric oxide exchange dynamics in the lungs. J Appl Physiol. 2001;91:477–487. doi: 10.1152/jappl.2001.91.1.477. [DOI] [PubMed] [Google Scholar]
- 19.Tsoukias NM, Tannous Z, Wilson AF, George SC. Single-exhalation profiles of NO and CO2 in humans: Effect of dynamically changing flow rate. J Appl Physiol. 1998;85:642–652. doi: 10.1152/jappl.1998.85.2.642. [DOI] [PubMed] [Google Scholar]
- 20.Deykin A, Massaro AF, Drazen JM, Israel E. Exhaled nitric oxide as a diagnostic test for asthma. Amer J Respir Crit Care Med. 2002;165:1597–1601. doi: 10.1164/rccm.2201081. [DOI] [PubMed] [Google Scholar]
- 21.Condorelli P, Shin HW, George SC. Characterizing airway and alveolar nitric oxide exchange during tidal breathing using a three-compartment model. J Appl Physiol. 2004;96:1832–1842. doi: 10.1152/japplphysiol.01157.2003. [DOI] [PubMed] [Google Scholar]
- 22.Lehtimaki L, Kankaanranta H, Saarelainen S, Hahtola P, Jarvenpaa R, Koivula T, Turjanmaa V, Moilanen E. Extended exhaled NO measurement differentiates between alveolar and bronchial inflammation. Amer J Respir Crit Care Med. 2001;163:1557–1561. doi: 10.1164/ajrccm.163.7.2010171. [DOI] [PubMed] [Google Scholar]
- 23.Namjou K, McCann PJ, Potter WT. Breath testing with a Mid-IR laser spectrometer. Application of Tunable Diode and Other Infrared Sources for Atmospheric Studies and Industrial Processing Monitoring II, Proc SPIE. 1999:74–80. [Google Scholar]
- 24.Konstantin L, Nadezhdinskii AI, Adamouskaya IA. Human breath trace gas content study by tunable diode laser spectroscopy technique. Infrared Phys Technol. 1996;37:181–192. [Google Scholar]
- 25.Namjou K, Roller CB, Reich TE, Jeffers JD, McMillen GL, McCann PJ, Camp MA. Determination of exhaled nitric oxide distributions in a diverse sample population using tunable diode laser absorption spectroscopy. Appl Phys B. 2006;85:427–435. [Google Scholar]
- 26.Roller C, Namjou K, Jeffers JD, Camp M, Mock A, McCann PJ, Grego J. Nitric oxide breath testing by tunable-diode laser absorption spectroscopy: Application in monitoring respiratory inflammation. Appl Opt. 2002;41:6018–6029. doi: 10.1364/ao.41.006018. [DOI] [PubMed] [Google Scholar]
- 27.Kosterev AA, Malinovsky AL, Tittel FK, Gmachl C, Ca-passo F, Sivco DL, Baillargeon JN, Hutchinson AL, Cho AY. Cavity ringdown spectroscopic detection of nitric oxide with continuous-wave quantum cascade laser. Appl Opt. 2001;40:5522–5529. doi: 10.1364/ao.40.005522. [DOI] [PubMed] [Google Scholar]
- 28.Kosterev AA, Tittel FK. Chemical sensors based on quantum cascade lasers. IEEE J Quantum Electron. 2002 Jun;38(6):582–591. [Google Scholar]
- 29.Bakhirkin YA, Kosterev AA, Curl RF, Tittel FK, Yarekha DA, Hvozdara L, Giovannini M, Faist J. Sub-ppbv nitric oxide concentration measurements using cw thermoelectrically cooled quantum cascade laser-based integrated cavity output spectroscopy. Appl Opt B. 2006;82:149–154. [Google Scholar]
- 30.Bakhirkin YA, Kosterev AA, Roller C, Curl RF, Tittel FK. Mid-infrared quantum cascade laser based off-axis integrated cavity output spectroscopy for biogenic nitric oxide detection. Appl Opt. 2004;43:2257–2266. doi: 10.1364/ao.43.002257. [DOI] [PubMed] [Google Scholar]
- 31.Fritsch T, Hering P, Mürtz M. Infrared laser spectroscopy for online recording of exhaled carbon monoxide—a progress report. J Breath Res. 2007;1:014002–014009. doi: 10.1088/1752-7155/1/1/014002. [DOI] [PubMed] [Google Scholar]
- 32.Kosterev AA, Tittel FK, Durante W, Allen M, Köhler R, Gmachl C, Capasso F, Sivco DL, Cho AY. Detection of biogenic CO production above vascular cell cultures using a near-room-temperature QC-DFB laser. Appl Phys B. 2002;74:95–99. doi: 10.1007/s003400100766. [DOI] [PubMed] [Google Scholar]
- 33.Moeskops BWM, Naus H, Cristescu SM, Harren FJM. Quantum cascade laser-based carbon monoxide detection on a second time scale from human breath. Appl Phys B. 2006;82:649–654. [Google Scholar]
- 34.Faist J, Capasso F, Sivco DL, Sirtori C, Hutchinson AL, Cho AY. Quantum cascade Laser; plus associated news article. Science. 1994;264:508. doi: 10.1126/science.264.5158.553. [DOI] [PubMed] [Google Scholar]
- 35.Capasso F, Gmachl C, Tredicucci A, Hutchinson AL, Cho AY. High performance quantum cascade lasers. Opt Photon News. 1999 Oct;:31–37. [Google Scholar]
- 36.Capasso F, Gmachl C, Sivco DL, Cho AY. Quantum cascade lasers. Phys Today. 2002 May;:33–40. [Google Scholar]
- 37.McManus JB, Shorter JH, Nelson DD, Zahniser MS, Glenn DE, McGovern RM. Pulsed quantum cascade laser instrument with compact design for rapid, high sensitivity measurements of trace gases in air. Appl Phys B. 2008;92:387–392. [Google Scholar]
- 38.American Thoracic Society and European Respiratory Society. ATS/ERS recommendations for standardized procedures for the online and offline measurement of exhaled lower respiratory nitric oxide and nasal nitric Oxide, 2005. Amer J Crit Care Med. 2005;171:912–930. doi: 10.1164/rccm.200406-710ST. [DOI] [PubMed] [Google Scholar]
- 39.McCann P, Namjou K, Roller C, McMillen G, Kamat P. IV-VI semiconductor lasers for gas phase biomarker detection. Proc SPIE. 2007;6756:675603, 1–12. [Google Scholar]
- 40.Kamboures MA, Blake DR, Cooper DM, Newcomb RL, Barker M, Larson JK, Meinardi S, Nussbaum E, Rowland FS. Breath sulfides and pulmonary function in cystic fibrosis. Proc Nat Acad Sci. 2005;102:15762–15767. doi: 10.1073/pnas.0507263102. [DOI] [PMC free article] [PubMed] [Google Scholar]
- 41.Knutson MD, Handelman GJ, Viteri FE. Methods for measuring ethane and pentane in expired air from rats and humans. Free Radic Biol Med. 2000;28:514–519. doi: 10.1016/s0891-5849(99)00230-0. [DOI] [PubMed] [Google Scholar]
- 42.Paredi P, Kharitonov SA, Barnes PJ. Elevation of exhaled ethane concentration in asthma. Amer J Respir Crit Care Med. 2000;162:1450–1454. doi: 10.1164/ajrccm.162.4.2003064. [DOI] [PubMed] [Google Scholar]
- 43.Paredi P, Kharitonov SA, Leak D, Ward S, Cramer D, Barnes PJ. Exhaled ethane, a marker of lipid peroxidaton, is elevated in chronic obstructive pulmonary disease. Amer J Respir Crit Care Med. 2000;162:369–373. doi: 10.1164/ajrccm.162.2.9909025. [DOI] [PubMed] [Google Scholar]